Let's see what the charts say is going on. The overall picture is very interesting.
First we have the SPYs
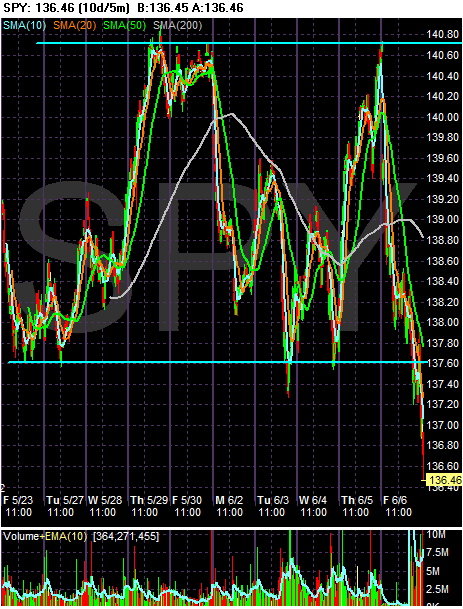
On the 10 day, 5 minute chart notice the SPYs have been bouncing between 137.60 and about 140.70 for the last ten days. We've started this 10-day period (2 weeks ago) down around 137.60, then spiked to 140.60 level on May 29 and 30. Prices dopped back down to the 137.60 area by last Wednesday, but they rallied again on Thursday. Then came Friday, when prices moved below the 137.60 level in a convincing way. Also note the heavy volume spike at the end of trading -- no one wanted to hold anything over the weekend. This indicates a great deal of concern among traders.
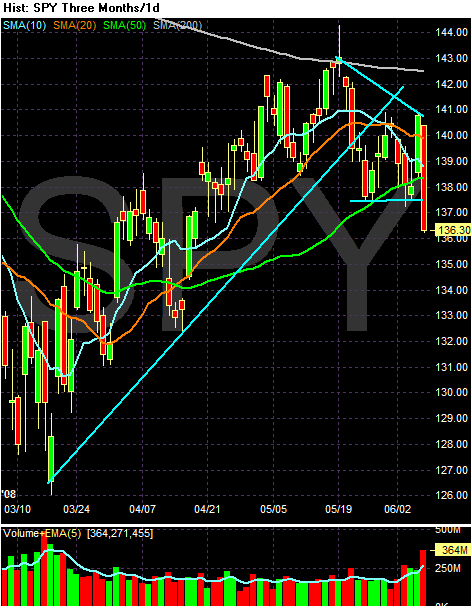
On the SPYs weekly chart, notice the following:
-- Prices hit the 200 day SMA about two and a half weeks ago. Since then they have retreated. Prices could not get across the 200 day SMA.
-- Prices dopped to the 50 day SMA, rallied to the 10/20 day SMA, fell back, rallied again, and are now through the technical support offered by the 50 day SMA.
-- The 10 and 20 day SMA are both moving lower
-- The 10 day SMA crossed below the 20 day SMA.
This chart is turning bearish.
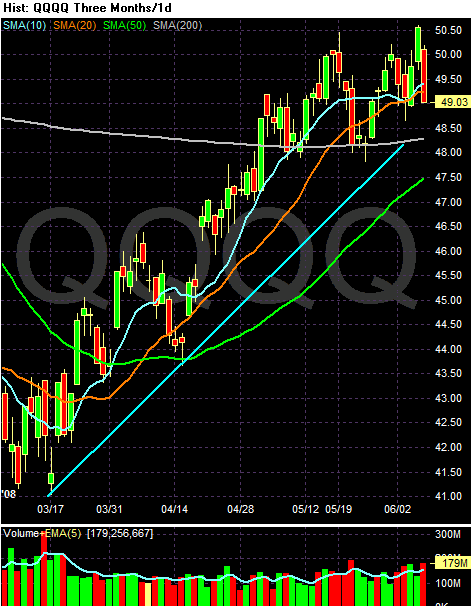
On the QQQQs 3 month chart, notice the following
-- The chart is still in an uptrend
-- The 10, 20 and 50 day SMAs are all moving higher.
-- The smaller SMAs are above the longer SMAs
-- Prices are above the 200 day SMA
In other words -- this is still a good chart. While you could argue the index may be forming a double top, we're still way too early to make a formal call.
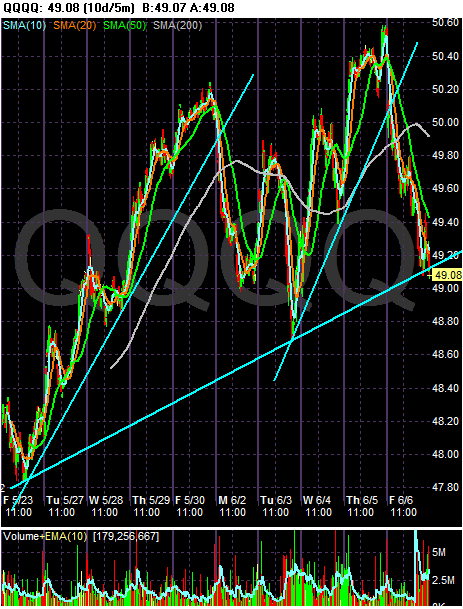
On the 10-day chart, notice the overall trend is up, and there are some minor ups and downs. However -- also notice that prices closed just below the 10-day trend line on Friday. That makes today's open that much more important.
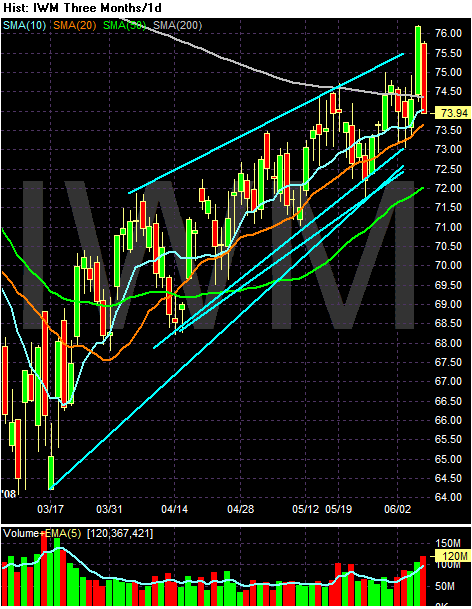
On the IWMs 3-month chart, notice the following:
-- The chart is still in an uptrend
-- Prices made a convincing move above the 200 day SMA on Thursday, but quickly retreated below that level on Friday's sell-off
-- The 10, 20 and 50 day SMAs are all moving higher
-- The 10 day SMA is > 20 day SMA which is > 50 day SMA -- a bullish alighment
-- Prices retreated to the 10 day SMA on Friday's sell-off
This is still a bullish chart
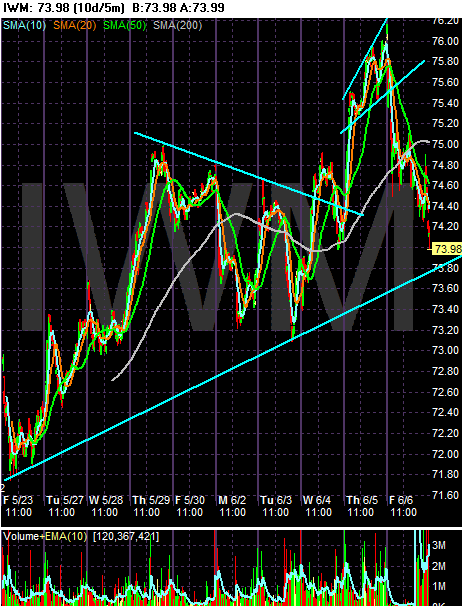
The 10 day, 5-minute chart of the IWMs still has an upward bias. There have been two mini-rallies and sell-offs, but the overall trend remains.
So -- what does all of this mean?
The SPYs are in danger of turning bearish, but the QQQQs and IWMS still have strong formations. The question now becomes "will the SPYS lead the market lower, or will the other averages pull the market higher?"