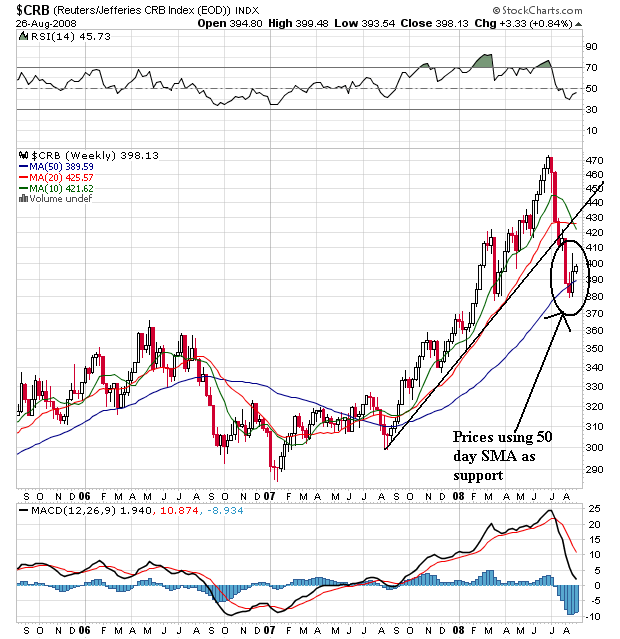
Starting at the end of last summer, the commodities index started rallying. The rally lasted about a year. Prices would rally, sell-off and then rally again. Prices used the 10 and 20 day SMAs as their primary support. However, prices broke through support in July and are now below the upward sloping trend line of the rally started at the end of summer 2007. Prices have moved through the 10 and 20 week SMA, but have bounced off the 50 week SMA for now.

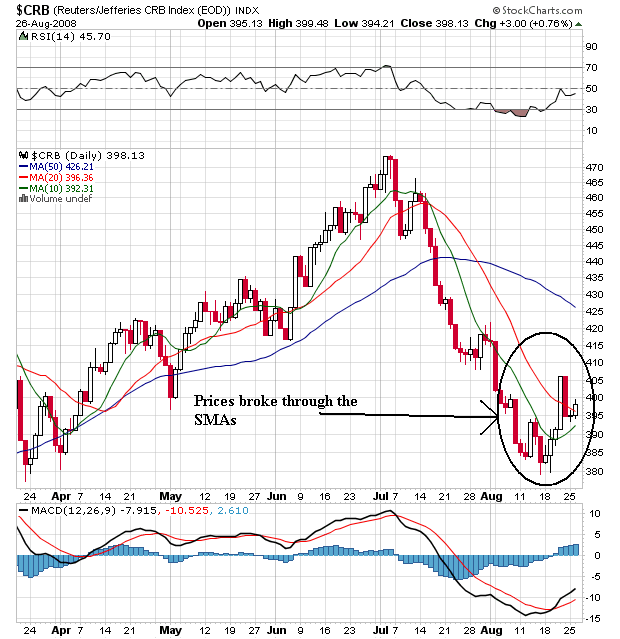
On the daily chart, notice the following:
-- The 20 and 50 day SMA are still heading lower
-- the 10 day SMA is moving higher
-- Prices have moved through the 10 and 20 day SMA
-- Prices are currently using the 20 day SMA as technical support
This is a chart in transition. My guess is we're going to see a sideways consolidation that will form either a rectangle or triangle consolidation pattern.