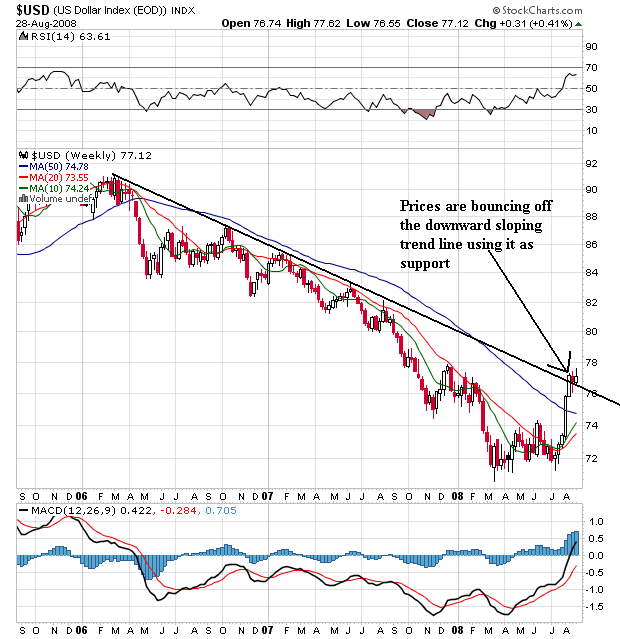
On the long-term chart, notice the following:
-- Prices have moved above the long-term downward sloping trend line that started over two years ago. This is a major break and signals a big change in the dollar market. Also notice prices are consolidating recently made gains by bouncing off the trend line and using it as support. Both of these developments are technically important and indicate a trend reversal may be in play
-- Also note the 10 and 20 week SMA are now moving higher. These are also important developments. Weekly SMAs take longer to change direction. As a result, when they do change direction it's important to take note.
-- Prices are about the 10, 20 and 50 week SMA. This will continue to pull these numbers higher which is another long-term bullish indicator.

On the weekly chart, notice the following:
-- The SMAs are aligned very bullishly. The shorter SMAs are above the longer SMAs and all the SMAs are moving higher.
-- Prices are above the SMAs, which will pull these numbers higher
-- Prices are currently using the 10 day SMA as technical support
This is a bullish chart, although I would not be surprised to see a pullback to the 20 day SMA.