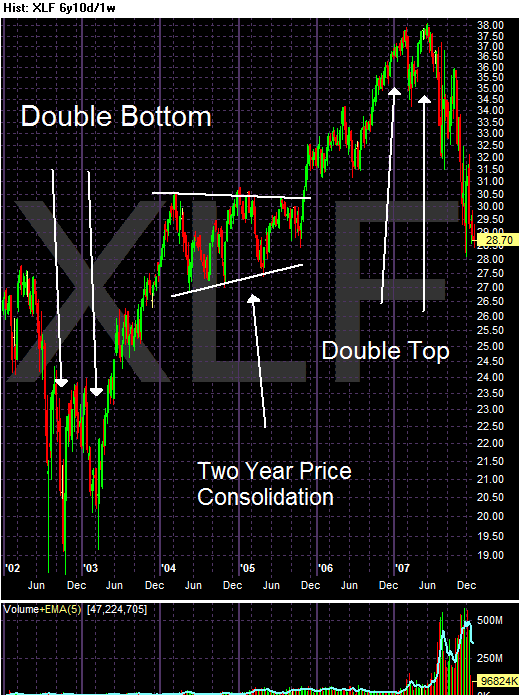
In late 2002 and early 2003 the sector formed a double bottom. It rose from this bottom at about 20 to 30 in early 2004. That's an increase of 50%. The sector consolidated its gains from 2004 to 2005. The sector started rising at the end of 2005 until mid 2007, moving from 30.5 to 38, or an increase of roughly 23.5%. The sector formed a double top in mid-2007 and has been dropping on heavy volume since.

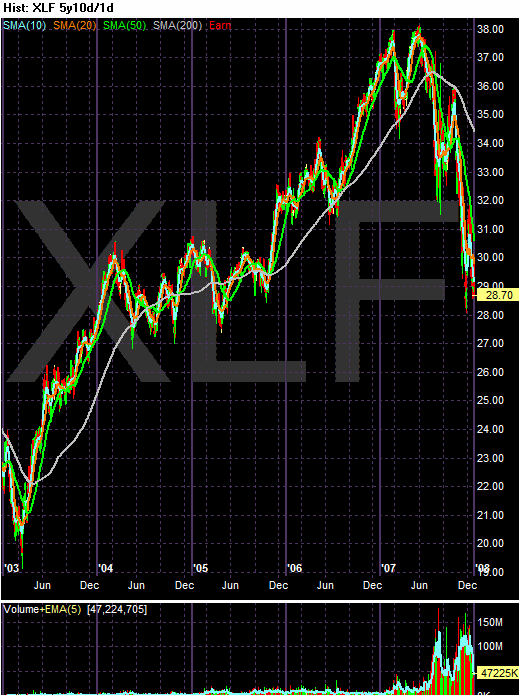
From a simple moving average perspective, notice the index has used the 200 day SMA for support for the last year and a half. It bounced off the 200 day SMA twice. But now the index is below that index indicating we're in bear market territory.

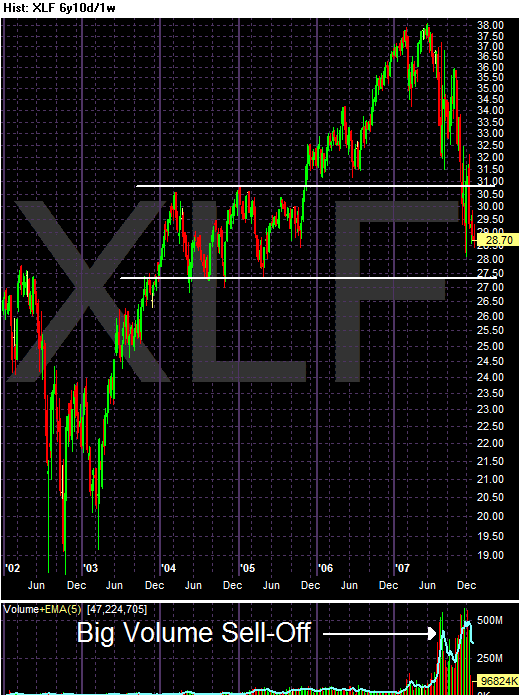
Notice the sector has sold-off about 50% of it's total 4.5 year rally. It has done so quickly on heavy volume. The sector is also between important price levels established during its 2004 - 2005 consolidation.

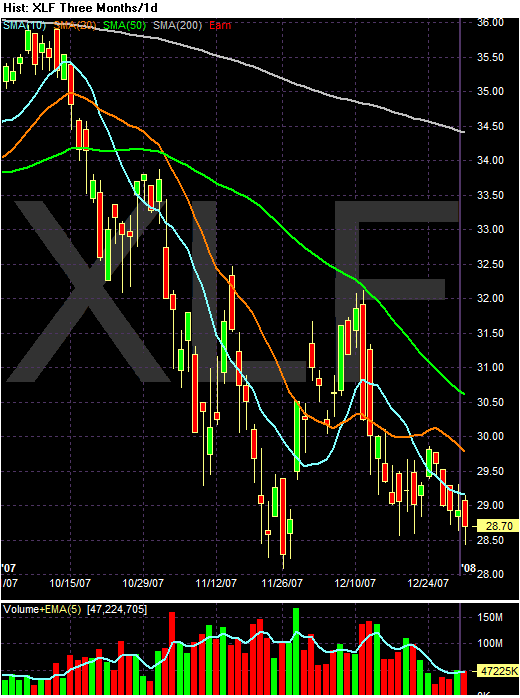
On the short-term chart, notice that
-- the shorter SMAs are below the longer SMAs
-- prices are below the SMAs
-- all the SMAs are headed lower.
In other words, expect the sell-off to continue.