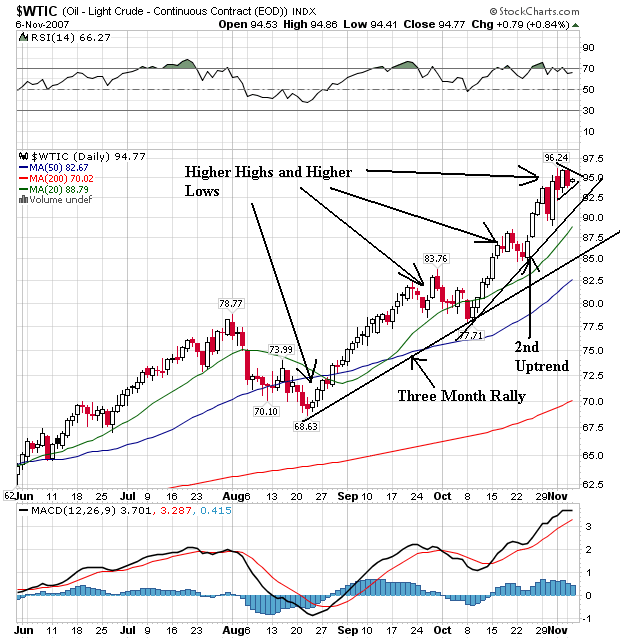
Oil's daily chart is strong. It is in the middle of a three month rally which has a consistent pattern of higher highs and lower lows. Prices have continually moved through previous levels. There are two trend lines in place. All of the simple moving averages (SMAs) are moving higher, the shorter SMAs are above the longer SMAs and prices are above all the SMAs. This is a great example of a bull chart.
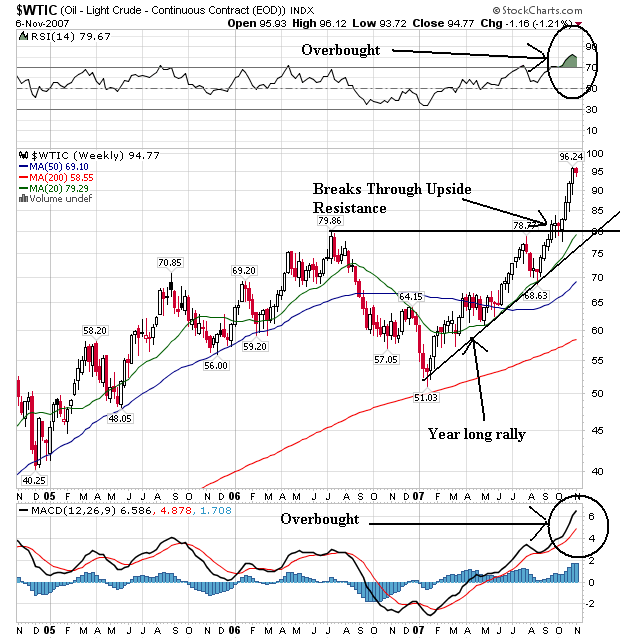
The weekly chart shows an uptrend that started at the beginning of the year. It also shows prices moved through the July 2006 level, consolidated just above that level and then continued higher. The main drawback to this chart is the overbought reading on the RSI and MACD. However, these do not completely determine market direction; these readings could stay pegged for some time.
So -- the underlying commodity of this sector is in a very clear bull market. Let's see what the ETF looks like.
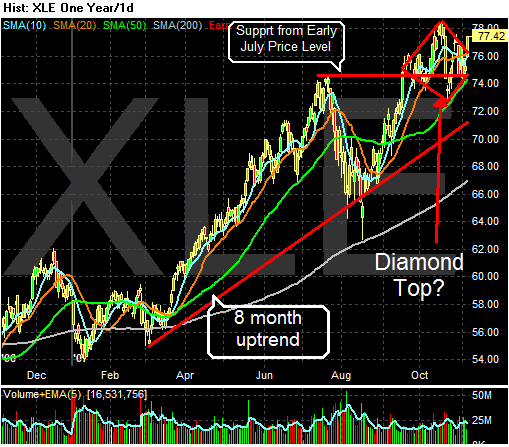
The ETF is in the middle of an 8-month uptrend. Current prices are receiving strong support from the mid-July high. A diamond top may be forming, but prices also broke out from that pattern yesterday thanks to oil's record close. The 50 and 200 SMAs are both moving higher, but the shorter SMAs are a bit bunched up indicating a lack of direction. Yesterday's price break out is a good start, but prices need to move above the mid-October high to indicate a new uptrend is in place.
According to Yahoo finance, the largest stocks in the sector are Exxon, Chevron, Schlumberger, Occidental Petroleum and Conoco Phillips. We'll take them in order of largest percentage of the index to the smallest.
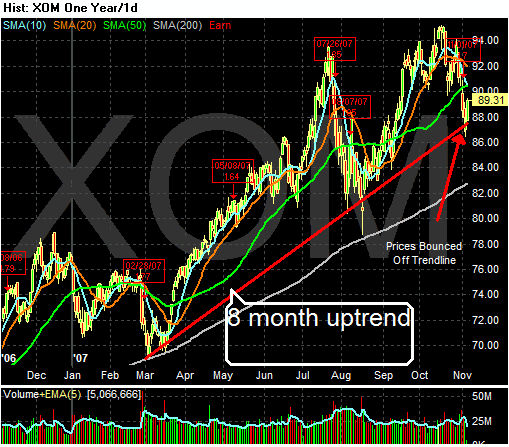
Exxon is in the middle of an 8-month long rally. It has bounced off the trend line twice. Yesterday's bounce printed a very strong bar. The bearish side of the chart notices the 10 and 20 day SMA moving lower with the 10 day about to cross the 50 day SMA. However, the strength of yesterday's bar along with the oil market's rally provide a strong reason for this bounce to continue.
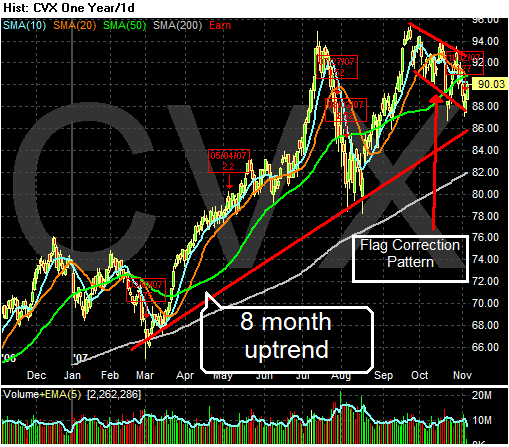
Chevron is in the middle of an 8 month rally, but is also in the middle of a month-and-a-half long flag correction. The shorter SMAs are headed lower and the chart may have printed a double top with the first top in early July and the second in late September. However, the stock hasn't moved out of the flag pattern, indicating it may simply be going through a standard correction before it moves higher.
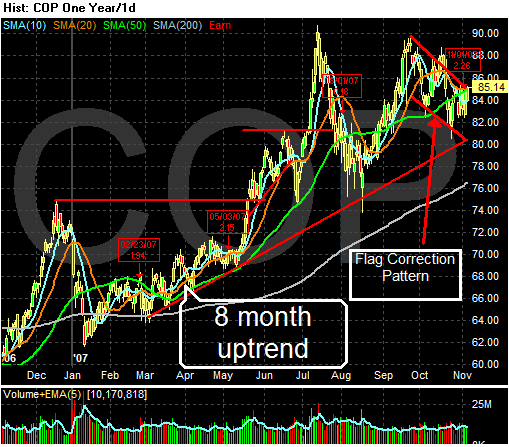
Conoco Phillips chart mirrors Chevron's in many ways. The main difference is prices are at the top of its respective flag pattern. Should they move through resistance this stock could be looking at a 3-5 point move.
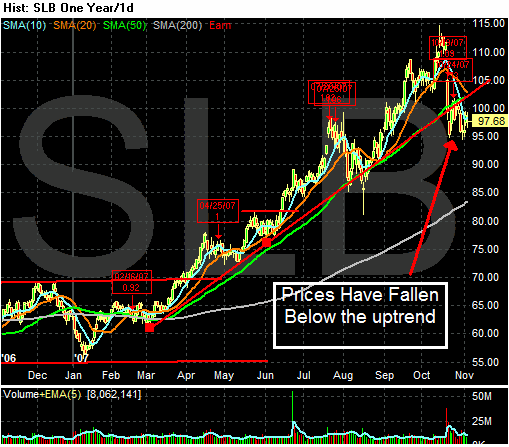
Schlumberger is the only bad stock in the bunch. It has broken through its 8 month long uptrend indicating a clear change of direction. Although prices are consolidating right below the trend line, the shorter term SMAs are both headed lower indicating the short-term trend is down.
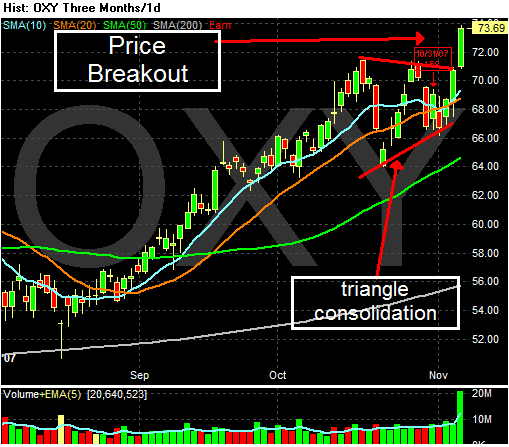
Occidental Petroleum printed a month long triangle consolidation and is now breaking out of that pattern on strong volume. Here is the year long chart
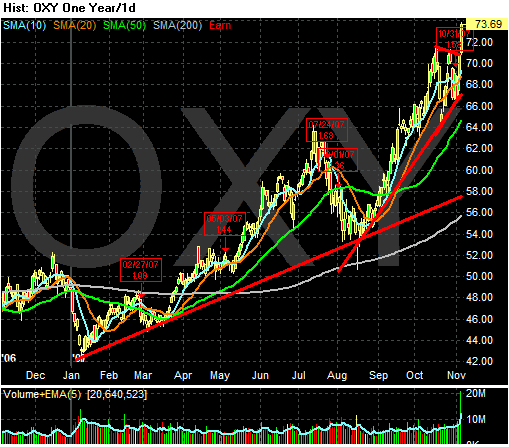
Which shows a definite uptrend in place.