First, here is a chart from Prophet.net of the department store sector.
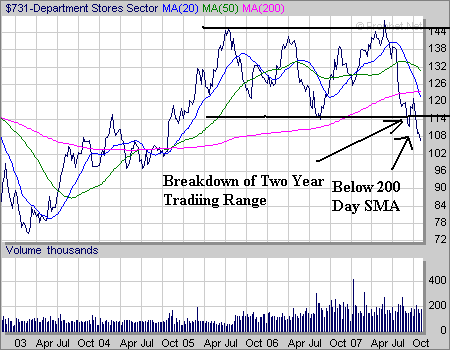
There are several significant points to make about this 5-year chart.
1.) Most importantly, the index broke a two year long trading range.
2.) The index is trading below all of its SMAs.
3.) The index is below the 200 day SMA, indicating bear market territory.
4.) The 20 and 50 day SMAs are both headed lower.
All in all, this chart says "sell me....now."
According to Yahoo finance the five largest stocks in this index by market cap are Sears Holdings, Kohls, Macy's TJ Maxx and J.C. Penney. Let's see how those individual charts look.
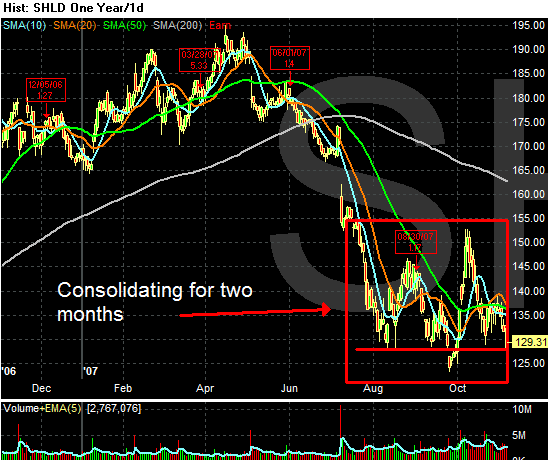
Sears is below the 200 day SMA. It dropped hard with the summer's sell-off and has yet to rally convincingly from that sell-off. Right now it's consolidating. The 10, 20 and 50 day SMAs are all bunched together indicating there is no clear short-term trend in place. But a move below 125 would indicate further selling is underway.
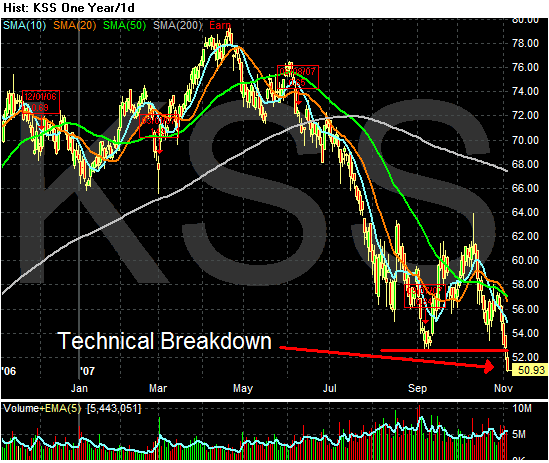
Like Sears, Kohls sold-off during the summer. But this stock has fallen through technical support on strong volume. In addition, the 10, 20 and 50 day SMAs are all heading lower indicating the short-term trend is down. Finally, the stock is convincingly below the 200 day SMA, indicating its already in bear market territory.
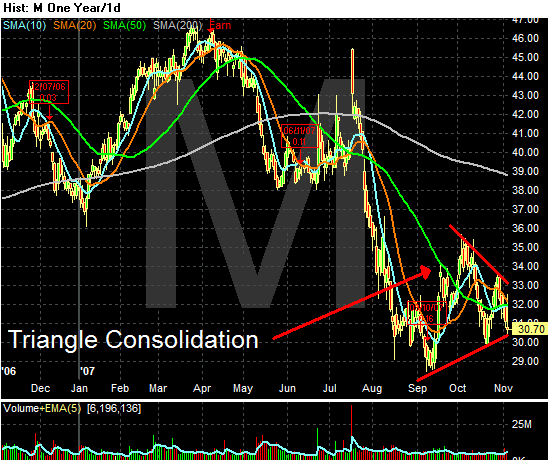
Macy's chart resembles Sear's. It sold-off in the summer, but is currently consolidating in a triangle consolidation pattern. Finally, it too is in bear market territory.
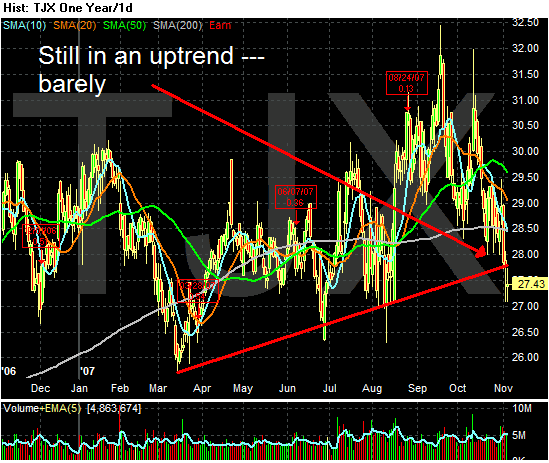
TJ Max is hugging its upward trend line like nobody's business. Today it moved though support. In addition, the stock has moved below the 200 day SMA, but it has been flirting with this line since April. In addition, the 10, 20 and 50 day SMAs are all heading lower. This chart stinks -- and it is the best one of the lot.
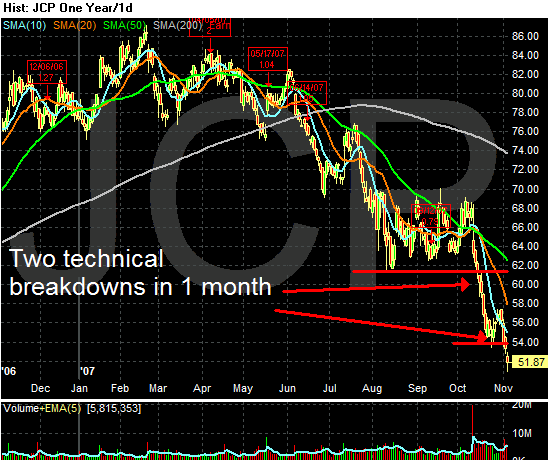
JC Penney is below the 200 day SMA, the 10, 20 and 50 day SMAs are all headed lower (as is the 200 day SMA), the shorter SMAs are below the longer SMAs and prices are below all the SMAs. This chart says sell me -- NOW.
It looks like the big department stores were definitely naughty this year.