- by New Deal democrat
My Weekly Indicators post is up at Seeking Alpha.
- by New Deal democrat
My Weekly Indicators post is up at Seeking Alpha.
- by New Deal democrat
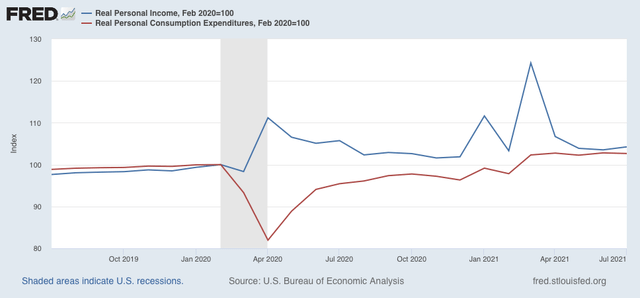
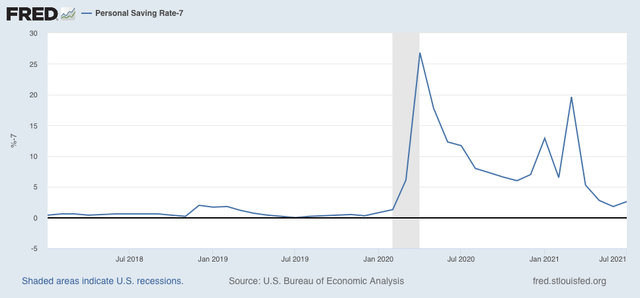
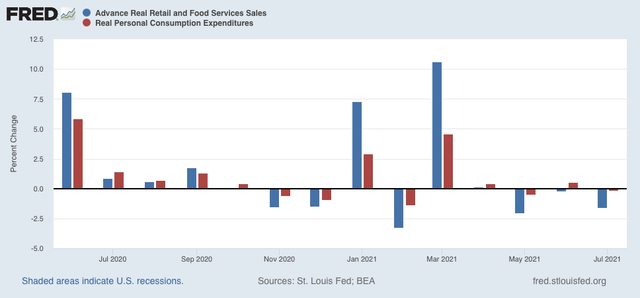
How well personal income and spending held up throughout the pandemic is one of the best things about the government response. That has continued to be the case as of this morning’s report for July.


- by New Deal democrat
The good news for both initial and continued claims continued this week.
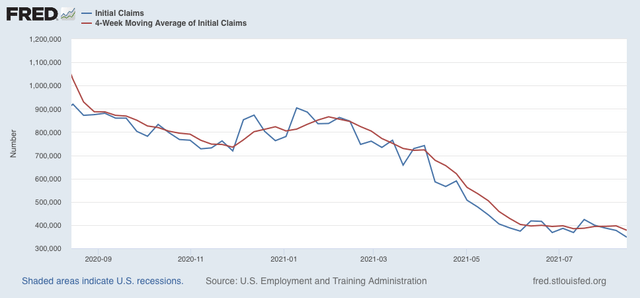
Initial jobless claims rose 4,000 to 353,000 from last week’s pandemic low. The 4 week average of claims declined by 11,500 to 366,500, another new pandemic low:


- by New Deal democrat


Here
- by New Deal democrat
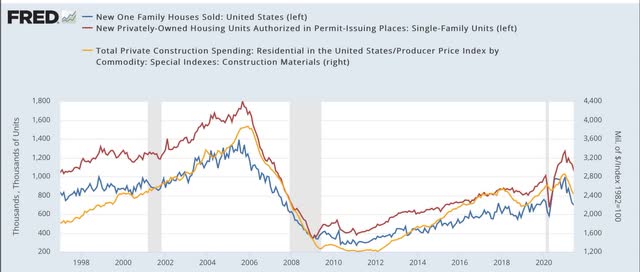
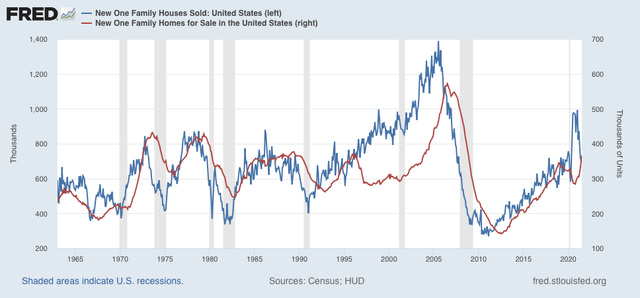
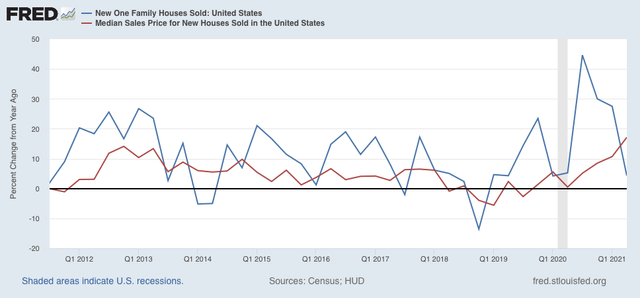
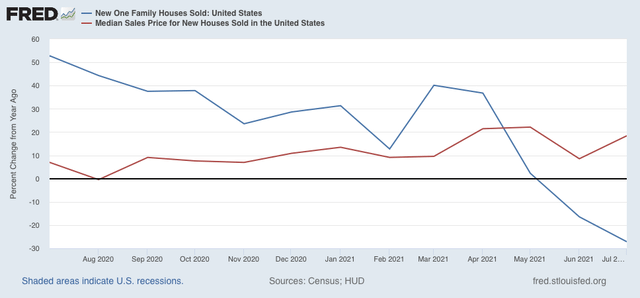
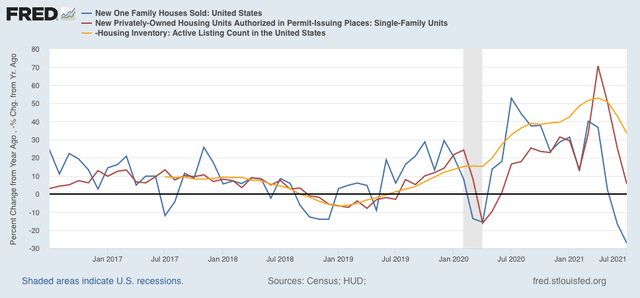
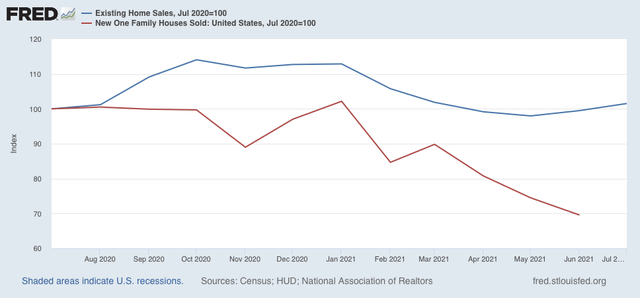
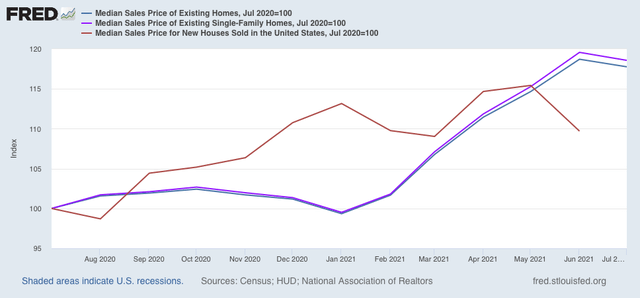
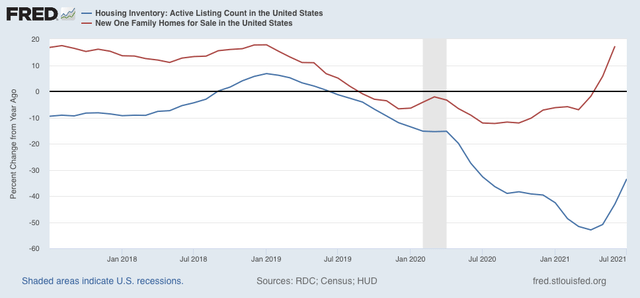
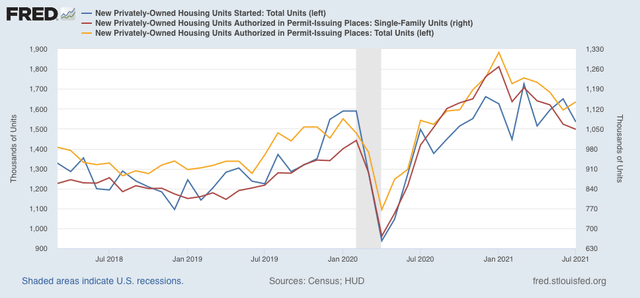
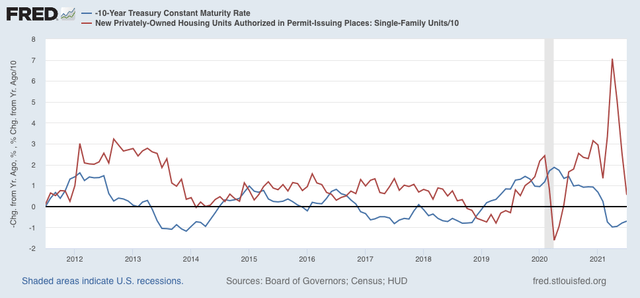
Unlike yesterday’s existing home sales, today’s report on new home sales is much more economically significant. The reason I prefer single family housing permits as a measure is that the sales data is extremely volatile, and heavily revised over the next several months. But with those caveats, let’s take a look.


- by New Deal democrat
Existing home sales are the least noteworthy of the housing data, because of the very limited economic activity moving into or out of an existing home provokes compared with the construction, furnishing, and landscaping of a new home. But it’s worth a brief look, so let’s note this month’s report.


- by New Deal democrat
My Weekly Indicators post is up at Seeking Alpha.
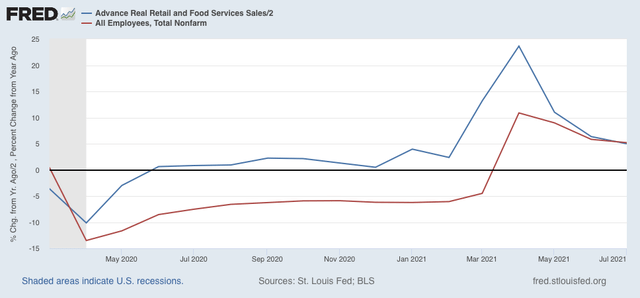
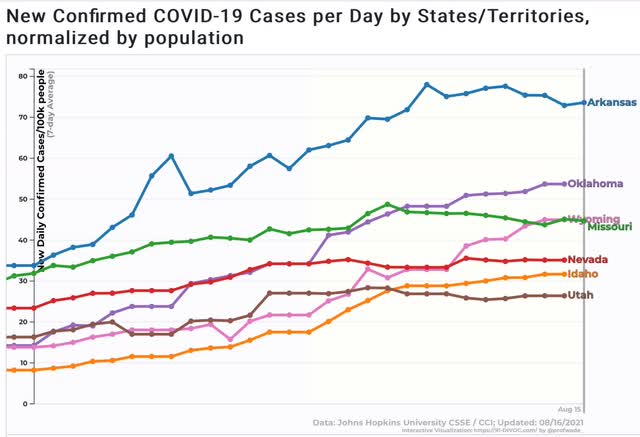
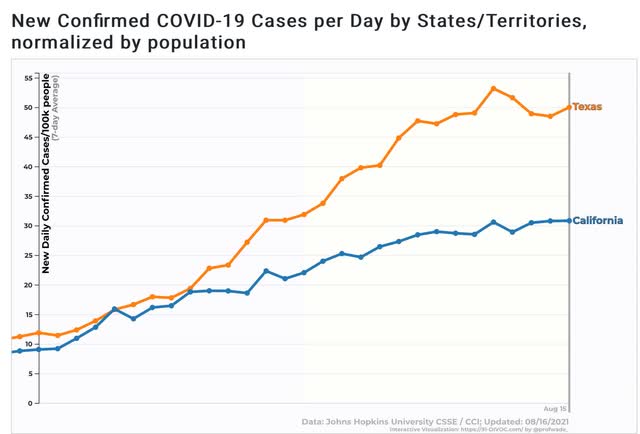
Surprisingly, Delta still has not made much of an impact on the coincident indicators. People as a whole are still out shopping and dining with nearly full enthusiasm. And there are signs that the Delta wave is beginning to peak.
As usual, clicking over and reading will bring you up to the virtual moment on the economy, and bring me some pocket change for brunch.
- by New Deal democrat
Following up on Wednesday’s post here, I took a comprehensive look at housing construction and sales, and their implications for the 2022 economy, over at Seeking Alpha.
As usual, clicking over and reading should be educational for you, and additional for me by a few pennies in my financial condition.
While I am at it, I haven’t updated my Big Picture short term and long term forecast for the economy since February, so I expect to do that at some point in the next week.
- by New Deal democrat
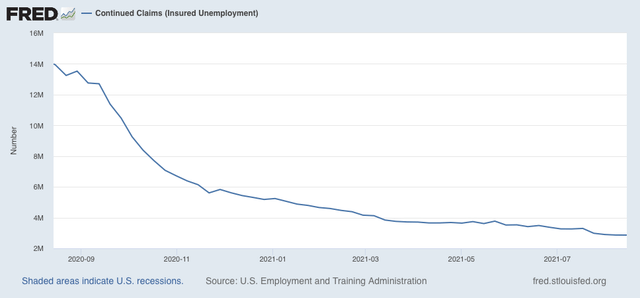
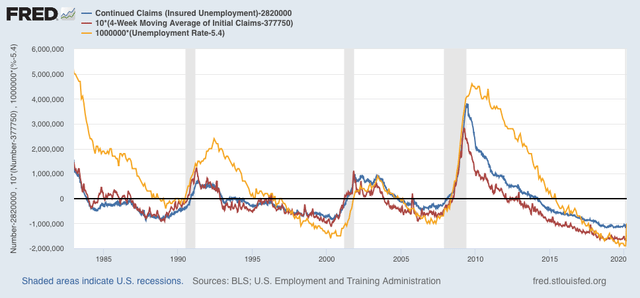
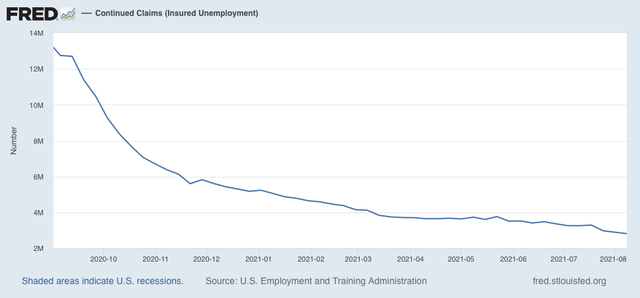
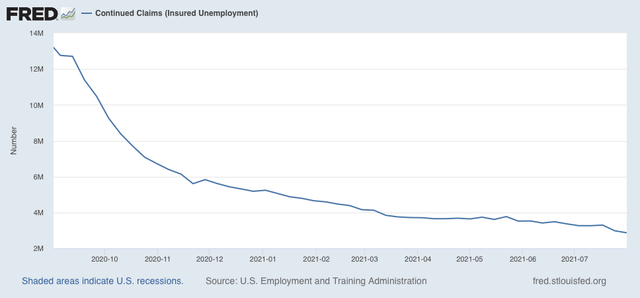
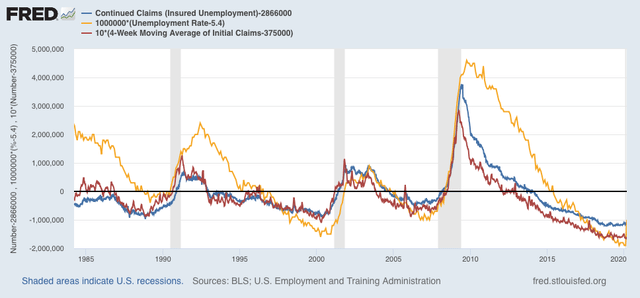
The bottom line for both initial and continued claims this week is simple: unadulterated, absolute good news.
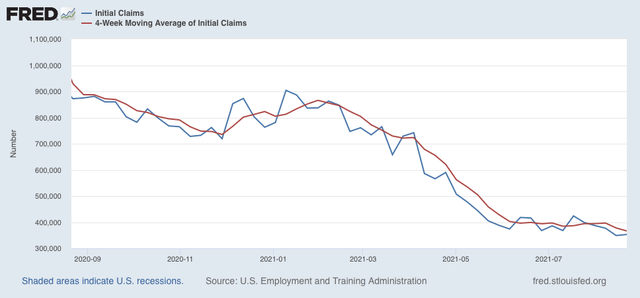
Initial jobless claims declined 29,000 to 348,000, 20,000 below their previous pandemic low. The 4 week average of claims declined by 19,000 to 377,750, 6,750 below its previous pandemic low of 384,500:


- by New Deal democrat
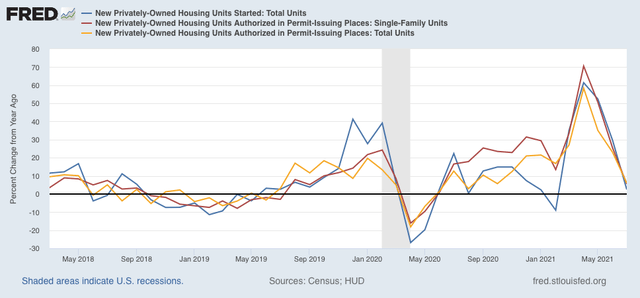
Last month I noted that, from here on, the comparisons with 2020 in housing would become much more challenging. And so they have.


- by New Deal democrat
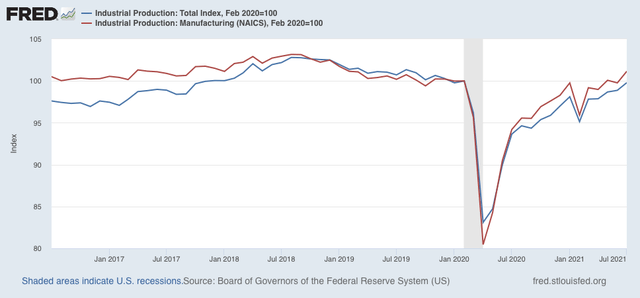
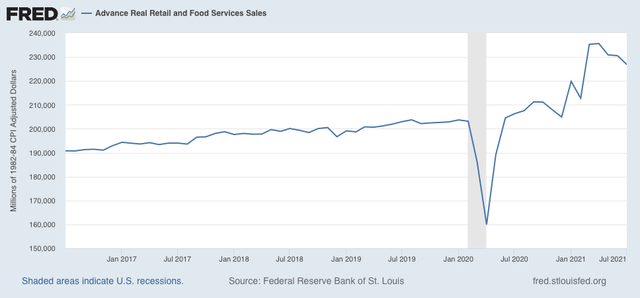
This morning brought the July report for the King of Coincident Indicators, industrial production, as well as one of my favorite consumer side indicators, retail sales. Let’s take a look at each.


- by New Deal democrat
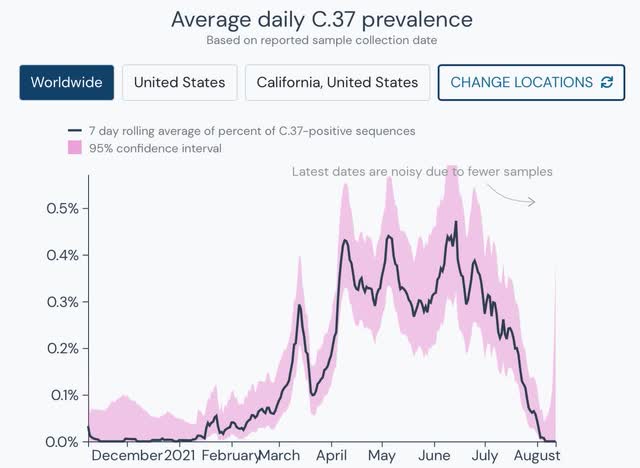
The Lambda variant is going out like a lamb. (from the hard to find pandemic good news list) https://outbreak.info/situation-reports?pango=C.37… It can't compete with Delta.


- by New Deal democrat
My Weekly Indicators post is up at Seeking Alpha.
For the first time, there are some significant if still minor impacts on the economy showing up due to the Delta wave.
As usual, clicking over and reading will bring you up to the virtual moment as to the economy, and help me out a little bit with my lunch money.
- by New Deal democrat
I want to follow up on a comment I made yesterday in connection with Wednesday’s consumer price report.


- by New Deal democrat
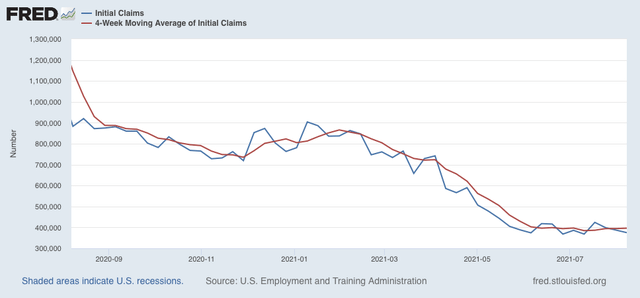
Initial jobless claims declined 12,000 this week to 375,000, still 7,000 above their best pandemic levels of 368,000 set on June 26 and July 10. The 4 week average of claims increased by 1,750 to 396,250, 11,750 above its pandemic low of 384,500 set on July 10:


- by New Deal democrat
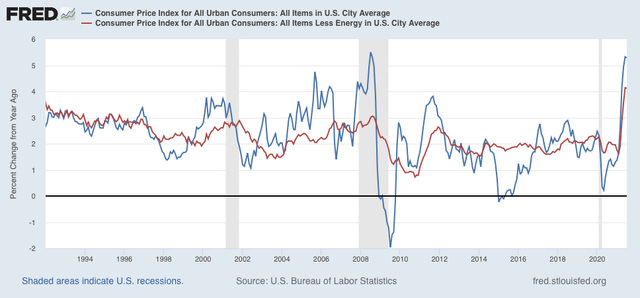
For the last two months my theme has been that if the spike in inflation only lasted two or three months, it was not a big deal, but if the trend were to continue longer, it would begin to impact consumer spending, and it will get the Fed’s attention.
In that regard, the “good” news is that in July consumer inflation was “only” 0.5%. The bad news is that for the last 5 months alone, consumer prices have risen 3.5%. Further, while inflation was only confined to a few sectors, those sectors were houses andcars - the two most important purchases made by most consumers - and the gas with which to power those cars, the most visible of all prices.
Let’s break it down.
While YoY inflation was 5.3% (blue in the graph below), typically it has not been a concern unless inflation ex-gas (red) has been in excess of 3.0%. Since it is now over 4%, unless it ramps down shortly, as in 2011, this is indeed a concern:

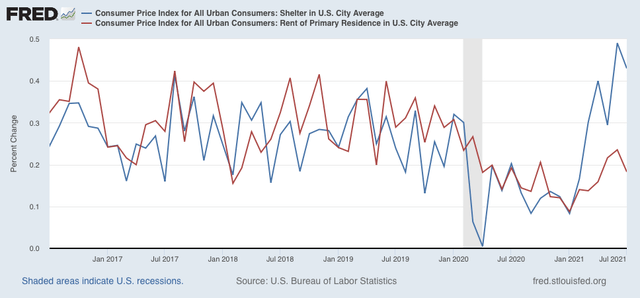
Inflation in shelter (blue in the graph below) has risen sharply m/m for the past 6 months. In the past 4 months, the trend in rent increases (red) have also increased m/m (although they are not up nearly as much as they were before the pandemic):

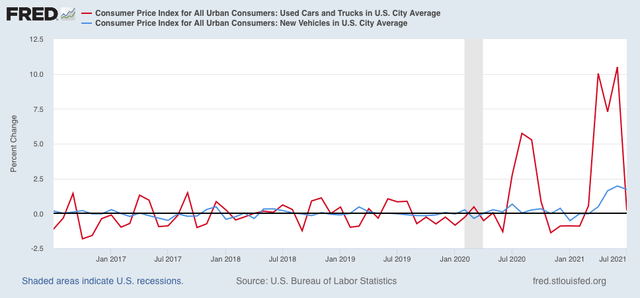
New car prices have increased sharply each month for the past few months, while in July used car prices may finally have hit a wall:

The building of new houses, and the manufacture of new vehicles are the two most forward looking, learning sectors of the “real” economy. That price pressures are now constraining both is not good for the economy going forward into 2022.
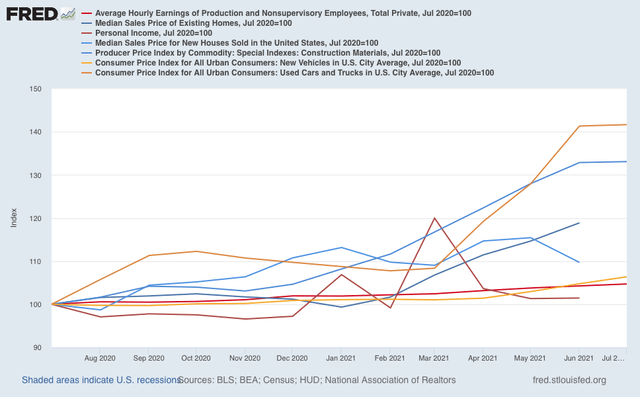
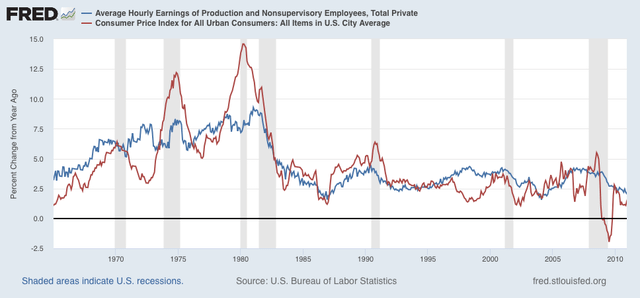
Returning to inflation ex-energy, now over 4% YoY, If this number goes back down below 3% quickly, then consumers can live with that. If not, however, and particularly if wages fail to keep up, then consumers may cut back on other purchases. In fact, wages (more broadly, household income) failing to keep pace with inflation has been one of the tradition “real” harbingers of a recession. Here the news is mixed.
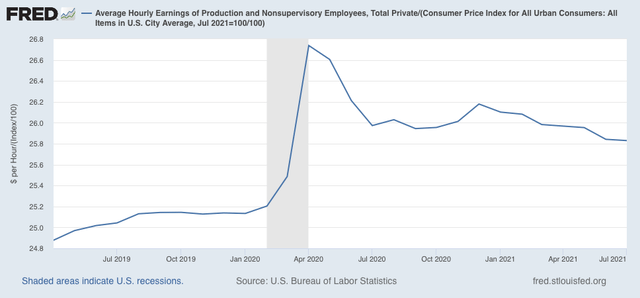
Real hourly wages, I.e., wages deflated by consumer prices, declined slightly in July. Further, while real wages have been more or less flat in the past year, they are down over 1% from their pandemic peak. But on the other hand, they are still up over 1.5% since before the pandemic began:

The big fly in the ointment here is the expiration of many emergency pandemic programs, even as the Delta wave rages.
We really need to see the main drivers of this so-far transitory inflation spike subside: microprocessors for vehicles, and construction materials for houses. The latter will be reported for July as part of the PPI which will be released tomorrow.
The other two important variables are the course of the pandemic, and whether or not emergency measures are renewed if the pandemic does not subside. So far the bond market does not seem concerned, and bank credit as I reported recently has been expanding. If that continues, the economy should continue to do well. But if the pandemic itself, or an inept government response to it cause a crash landing, all bets are off.
Addendum: I note where, inter alia, Paul Krugman lauds this report as demonstrating that inflation has indeed been transitory. I demur. For example, used car prices only increased 0.2% in July. But they are still up 41.7% YoY! Truly transitory inflation in a resource-constrained boom shouldn’t just plateau after a huge price increase, it should ramp right back down, as lumber prices in housing have done, plummeting all the way back down to 2018 prices. It is this ramping back down which was missing in yesterday’s consumer inflation report.
- by New Deal democrat
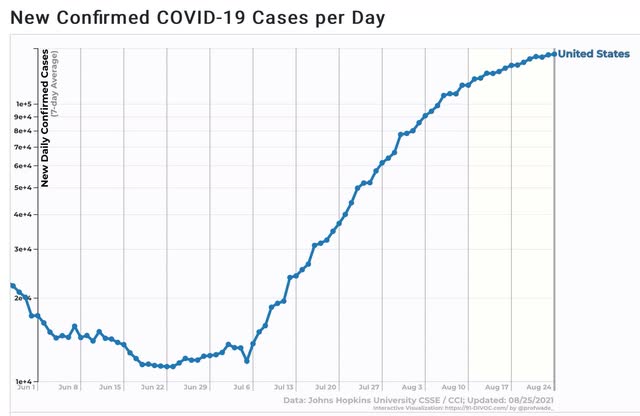
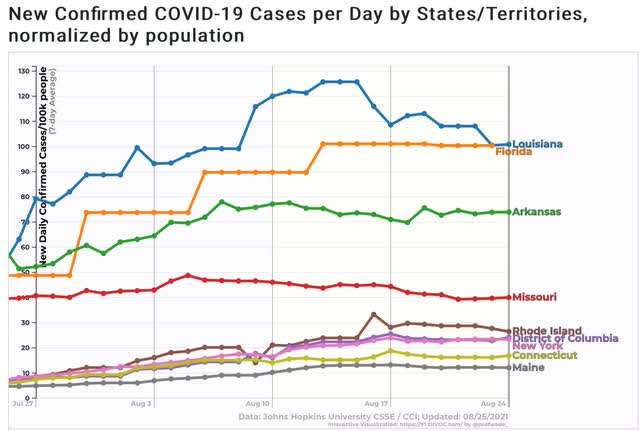
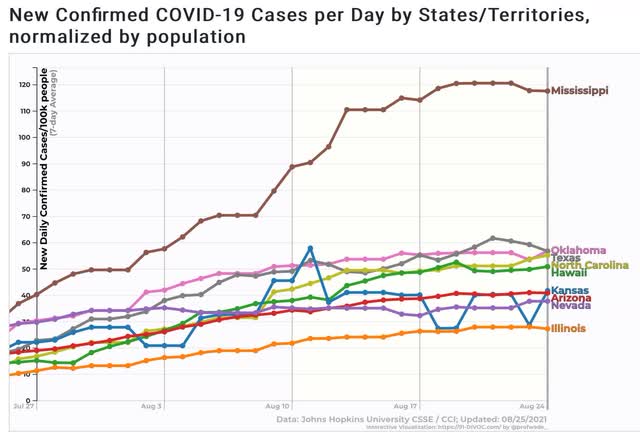
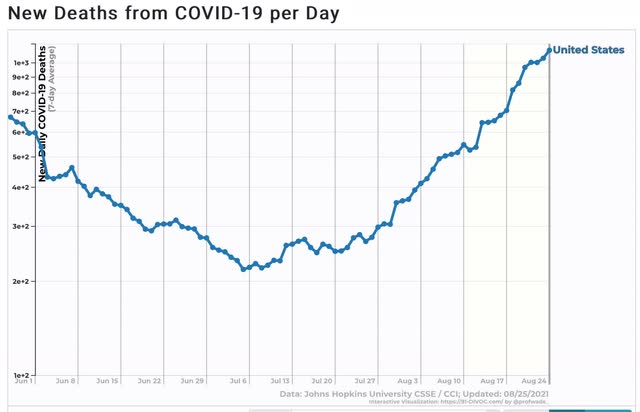
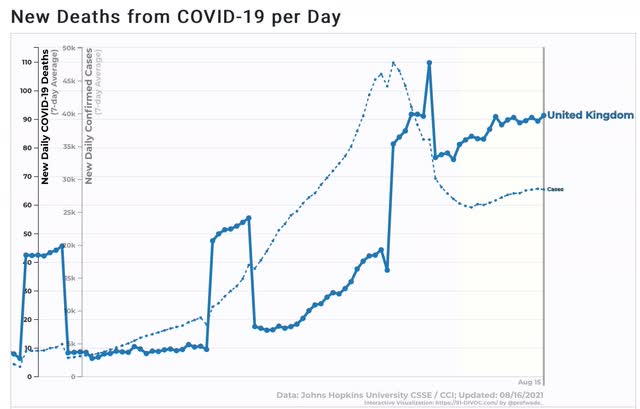
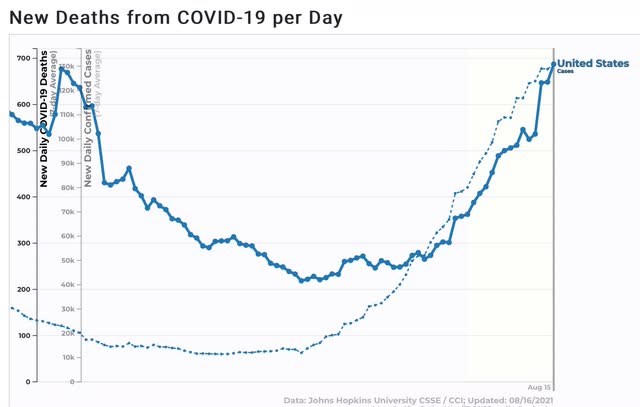
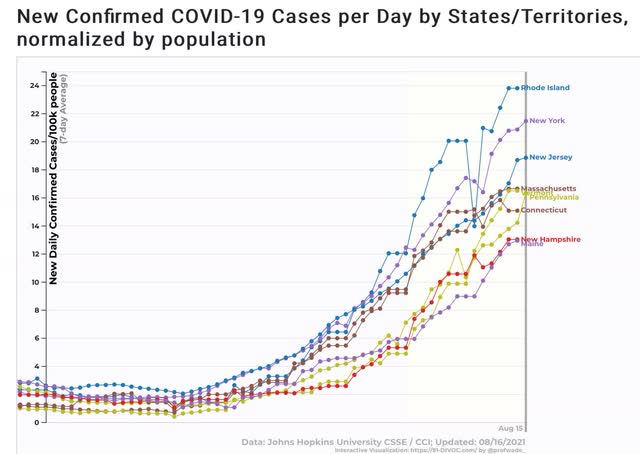
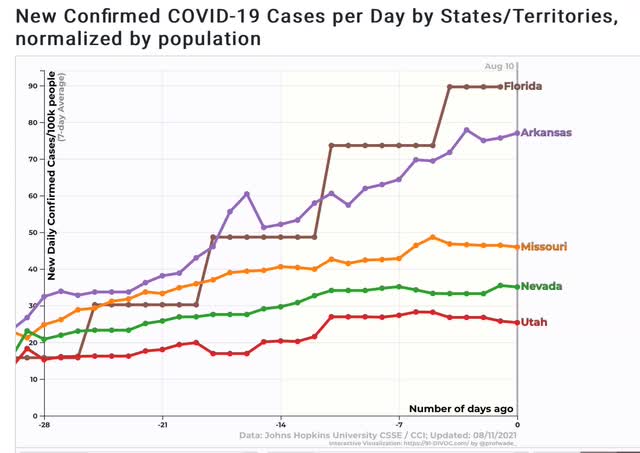
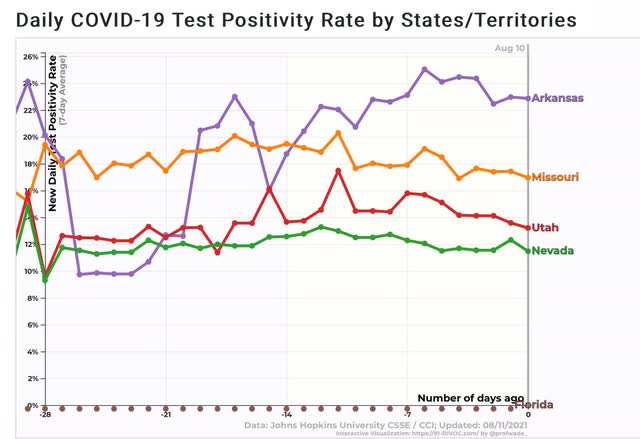
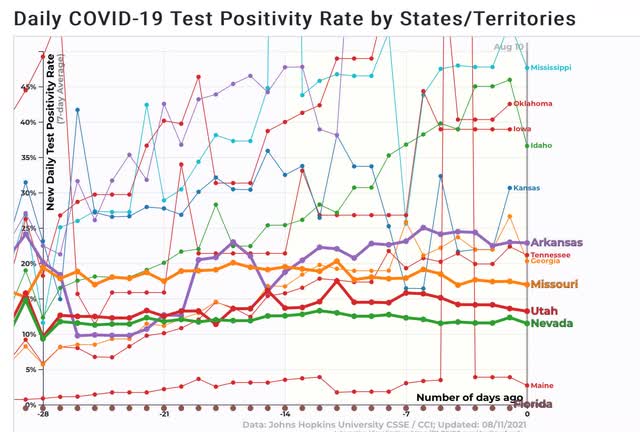
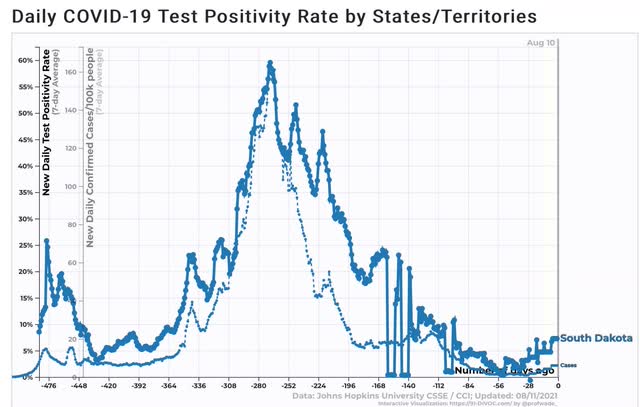
My framework of analyzing the economy via leading, coincident, and lagging indicators continues to come in handy at looking at the course of the pandemic.


- by New Deal democrat
[Note: I haven’t put up a Coronavirus dashboard in almost a week. I’ll try to get around to that later today or tomorrow. It isn’t *all* bad news.]