Saturday, February 23, 2019
Weekly Indicators for February 18 - 22 at Seeking Alpha
- by New Deal democrat
My Weekly Indicators post is up at Seeking Alpha.
The short leading indicators have sunk to a level that is consistent with an oncoming recession in the next 3 - 8 months. But the recent government shutdown may still be skewing some of the data.
As always, not only is clicking and reading hopefully informative for you, but it also helps reward me a little bit for the effort I put in to this work.


Friday, February 22, 2019
Housing may bottom this spring
- by New Deal democrat
Despite yesterday’s poor existing home sales report, which was the worst in over three years, the bottom in housing may be near.
This post is up at Seeking Alpha. As always, reading the post should be helpful to you, and renumerates me just a bit for my efforts.
Thursday, February 21, 2019
Industrial transportation stalls out
- by New Deal democrat
The two main forms of transporting goods, rail and trucking, have both gone negative YoY, and on average over the last 3+ months are only slightly better than zero. This both has implications for the broader economy, and confirms some other poor data.
This post is up at Seeking Alpha.
Wednesday, February 20, 2019
100 years of industrial production
- by New Deal democrat
This is a post that can literally be written only once in 100 years!
Because as of last Friday, it has been exactly 100 years since the first publication of industrial production by the Fed in January 1919. So this is a good time to take a sweeping historical look at production in the United States.
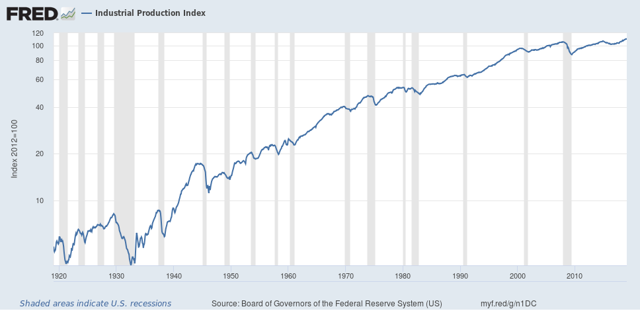
The first graph below is the entire 100 year history, on log scale so that equal percentage changes in each time period are calibrated equally:
Because as of last Friday, it has been exactly 100 years since the first publication of industrial production by the Fed in January 1919. So this is a good time to take a sweeping historical look at production in the United States.
The first graph below is the entire 100 year history, on log scale so that equal percentage changes in each time period are calibrated equally:
A few features stand out: the Great Depression, the World War 2 boom, and two downshifts in the long term trend: first in the 1970s-1999, and second from 1999 to the present.
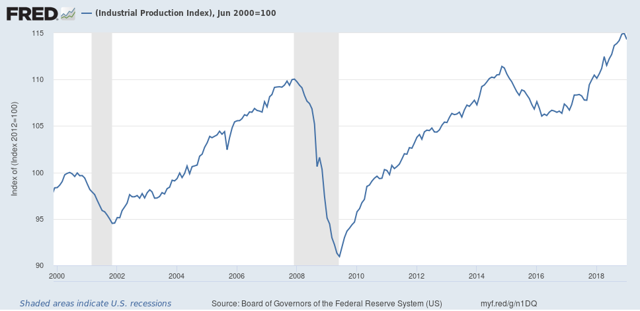
In fact, the past 20 years have been the slowest secular period since publication of industrial production started 100 years ago. As shown in the below graph, normed to 100 in June 1999, production has only grown 15% in the 20 years since. It grew just under 10% during the 2000s expansion, and only about 5% in the last 11 years:
In fact, the past 20 years have been the slowest secular period since publication of industrial production started 100 years ago. As shown in the below graph, normed to 100 in June 1999, production has only grown 15% in the 20 years since. It grew just under 10% during the 2000s expansion, and only about 5% in the last 11 years:
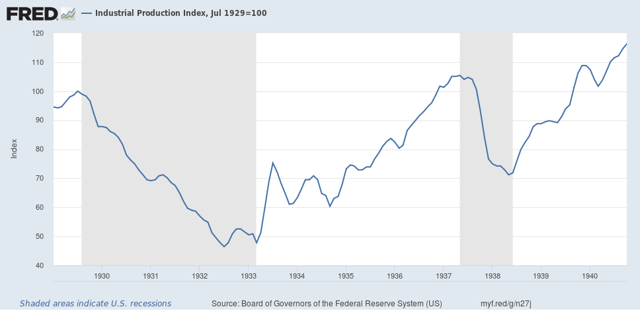
The worst previous period was the 1929-37 portion of the Great Depression, but even there production grew 6% by the end of that 8 year period, and exceed a 15% gain from 1929 by late 1940, 11 years later:
The situation is even worse when we subtract mining and utilities, and focus just on manufacturing. Here’s the 100 year log scale growth in that sector:
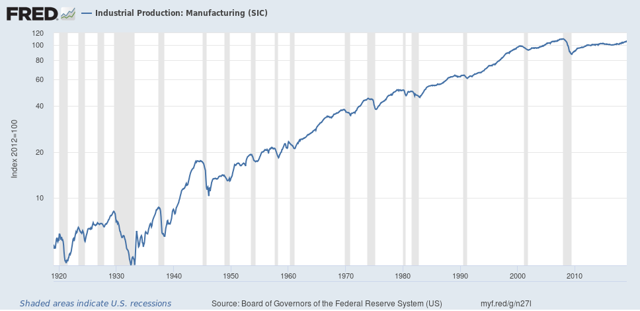
Note that growth has for all intents and purposes stopped since 1999.
Again focusing just on the last 20 years, we see that manufacturing production grew just 11% during the 2000s expansion, and even now 11 years later, has still not equaled the 2007 peak:
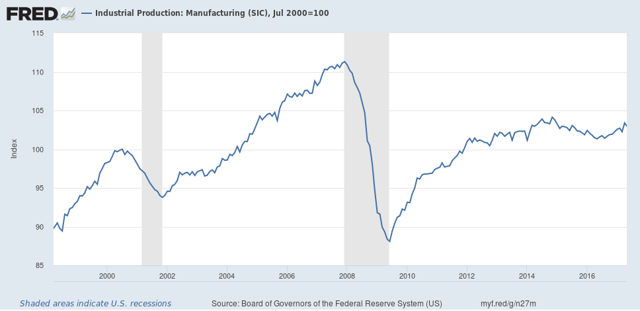
Total growth over the last 20 years in manufacturing has been just 3.4%.
Taking the long historical view shows the relative — and in the last decade, absolute — decline of the US as a manufacturing power. And it also puts paid to the notion that, at least in the last 20 years, the decline in manufacturing employment is mainly about productivity and mechanization. If it woeren’t for the rebirth of “Saudi America” in the energy sector over the last 10 years, industrial production growth in the US would have completely stopped.
Taking the long historical view shows the relative — and in the last decade, absolute — decline of the US as a manufacturing power. And it also puts paid to the notion that, at least in the last 20 years, the decline in manufacturing employment is mainly about productivity and mechanization. If it woeren’t for the rebirth of “Saudi America” in the energy sector over the last 10 years, industrial production growth in the US would have completely stopped.
Tuesday, February 19, 2019
Wages continued to improve through January
- by New Deal democrat
One item I didn’t get around to in the last couple of weeks is how wages performed as of January’s jobs report. And the basic answer is: pretty good!
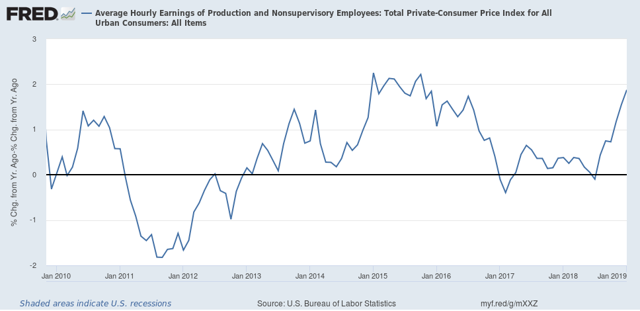
The first graph below shows real, inflation adjusted average wage gains for non-managerial workers measured YoY:
The first graph below shows real, inflation adjusted average wage gains for non-managerial workers measured YoY:
As of January they were up +1.9%. This is the best showing except for a few months in 2015.
As Jared Bernstein has shown, the “real” gains in wages have a lot to do with the price of gas (blue in the graph below). But in the last two months they have risen the most in the last 8 years in real terms ex-energy:
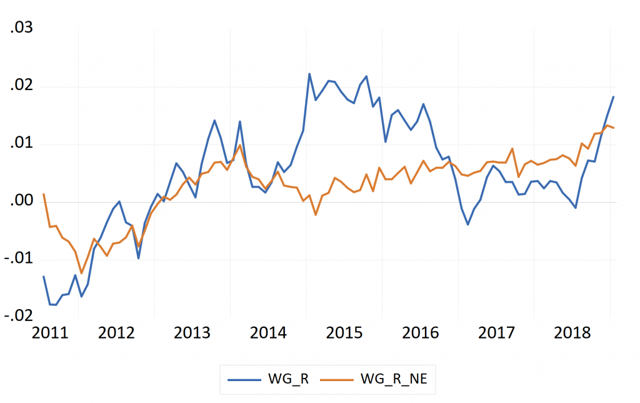
So average workers are finally making some real headway.
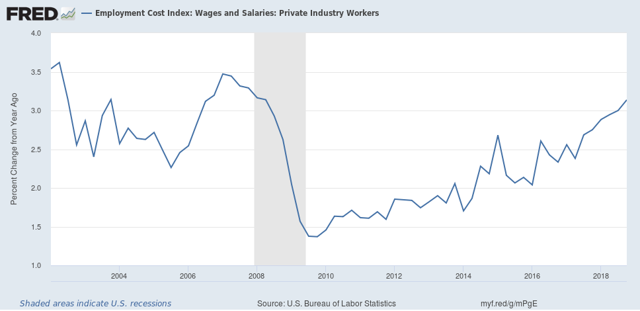
By the way, this also shows up in the Q4 2018 Employment Cost Index that was released three weeks ago:
By the way, this also shows up in the Q4 2018 Employment Cost Index that was released three weeks ago:
The ECI measures *median* wages, i.e., the 50th percentile level, and so does away with the “Bill Gates enters a bar” problem. At +3.1% YoY, this is the best showing since late 2006-early 2008.
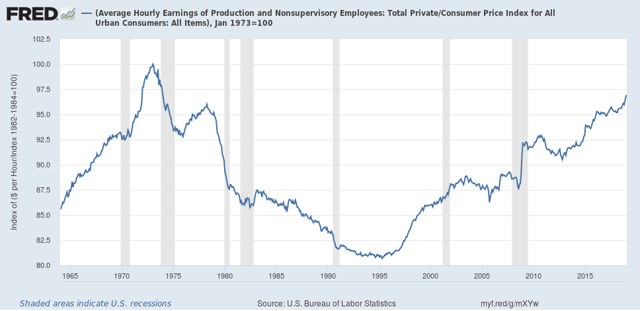
Returning to real inflation adjusted average wages, they improved again and are now only 3% below their 1973 peak:
Finally, total wage growth for non-managerial workers since the bottom in October 2009 is now up +28.5%:
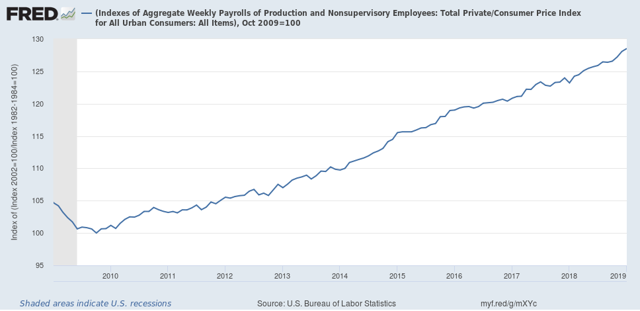 Total wage growth from this entire expansion has only been exceeded by the 1960s and 1990s expansion. The bad news, of course, is that it took 9 years to get here.
Returning to real inflation adjusted average wages, they improved again and are now only 3% below their 1973 peak:
Finally, total wage growth for non-managerial workers since the bottom in October 2009 is now up +28.5%:
Monday, February 18, 2019
It’s Presidents Day, and we’re still basically flying blind on the eoncomy
- by New Deal democrat
Not only are the markets closed today for President’s Day, but this entire week is about the emptiest I can ever recall for economic data. Literally the only data of note is going to be released on Thursday, and except for weekly jobless claims, even that is not what I would generally consider first-order metrics.
Even worse, we are still basically flying blind due to the government shutdown. The only data of note that had been on hiatus, and has been updated since it ended was last week’s retail sales for December. And that report was jarring enough to justify worrying that not only did the shutdown make us economically blind, but it itself may have further weakened an already weakening economy. So we may be in for some more jarring surprises when December housing starts and permits, December income and spending, and Q4 GDP finally get released next week.
There are a couple of series I’ve been meaning to update, so maybe I’ll get around to them. But, don’t be surprised if I don’t post any material for a day or two, or post a brief note on a political topic.
Saturday, February 16, 2019
Weekly Indicators for February 11 - 15 at Seeking Alpha
- by New Deal democrat
My Weekly Indicators post is up at Seeking Alpha.
There was some widespread deterioration among both the short leading and coincident weekly data, as well as the monthly data.
This is similar to what happened during the 2011 “debt ceiling debacle,” which makes me think that the government shutdown had a more pronounced (but hopefully transient) impact on the economy.
Friday, February 15, 2019
Industrial production face-plants, but hold the DOOOM for now
- by New Deal democrat
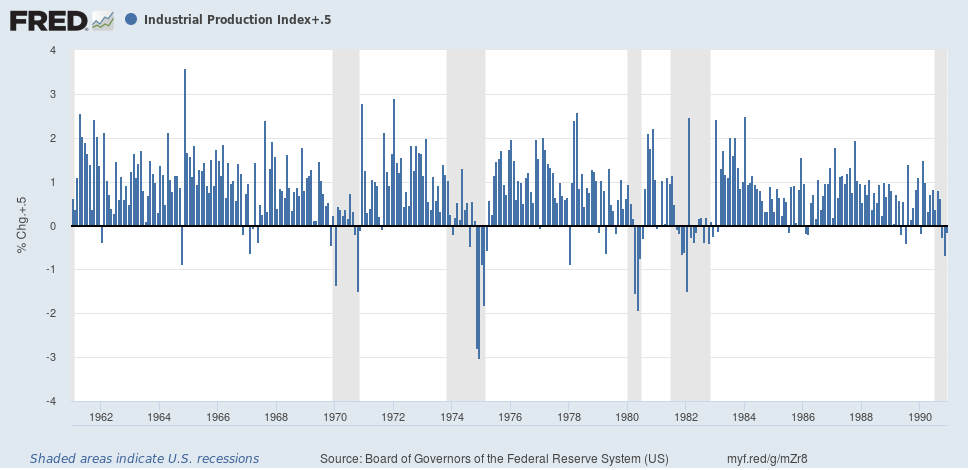
For the second day in a row, a major piece of economic data face-planted. Industrial production for the month of January declined -0.6%. Worse, almost all of the decline was in manufacturing.
This kind of decline is most consistent with the onset of a recession, or at very least a significant slowdown, as shown in these two long-term graphs covering the last 50+ years, which have been normed so that only a monthly decline in excess of -0.5% shows as negative:
1961-82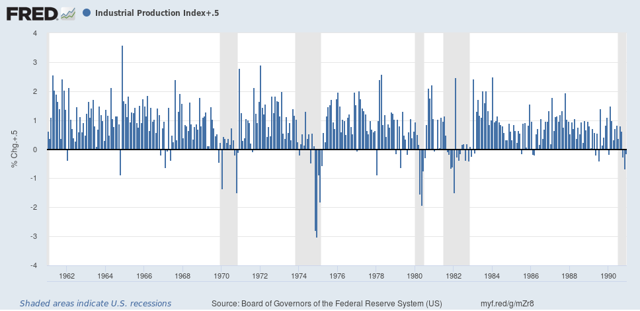
1982- present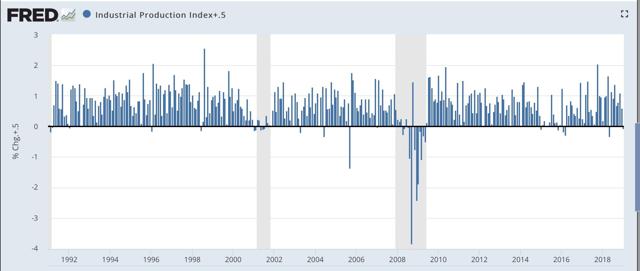
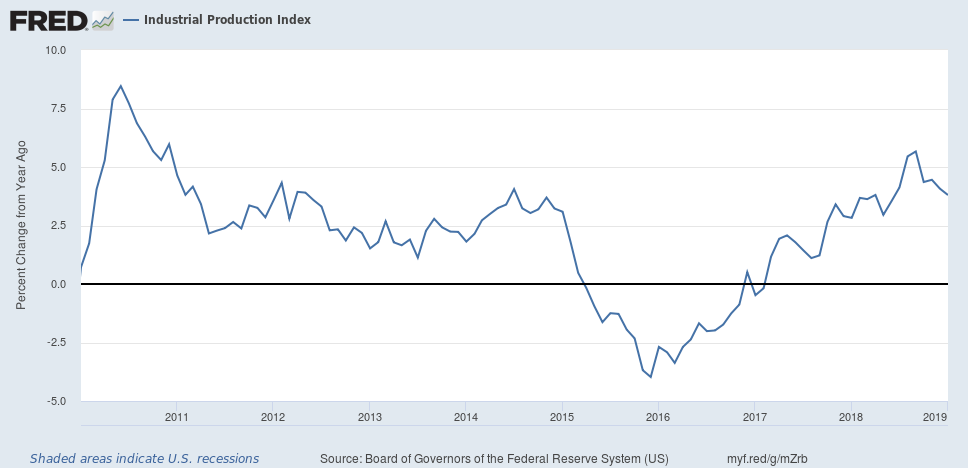
Zooming in on this expansion, the YoY% change in industrial production, at 3.8%, while certainly backing off from its “boom” readings of half a year ago, is still in the high range of average:
While the combination of yesterday’s retail sales number for December and today’s January industrial production number are pretty awful, I recommend treating each with caution, for two reasons.
First, the government shutdown - which started in late December - may have had a bigger effect on production and consumption than earlier believed. If so, I would expect the situation to reverse in the next month or two.
Second, at least in the case of January, the worst cold snap in the last 30 years hitting the industrial heartland almost certainly had some effect on production. The typical rejoinder to this is that winter comes every year. But winter weather is particularly variable from year to year, and waxes and wanes over its three month length at differing times from year to year as well.
So: definitely not good. Definitely consistent with a slowdown at least. But we need to see all of the data caught up through February before we can really judge if it is temporary or not.
Thursday, February 14, 2019
More signs of a slowdown: initial claims and real retail sales
- by New Deal democrat
This morning we got two negative data points. One is cause for concern; the other - not quite yet.
Let me start with the “not yet” first. Initial jobless claims rose 4,000 to 239,000. That means that the 4 week moving average rose to 231,750:
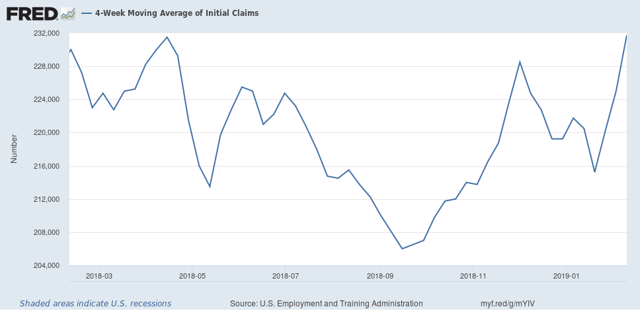
This means that the number is both higher YoY, and 12.5% above its 206,000 low in September.
Ordinarily that would be cause for concern. BUT, the biggest factor in the increase is the week of 253,000 claims two weeks ago, which was almost certainly due to the government shutdown. That week, in turn, was immediately preceded by the week of 200,000 claims, which was the lowest in nearly 50 years.
The bottom line is, although the trend is clearly higher since September, I would prefer to wait two more weeks for both of those outliers to pass out of the 4 week moving average before hoisting a yellow flag on jobless claims.
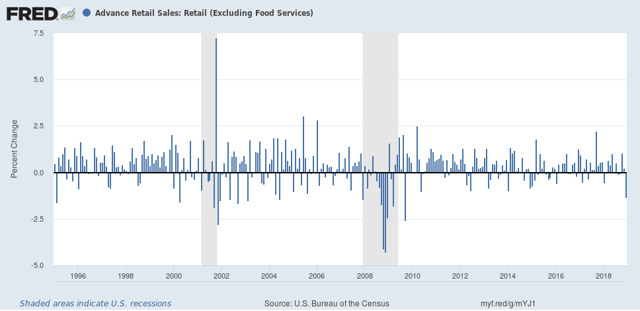
Now let me turn to the number that *is* a cause for concern now: real retail sales, which cratered by -1.2% in December. That is the worst monthly reading since just after the Great Recession, and consistent with readings in the year before both of the last two recessions, so unless this reading is revised away, it is a definite sign of a slowdown. On the other hand, in the longer view monthly readings of -1% or more aren’t that uncommon during expansions:
What this does do is bring YoY real retail sales down to a meager +0.1%(!), the second lowest of the entire expansion. Real retail sales per capita (red in the graph below) actually turned negative YoY:
Let me start with the “not yet” first. Initial jobless claims rose 4,000 to 239,000. That means that the 4 week moving average rose to 231,750:
This means that the number is both higher YoY, and 12.5% above its 206,000 low in September.
Ordinarily that would be cause for concern. BUT, the biggest factor in the increase is the week of 253,000 claims two weeks ago, which was almost certainly due to the government shutdown. That week, in turn, was immediately preceded by the week of 200,000 claims, which was the lowest in nearly 50 years.
The bottom line is, although the trend is clearly higher since September, I would prefer to wait two more weeks for both of those outliers to pass out of the 4 week moving average before hoisting a yellow flag on jobless claims.
Now let me turn to the number that *is* a cause for concern now: real retail sales, which cratered by -1.2% in December. That is the worst monthly reading since just after the Great Recession, and consistent with readings in the year before both of the last two recessions, so unless this reading is revised away, it is a definite sign of a slowdown. On the other hand, in the longer view monthly readings of -1% or more aren’t that uncommon during expansions:
What this does do is bring YoY real retail sales down to a meager +0.1%(!), the second lowest of the entire expansion. Real retail sales per capita (red in the graph below) actually turned negative YoY:
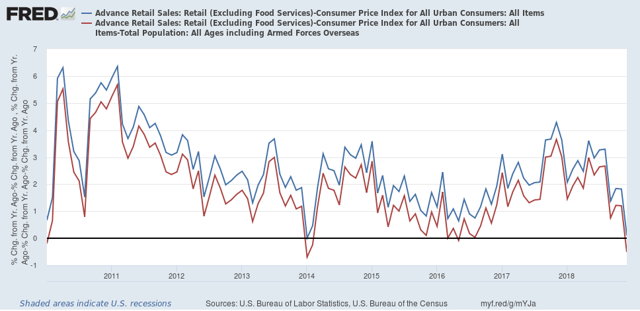
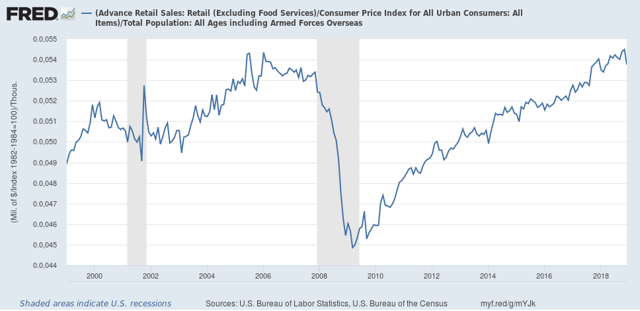
In absolute terms, real retail sales per capita still made an expansion high only one month ago, so I am not ready yet to move this signal from positive to neutral yet:
Finally, real retail sales are a good if noisy leading indicator for YoY employment, shown in red in the graph below (note: real retail sales averaged quarterly to cut down on noise):
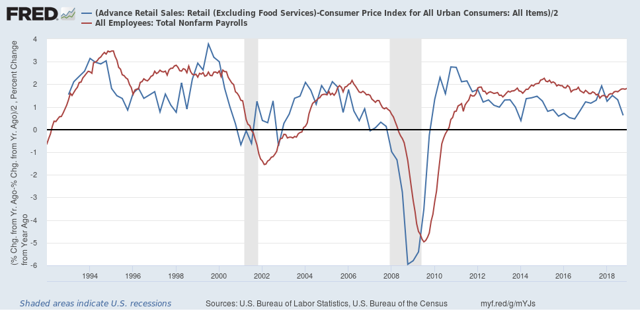
If the poor December number isn’t revised away, or reversed by a big gain in the next months’ report, this portends a significant deceleration in jobs growth in the monthly employment reports over about the next 6 months.
Wednesday, February 13, 2019
The 2017 GOP tax scam may hurt the economy this spring
- by New Deal democrat
It turns out that part of the GOP tax scam of 2017 might hurt the economy this year. That’s because the total decline in the amount of tax refunds going to tax filers this looks like it is going to be enough to affect consumer spending significantly this spring.
This post is up at Seeking Alpha.
Special bonus: a few RW commenters there really don’t seem to like it!
Tuesday, February 12, 2019
December JOLTS report: mixed but with strong positive revisions
- by New Deal democrat
The JOLTS report on labor is noteworthy and helpful because it breaks down the jobs market into a more granular look at hiring, firing, and voluntary quits. Its drawback is that the data only goes back less than 20 years, so from the point of view of looking at the economic cycle, it has to be taken with a large dose of salt.
With that disclaimer out of the way, Tuesday’s JOLTS report for December was mixed, and for the second month in a row was soft relative to the strength of the overall jobs gain for that month. With the exception of one new high, the other series are off their best levels, and two continued to decline, with the good news being that there were generally positive revisions in the previous month’s data:
- Quits declined for the 4th month in a row, and are about 5% off peak.
- Hires rose and are only 0.3% off their peak set two months ago.
- Total separations declined and are off 4% from August.
- Job openings made a new all time high.
- Layoffs and Discharges declined (a good thing), but remain up about 10% from their recent low last March.
Let's update where the report might tell us we are in the cycle.
First, below is a graph, averaged quarterly through the fourth quarter, of the *rates* of hiring, quits, layoffs, and openings as a percentage of the labor force since the inception of the series (layoffs and discharges are inverted at the 3% level, so that higher readings show fewer layoffs than normal, and lower readings show more):
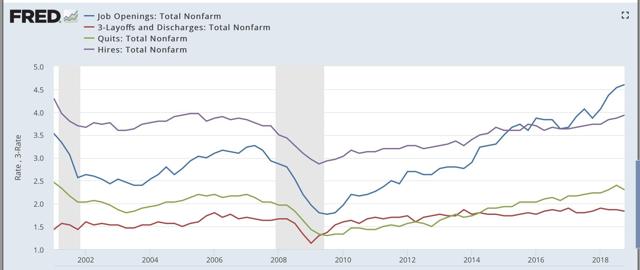
During the 2000s expansion:
- Hires peaked first, from December 2004 through September 2005
- Quits peaked next, in September 2005
- Layoffs and Discharges peaked next, from October 2005 through September 2006
- Openings peaked last, in Spril 2007
By contrast during and after the last recession:
- Layoffs and Discharges troughed first, from January through April 2009
- Hiring troughed next, in March and June 2009
- Openings troughed next, in August 2009
- Quits troughed last, in August 2009 and again in February 2010
Now here's what the four metrics look like on a monthly basis for the last five years:
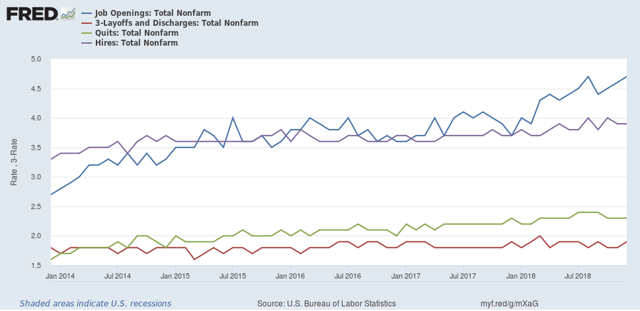
As indicated above, job openings, quits, and hires all surged higher through August of this year. While openings have continued to rise, hires have gone sideways, and quits have deteriorated.
.
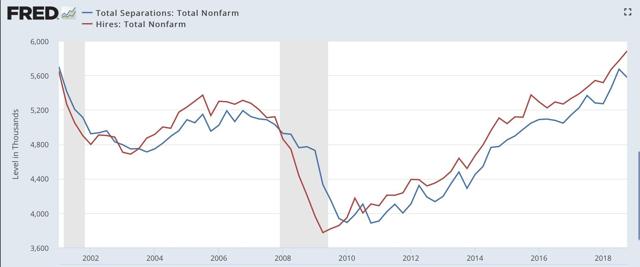
Next, here's an update to the simple metric of "hiring leads firing," (actually, "total separations"). Here's the long term relationship since 2000 through Q4 of 2018:
Here is the monthly update for the past fiv e years:
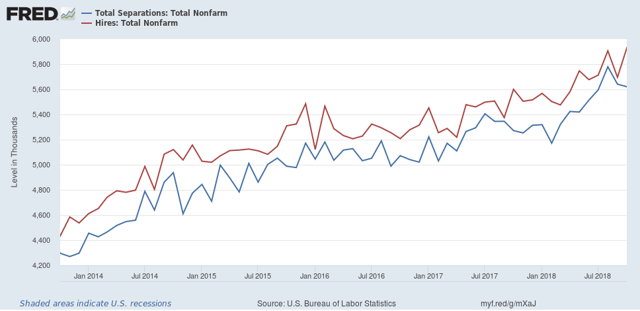
In the 2000s business cycle, hiring and then firing both turned down well in advance of the recession. With the positive revisions, there is no significant downturn shown here.
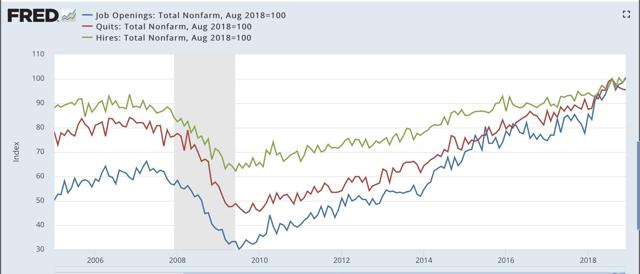
Finally, let's compare job openings with actual hires and quits. As you probably recall, I am not a fan of job openings as "hard data." They can reflect trolling for resumes, and presumably reflect a desire to hire at the wage the employer prefers. In the below graph, the *rate* of each activity is normed to 100 at its August 2018 value:
Now, here is a close-up of the last two years:
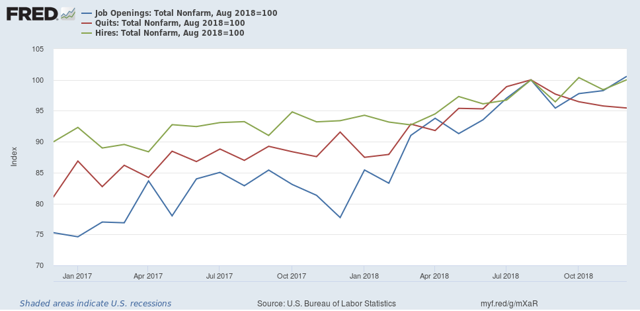
When I first presented this graph, I noted that while the rate of job openings was at an all time high, but the rate of actual hires has only just reached its normal rate during the several best years of the 2000s expansion, and was below its rate at the end of the 1990s expansion. With the positive revisions, that story has completely changed, as all three rates are better than their best rates in the 2000s expansion.
In 2018, both hires and quits accelerated, with hiring decisively above its level from the last expansion. My take has been that employees have reacted to the employer taboo against raising wages by quitting at high rates to seek better jobs elsewhere. Last month I wrote, “If the dam is finally breaking, we should see the hiring rate increase, and quit rate level off.” Although similar, instead hires have leveled off, while quits have declined.
In summary, the December JOLTS report was generally strong. As I expected it to be given the headline jobs number, but had soft spots. My expectation remains that this will start to cool down during the first six months of this year as a slowdown begins to take hold. but this won’t happen as long as the headline numbers remain so strong, as they were agiain in January.
Monday, February 11, 2019
A decelerating Staffing Index suggests that weakening temporary jobs in the monthly employment report is not just noise
- by New Deal democrat
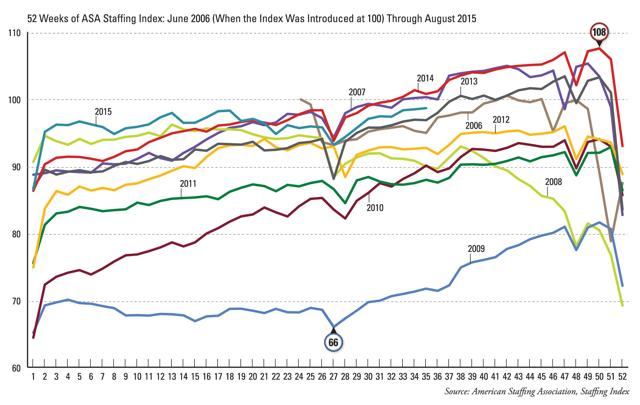
Every week I report the YoY 4 week rolling average of American Staffing Association’s Index. It’s been decelerating recently, and last week was up only +0.5% YoY. On a single week basis, though, it went negative.
Because I have written several posts in the last couple of months emphasizing the leading aspect of temporary jobs in the monthly employment report, I thought I would compare the Staffing Index against it.
Here’s what I found: since the Staffing Index isn’t seasonally adjusted, you really have to compare each on a YoY basis. And while the two don’t turn positive or negative at the same time or for the same duration, they do correlate well on YoY direction; i.e., acceleration or deceleration in the YoY comparison.
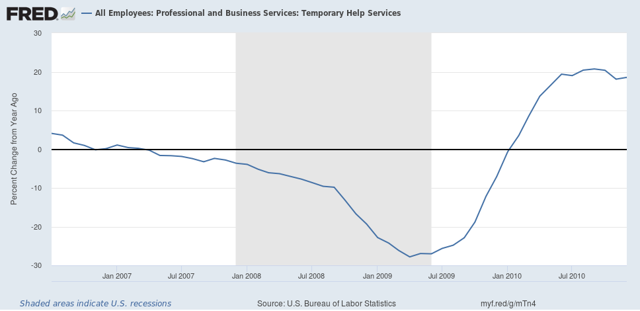
The Staffing Index only began to be published in 2004. Since then, there have only been two periods when staffing turned negative YoY: the Great Recession and the 2015-16 energy patch downturn.
As the first two graphs below show, at the time of the Staffing Index lagged the monthly jobs report by half a year in 2007, and led it by one month at the end of 2009:
Because I have written several posts in the last couple of months emphasizing the leading aspect of temporary jobs in the monthly employment report, I thought I would compare the Staffing Index against it.
Here’s what I found: since the Staffing Index isn’t seasonally adjusted, you really have to compare each on a YoY basis. And while the two don’t turn positive or negative at the same time or for the same duration, they do correlate well on YoY direction; i.e., acceleration or deceleration in the YoY comparison.
The Staffing Index only began to be published in 2004. Since then, there have only been two periods when staffing turned negative YoY: the Great Recession and the 2015-16 energy patch downturn.
As the first two graphs below show, at the time of the Staffing Index lagged the monthly jobs report by half a year in 2007, and led it by one month at the end of 2009:
At the time of the energy patch downturn, the Index turned negative YoY in May 2015:
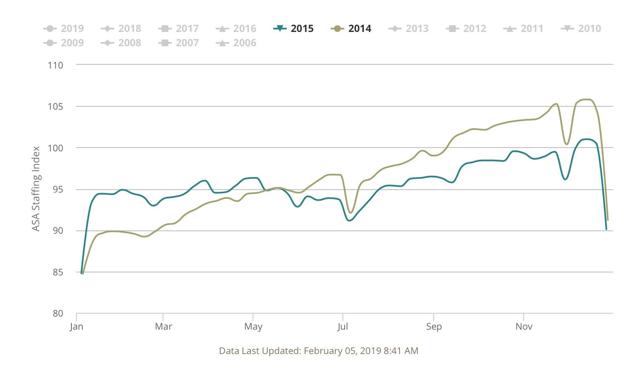
And continued negative until June 2017:
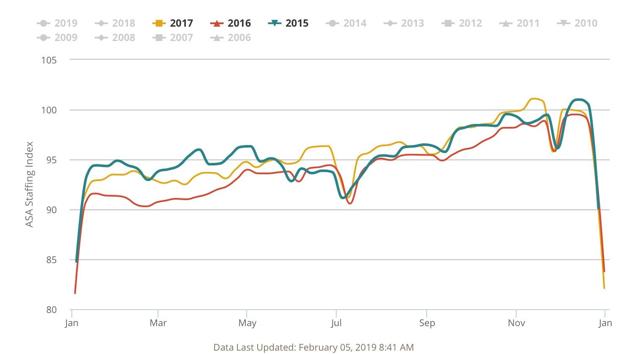
Meanwhile,monthly temp jobs number did not turn negative except most of the last 9 months of 2016 — although it started its rapid deceleration almost exactly when the Index went negative:
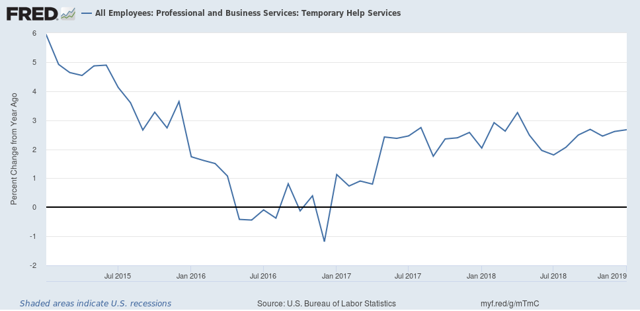
Note that decelation in the YoY number corresponded with the Staffing Index’s turning negative in 2015, and continued to improve until mid-2017.
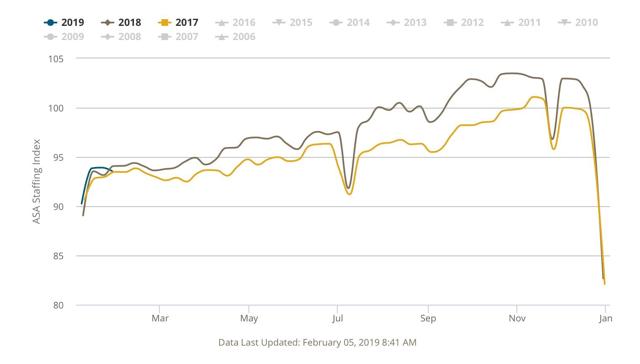
Most recently, the YoY comparisons started to deteriorate in the Staffing Index in November, and have been barely positive so far this year.
All of which makes me think that the deceleration of temp jobs in the monthly report for the last three months, as shown in the final graph below:
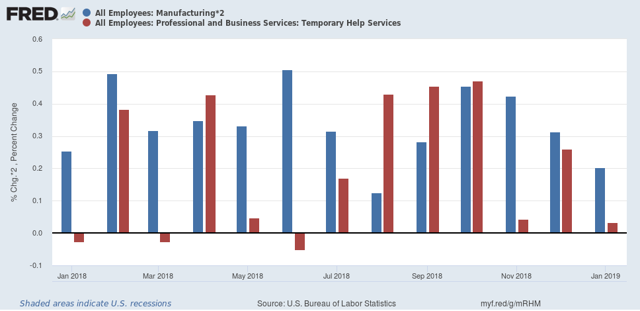
hasn’t just been noise, but - while still positive - is demonstrative of real weakness.
Saturday, February 9, 2019
Weekly Indicators for February 4 - 8 at Seeking Alpha
- by New Deal democrat
My Weekly Indicators post is up at Seeking Alpha.
The weekly model is at (slight) variance with the model under which I have gone on “recession watch.” Inevitably we trade noisiness and less completeleness for timeliness.
Friday, February 8, 2019
What does a “Recession Watch” mean?
-by New Deal democrat
On Wednesday I went on “Recession Watch” beginning Q4 of this year.
Yesterday I explained what that means in detail over at Seeking Alpha.
So, what happens after this?
- If the weakness persists and spreads to the short leading indicators, the “watch” turns into a.warning.
- If the weakness abates without spreading into the short leading indicators, the “watch” is lifted.
As always, I will be relentlessly data-driven.
Thursday, February 7, 2019
Recession Watch beginning Q4 2019
- by New Deal democrat
It had to happen someday.
My comprehensive update of the long leading indicators is up at Seeking Alpha.
After almost 10 years of being relentlessly positive, enough of the long leading indicators have turned negative to warrant a “Recession Watch” beginning in the 4th quarter of this year. (And only one day after Bill McBride a/k/a Calculated Risk Pooh-poohed such things, too! But I go where the data takes me.)
A word of caution: this doesn’t mean that a near-term recession is certain, and it doesn’t mean that it is certain to begin in Q4. But it is very much in play.
Wednesday, February 6, 2019
February short leading data starts out decent
- by New Deal democrat
We’ve had two pieces of forward looking data in the last week (in addition to the leading bits in the employment report).
The first was the ISM manufacturing index:
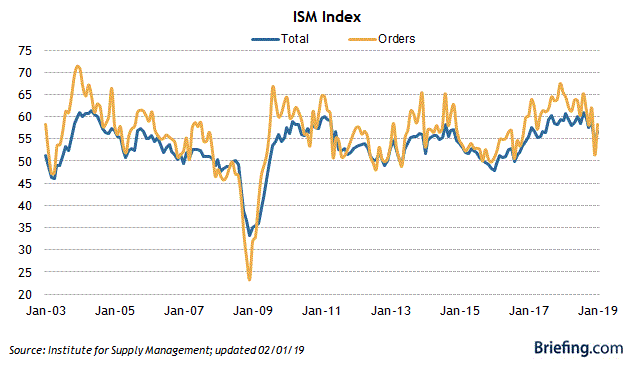
Contrary to my expectations, the most leading new orders component rebounded sharply, up to 58.2. This is closer to its “hot” readings of mid-2018 than to its tepid 51.3 in December.
The second was motor vehicle sales. After housing, this is usually the second aspect of consumer spending to turn. While not great, it was OK:
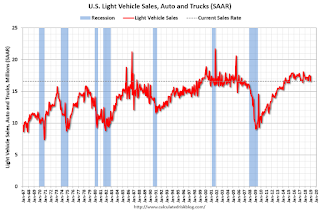
(H/t Calculated Risk).
Motor vehicle sales tend to have long plateaus during expansions, before turning down in the 6 to 12 months before a recession. For me to think such a deterioration has started, I would need to see more than one month of less than 16.5 units sold. In January, 16.6 units were sold on an annualized basis.
No signs of any imminent downturn in this data, even though both have backed off from their best readings.
Tuesday, February 5, 2019
Q4 Senior Loan Officer Survey says ...
- by New Deal democrat
The Senior Loan Officer Survey is one of my list of long leading indicators. The Q4 report came out yesterday.
The news wasn’t good. This post is up at Seeking Alpha.
Meanwhile, since the dates for publication of neither housing permits nor Q4 GDP were announced last week, I am going to go ahead and put up a preliminary forecast for the second half of this year sometime this week.
Monday, February 4, 2019
Leading scenes from the employment report not so positive
- by New Deal democrat
I seem to have been the only person to pick up on the weakness in the underlying leading aspects of last Friday’s jobs report.
While the number of job gains was great, and that average wages for non-managerial workers had their second best showing, at 3.4%, of the entire expansion, just behind last month’s 3.5%, the leading aspects of the report, with one exception, were not so positive.
Let’s start with temporary and manufacturing jobs. Here are two graphs showing their month over month percentage gains over the last 20 years (manufacturing is multiplied *2 for scale purposes):
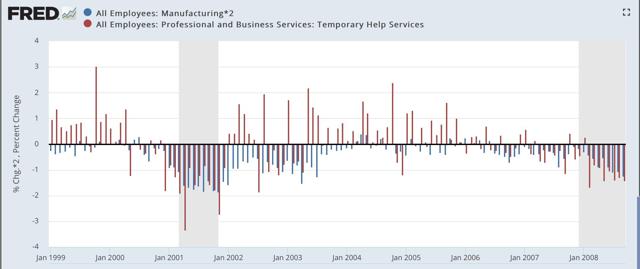
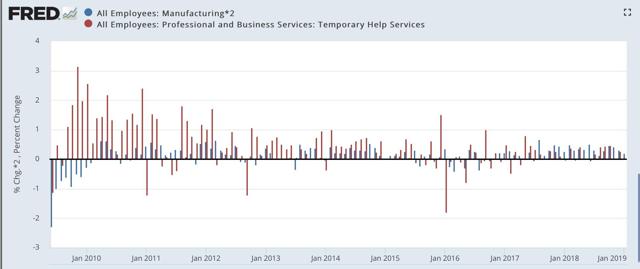
Both of these advance less than 0.2% m/m and ultimately decline m/m before a recession begins.
Now here is a close-up on the last year:
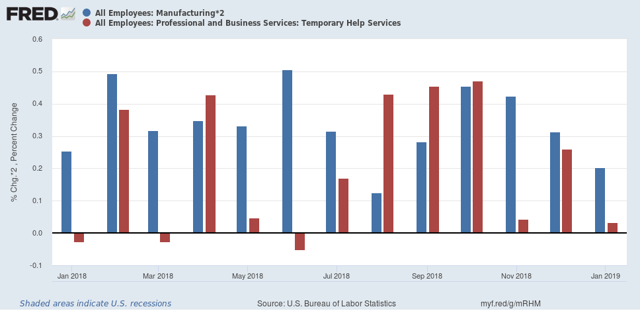
Manufacturing jobs increased just shy of +0.2% as scaled, and temporary jobs less than +0.1% for the second time in three months. Even the three month average for temporary jobs is only +0.1%.
Next, let’s look at the manufacturing work week. This is one of the 10 components of the Index of Leading Indicators, and generally turns before manufacturing jobs do. At 42.0 hours in January, they are 0.4 hours below their recent peak:
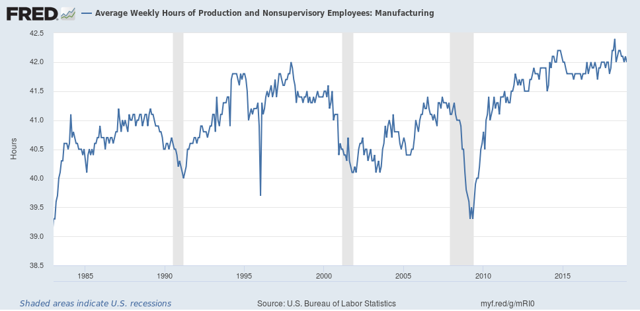
While a turndown of at least -0.5 hours has generally been necessary prior to a recession, the recent decline isn’t just noise and in the last 20 years has usually coincided with a slowdown, such as in 1984, 1994, and 2002.
Next, here is short time unemployment (less than 5 weeks). This is one of the short leading indicators identified by Prof. Geoffrey Moore, and while they are obviously noisy, his research indicated they usually made a bottom before initial jobless claims:
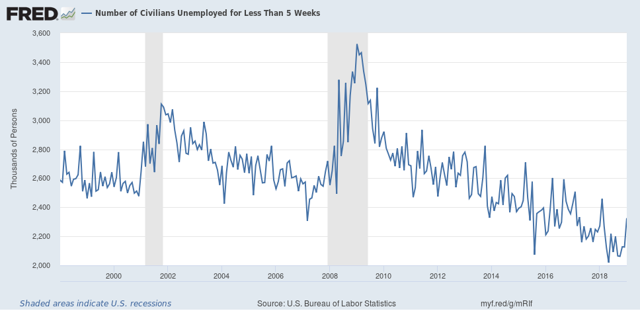
These are clearly within the range of noise, but they have not made a new low for close to a year.
Finally, here are construction jobs for the duration of this expansion. These had one of the 10 best months of the entire 10 year expansion in January:
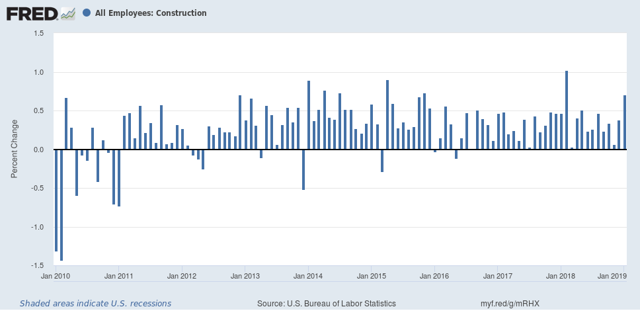
In fact, they stand out in sharp contrast to the weakness in the housing market, so much so that I suspect there will be a substantial downward revision in a month’s time.
In summary, of the five leading indicators in the jobs report, only one — construction jobs — was clearly positive. Two — temporary jobs and manufacturing jobs — while positive, have decelerated significantly and are consistent with a slowdown in the near future. Two — the manufacturing work week and short term unemployment — outright declined. The latter is within the range of noise, but the former is also consistent with a slowdown.
Sunday, February 3, 2019
Reduction in Representation as the remedy for voter suppression
- by New Deal democrat
This is the second take prompted by my reading of David W. Blight‘s biography of Frederick Douglass.
In the “nothing is every really new” department, voter suppression was very much on the mind of Douglass and other radical Republicans during the Civil War and its immediate aftermath. Douglass was fond of saying that blacks would only gain equality once they exercised power through three “boxes: the cartridge box, the jury box, and the ballot box.” In other words, first equality would have to be fought for in the war. Then there would need to be legal equality. And finally, the only way to protect that legal equality would be via the right to vote.
Douglass and others were very clear-minded that the “copperhead” Democrats would continue to suppress freed blacks by denying them access to voting rights, all the while continuing to gain power via counting freed blacks towards representation in the Congress. Sound familiar at all?
While the ultimate step was the passage of the Fifteenth Amendment in 1969-70, the second Section of the Fourteenth Amendment addresses voter suppression directly, and mandates a specific remedy that is well worth renewed consideration today.
Here are the relevant texts of the first and second Sections of the Fourteenth Amendment.
Section One of the Amendment mandates that
“All persons born or naturalized in the United States, and subject to the jurisdiction thereof, are citizens of the United States and of the State wherein they reside.”
Section Two states:
“Representatives shall be apportioned among the several States according to their respective numbers, counting the whole number of persons in each State, excluding Indians not taxed. But when the right to vote at any election ... is denied to any ... citizens of the United States, or in any way abridged, except for participation in rebellion, or other crime, the basis of representation therein shall be reduced in the proportion which the number of such male citizens shall bear to the whole number of male citizens twenty-one years of age in such State.”Further, that Section does not just apply to Federal elections, but also applies to
“the Executive and Judicial officers of a State, or the members of the Legislature thereof.”
And the “any [ ] citizens” to whom Section Two above applied were limited to
“the male inhabitants of such State, being twenty-one years of age.“Of course, since passage of the Fourteenth Amendment, suffrage has also been extended to woman (the Nineteenth Amendment) and to 18 year olds (the Twenty- Amendment). Both of those amendments repeat the “denied or abridged” language of the 14th Amendment above, but without its specific remedial language, instead repeating the general language that Congress could pass legislation to enforce the Amendment.
Thus, in view of the subsequent two Amendments, I see no reason why the specific remedial language of the Fourteenth Amendment should be limited to males age 21 or older. Further, note that nowhere in Section Two of the Fourteenth Amendment does it limit its application to race. Rather, it specifically applies to any “denial or abridgment” to “any citizen” otherwise eligible to vote.
The “abridgment” language is important, because it is broader than a “denial.” It means that the remedy can be invoked even though the right to vote is *not* denied. If voter suppression is a form of “abridgment” of the right to vote — and I certainly believe that it is — then the Section Two remedy is specifically available.
And the remedy is draconian: a reduction in representation for the offending State, in proportion to the “denial or abridgment.”
To take an extreme example of how that might apply, if the partisan gerrymanders of such a state as North Carolina were deemed an “abridgment” of Democrats’ right to vote, then a Court could determine that, since slightly over 50% of North Carolinians cast ballots for Democratic members of Congress, but Democrats were only elected 3 of the state’s 13 Congressional Districts, the GOP representation of North Carolina in Congress must be cut from 10 districts to 3.
Draconian? Absolutely! But that draconian remedy is exactly what is prescribed by both the text and the intent of Section Two of the Fourteenth Amendment.
And unlike the useless flailing that has been the hallmark of litigation since 2010, in which gerrymandered districts have been allowed to continue throughout the entire decade, the mind-concentrating Fourteenth Amendment remedy would be likely to produce immediate results.
To return to the example of North Carolina, it does not take a genius to figure out that, in response to a binding, final order reducing GOP representation in the House from 10 to 3 seats, the legislature would move with lightning-like alacrity to undo the abridgment and arrange new elections.
In fact, so draconian and swift is the Fourteenth Amendment remedy that I doubt it would have to be applied more than once. In short order all states would suddenly scrupulously be in favor of enabling voting by all eligible citizens.
But in closing, to reiterate, this remedy isn’t “pie in the sky.” It isn’t new or novel. It was a remedy thought about and *specifically enacted”in response to the very type of problem that has become endemic in the last decade, and supported by the specific text of the Fourteenth Amendment to the Constitution. Even if the five movement conservatives who form a majority on today’s Supreme Court are unlikely to enforce it, the argument ought to be put into the public discourse now to enable its ultimate adoption.
Frederick Douglass, Andrew Johnson, and the Copperhead GOP
- by New Deal democrat
I am currently reading David W. Blight’s biography of Frederick Douglass, the 19th century orator and champion of black equality. Today I wanted to briefly write on several timely topics inspired by that tome.
Douglass was biracial, or in the parlance of the day, a mulatto. His mother was a young slave named Harriet Bailey. His father was probably Aaron Anthony, the “overseer of overseers” of slaves at the nearby Wye Plantation on the eastern shore of Maryland. He was probably conceived in rape.
His earliest memories included Anthony giving his mother’s sister a vicious whipping for the crime of having a romantic relationship with a young male slave; and Anthony also gently leading him by the hand, patting him on the head, tousling his hair, and calling him “my little Indian boy.”
At about age 12, he was given to the Auld family in Baltimore as a house slave and companion for several of their children. In the first of several portentous mere chances, the wife, Sophia Auld, who had never owned a slave before, included him in her own children’s education, and taught him how to read. Soon he was reading the Bible, and sermonizing at church services among slaves on Sundays.
He escaped to freedom when he was 18, and in another serendipitous episode, was asked to lecture about his experiences at a local abolitionist meeting attended by William Lloyd Garrison. A oratorical star was born.
He was already famous in the 1840s . By the middle of the Civil War he was meeting with Lincoln at the White House, pressing the issues of the abolition of slavery, the enlistment of black soldiers, and the right to vote.
After Lincoln’s assassination, Douglass pressed for activist, interventionist Federal power to protect the rights of freedmen in the South as part of the establishment of a new order.
There he ran into the brick wall of President Andrew Johnson. Johnson was the only Senator from a seceded state (Tennessee) who did not resign, and was a powerful symbol as Lincoln’s 1864 running mate.
The problem was that, aside from opposing secession, and recognizing that the Thirteenth Amendment was fait accompli, Johnson was in favor of “Confederate Reconstruction,” determined to restore the status quo ante, including state’s rights, restoration of land to slaveowners, pardoning of prominent Confederates, providing no help nor rights whatsoever to the freed slaves, and accepting the passage of “black codes” in the South that de facto returned former slaves to servility.
Against this, Douglass led a delegation of 13 men who went to the White House and insisted on a meeting with Johnson that proved deeply contentious.
At the meeting, Johnson claimed that slavery was a de facto conspiracy by masters and slaves against poor whites, and that the abolition of slavery was nothing more than an expedient to suppress the rebellious South. He insisted that states’ rights was a fundamental tenet of the nation, and meant that nothing should be forced on the white majority against their consent. He disdained what he called “abstract ideas of liberty” for blacks that he claimed would result in race war. Johnson subsequently reiterated those views in his strident veto of the 1866 Civil Rights Act, inveighing against the “centralization” of power in the Federal government, and claiming that the extension of civil rights protections for blacks were “fraught with evil” and “made to operate in favor of the colored and against the white race.” Congress overrode that veto.
The contemporaneous term for those who held views like Johnson was “copperheads.” Just last week the almost identical assertions were made on the Senate Floor by Mitch McConnell. His party equally deserves the epithet of the Copperhead GOP.
Subscribe to:
Posts (Atom)