- by New Deal democrat
This morning we got two negative data points. One is cause for concern; the other - not quite yet.
Let me start with the “not yet” first. Initial jobless claims rose 4,000 to 239,000. That means that the 4 week moving average rose to 231,750:
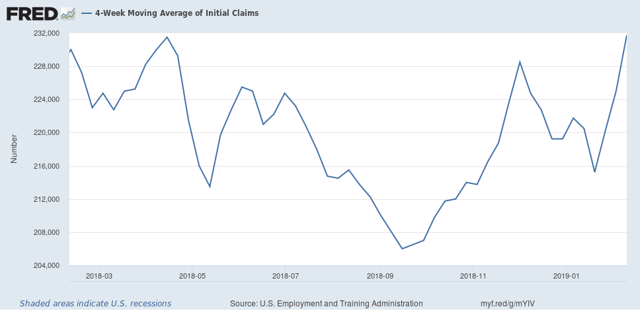
This means that the number is both higher YoY, and 12.5% above its 206,000 low in September.
Ordinarily that would be cause for concern. BUT, the biggest factor in the increase is the week of 253,000 claims two weeks ago, which was almost certainly due to the government shutdown. That week, in turn, was immediately preceded by the week of 200,000 claims, which was the lowest in nearly 50 years.
The bottom line is, although the trend is clearly higher since September, I would prefer to wait two more weeks for both of those outliers to pass out of the 4 week moving average before hoisting a yellow flag on jobless claims.
Now let me turn to the number that *is* a cause for concern now: real retail sales, which cratered by -1.2% in December. That is the worst monthly reading since just after the Great Recession, and consistent with readings in the year before both of the last two recessions, so unless this reading is revised away, it is a definite sign of a slowdown. On the other hand, in the longer view monthly readings of -1% or more aren’t that uncommon during expansions:
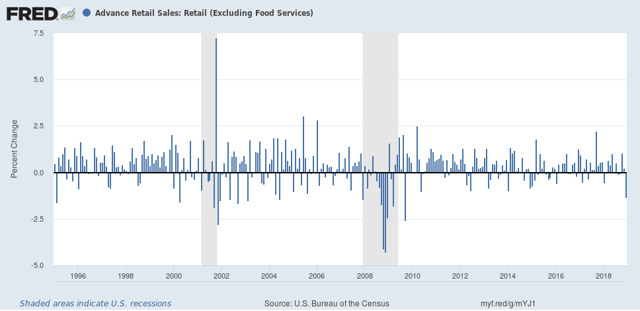
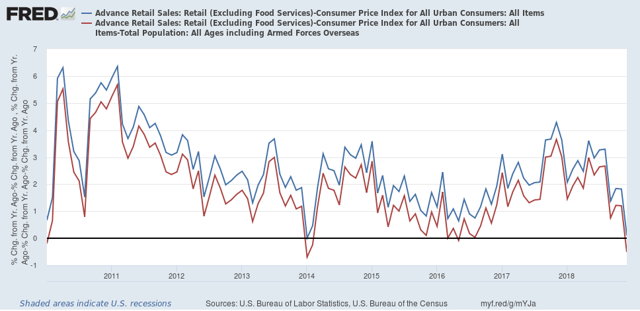
What this does do is bring YoY real retail sales down to a meager +0.1%(!), the second lowest of the entire expansion. Real retail sales per capita (red in the graph below) actually turned negative YoY:
Let me start with the “not yet” first. Initial jobless claims rose 4,000 to 239,000. That means that the 4 week moving average rose to 231,750:

This means that the number is both higher YoY, and 12.5% above its 206,000 low in September.
Ordinarily that would be cause for concern. BUT, the biggest factor in the increase is the week of 253,000 claims two weeks ago, which was almost certainly due to the government shutdown. That week, in turn, was immediately preceded by the week of 200,000 claims, which was the lowest in nearly 50 years.
The bottom line is, although the trend is clearly higher since September, I would prefer to wait two more weeks for both of those outliers to pass out of the 4 week moving average before hoisting a yellow flag on jobless claims.
Now let me turn to the number that *is* a cause for concern now: real retail sales, which cratered by -1.2% in December. That is the worst monthly reading since just after the Great Recession, and consistent with readings in the year before both of the last two recessions, so unless this reading is revised away, it is a definite sign of a slowdown. On the other hand, in the longer view monthly readings of -1% or more aren’t that uncommon during expansions:

What this does do is bring YoY real retail sales down to a meager +0.1%(!), the second lowest of the entire expansion. Real retail sales per capita (red in the graph below) actually turned negative YoY:
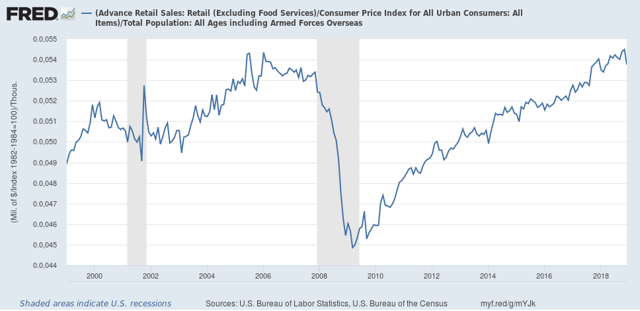
In absolute terms, real retail sales per capita still made an expansion high only one month ago, so I am not ready yet to move this signal from positive to neutral yet:
Finally, real retail sales are a good if noisy leading indicator for YoY employment, shown in red in the graph below (note: real retail sales averaged quarterly to cut down on noise):
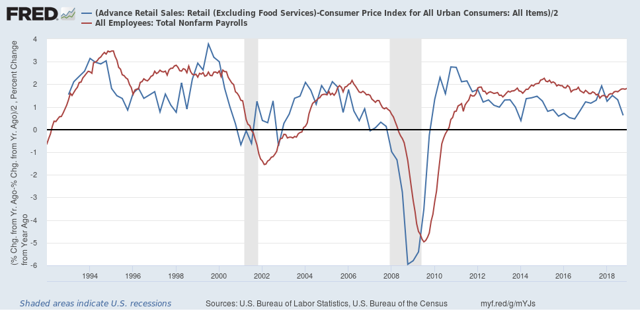
If the poor December number isn’t revised away, or reversed by a big gain in the next months’ report, this portends a significant deceleration in jobs growth in the monthly employment reports over about the next 6 months.