Monday, July 20, 2009
Editorial Note From Bonddad


Market Mondays
1.) They all demonstrate a bull market upward move followed by a bull market flag/pennant pattern over the last few months.
2.) All have a buy signal from the MACD
3.) But all are also experiencing a very tight SMA patter -- that is, the 10, 20 and 50 day SMAs are all in a very tight configuration indicating a lack of firm direction. This pattern shouldn't be surprising considering prices are just coming off a period of downward consolidation.
What happened last week was very interesting because it illustrates why it's important to know the technical and fundamental picture. On Monday everybody (including me) we expecting the market to drop because of the head and shoulders formation on the SPYs. However, the fundamental situation changed when Goldman and Intel reported better than expected earnings. This got the market very excited about the possibility of a better than expected earnings season and it lead to a rally. Because everyone was short everyone started to cover their shorts adding upward pressure to the rally.
Click on all images for a larger image


Friday, July 17, 2009
Weekend Beagle and Weimar
To that end here are some pictures of our children.
See you on Monday


From Invictus: Odds and Ends
Saw this cross the tape today (via Briefing.com):
“DJ reports FDIC Chairman Sheila Bair believes up to 500 more banks could fail, a U.S. senator said Bair told him in a recent meeting. "She told us that unless something dramatic happens, we could lose up to 500 more banks," Sen. Jim Bunning, R-Ky., said Thursday at a hearing of the Senate Banking Committee on the foreclosure crisis. Bunning said Bair made the remarks in a recent meeting. "That means that people who make mortgages in local places .... people that
could really help in a foreclosure will not be there," Bunning said.”
Not good.
To my eye, the FOMC minutes were noteworthy for the number of qualifiers – but, albeit, though, however – that were interspersed throughout to send the message that things are crappy, BUT not as crappy as before.
Some examples:
“The information reviewed at the June 23-24 meeting suggested that the economy remained very weak, though declines in activity seemed to be lessening.
“But the reductions in employment and industrial production had slowed somewhat…
“Nonfarm payrolls continued to shrink, but the decline was the smallest since September.
“Industrial production decreased in April and May but at a slower pace than in the first quarter.
“In the high-tech sector, computer output fell at a pace similar to that in the first quarter, but near-term indicators of production turned somewhat less negative and global semiconductor sales climbed in April for the second consecutive month.
“Outside the transportation and high-tech sectors, most industries continued to cut production in both April and May, though at a slower pace than over the preceding five months.
“Real investment in equipment and software (E&S) continued to contract; however, the decline in the second quarter appeared likely to be smaller than in either of the two preceding quarters.”
It took me about 30 seconds to find those examples, and there are many more where those came from. I’m not encouraged that the Fed has adopted the “less bad” mantra.
I did some research into the Exhaustion Rate of Unemployment Insurance Claims, and finally found the data I was seeking at the DOL website (this page is just buried there and very hard to find: http://www.doleta.gov/unemploy/chartbook/chartrpt.cfm). Here’s their definition of the Exhaustion Rate and a chart of what it currently looks like:
“The exhaustion rate represents the proportion of claimants who collect all of their unemployment insurance entitlement. In this case, the entitlement is for the regular state program. The rate is computed by dividing all exhaustions from the regular state program over a 12 month period by the number of claimants who actually received at least one unemployment insurance payment over a 12 month period which lags by 6 months the period over which exhaustions are counted. The 6-month lag is used because claimants are entitled to up to 26 weeks of benefits. Using 12-month periods eliminates the influence of seasonal factors. The relationship of the exhaustion rate to the labor market's health is similar that of average duration.”

Continuing Claims took a record drop yesterday, some 640,000 down. Not exactly sure what factors may have been at play here, but it is certainly a step in the right direction if it holds up to revisions.
Lastly for now, blog proprietor Bonddad recently asked if trade could lead us out of recession. That question was, in part, answered by the FOMC in their minutes: “Economic activity in foreign economies was unlikely to be sufficiently strong to provide a substantial boost to U.S. exports.”
Housing during the Roaring Twenties and Great Depression
I wanted to memorialize some information I came across as a result of correspondence with Calculated Risk pursuant to his post the other day entitled Show Me the Engines of Growth, in which he said, "Housing usually leads the economy both into and out of recessions (this was true for the Great Depression too)."
Both CR and I have relied significantly on a presentation Prof. David Leamer made at the Jackson Hole conference a couple of years ago, in which he discussed the importance of housing to the business cycle (but unbelievably failed to see just how crucial a role housing was going to play in this downturn!). Prof. Leamer showed convincingly that post-WW2 recessions all were led by significant housing downturns, and that housing, relatively speaking, was the first industry to turn up, presaging the end of those recessions.
Prof. Leamer, intriguingly, made an aside about housing during the Roaring Twenties and Great Depression, showing a graph from a 1954 text which appeared to show that the busting of a housing bubble also previewed the Great Depression. Here's the graph:

Up until the other day, I had been unable to verify the information in that graph, or the source of the information, but in the course of my exchange with CR, I found this source which did indeed come from the Department of Labor, and gave exact annual data for "non farm housing starts". Using that data, I have been able to generate this chart, which also in the last column converts the equivalent housing starts to our time, by multiplying the data proportionate to the population for each year compared with our modern population of 300 million. All data is in 1000's:
| Year | Nonfarm housing starts | 2009 equivalent |
|---|---|---|
| 1920 | 247 | 699 |
| 1921 | 449 | 1236 |
| 1922 | 716 | 1953 |
| 1923 | 371 | 994 |
| 1924 | 893 | 2350 |
| 1925 | 937 | 2423 |
| 1926 | 849 | 2177 |
| 1927 | 810 | 2042 |
| 1928 | 753 | 1867 |
| 1929 | 509 | 1252 |
| 1930 | 330 | 805 |
| 1931 | 254 | 615 |
| 1932 | 134 | 322 |
| 1933 | 93 | 221 |
| 1934 | 126 | 300 |
| 1935 | 221 | 522 |
| 1936 | 319 | 748 |
| 1937 | 336 | 781 |
| 1938 | 406 | 937 |
| 1939 | 515 | 1179 |
| 1940 | 602 | 1368 |
Bear in mind the following two facts:
1. the peak housing starts during the recent bubble were 2273 in the month of January. 2006, and have since fallen to ~500.
2. The above figures are for nonfarm housing starts only. In 1930, 25% of the US population lived on farms, compared with only 2% today.
So if anything, the 1920s boom was much more of a bubble than the recent one, and perhaps the ensuing decline, while much more drastic over the 3 1/2 years since than the eight year decline from 1925-1933, will not sink so low before bottoming.
CR's conclusion was that it looked like housing led the way out of the Great Depression. That seems a little too strong for me. Certainly it does not appear that any month in 1932 would have been a candidate for the housing bottom. The contraction phase of the Great Depression ended in April 1933, so at best housing may have led by a couple of months. More likely, one suspects, is that once FDR and the Emergency Banking Acts of April 1033 restored confidence to the banking system, mortgages became more available, and so housing bottomed in the spring or early summer of 1933, improving slowly thereafter, generally coincident with the recovery phase from the Great Depression.
Housing starts in recent months have seemed generally to move sideways, but they did the same thing last year, before collapsing again in the last 6 months of 2008. If housing does "lead the way" out of this Recession, it is likely to be a very subdued advance.
Empire State and Philly Fed
The Empire State Manufacturing Survey indicates that conditions for New York manufacturers were flat in July. The general business conditions index increased to a level close to zero, rising 9 points, to -0.6. The new orders index rose above zero for the first time in several months, and the shipments index also climbed into positive territory. The inventories index slipped to a record-low -36.5. The prices paid index rose above zero for the first time since November, while the prices received index held below zero. Employment indexes remained well below zero. Future indexes continued to be relatively optimistic about the six-month outlook, but were somewhat less buoyant than in June. The capital spending index fell several points, but remained above zero.
Short version -- things again moved in a positive direction.
And then there is this from the Philly Fed:

The index dropped just a bit:

Bottom line -- we're almost at positive growth in both surveys.
Forex Friday

On the weekly chart we have a declining MACD and RSI along with a downward break from prices. In addition, prices are below all the EMAs, the 10 day EMA has moved through the 50 day EMA and the 20 day EMA is about to follow suit.

The daily chart is showing a lower move as well. Prices have moved through the lower level of support of the triangle consolidation pattern. In addition prices are below all the EMAs and the MACD is currently giving a sell signal.
Thursday, July 16, 2009


The Black Swan Myth
First, a bit of history. One of the primary causes of the great depression was a series of bank failures from the years 1929-1933. In effect, there were three waves that greatly contracted credit and the money supply. As a result, the US economy contracted at a sharp rate leading to high unemployment.
That scenario appeared to be a strong possibility in September of last year when Lehman Brothers collapsed. In addition, on September 15, 2009 there was a "tremendous draw down" of money market funds. See this video starting about 2:00 minutes in.
These facts were the primary reason there was such a rush to move TARP through Congress. In retrospect TARP is a prime reason why -- despite the tremendous financial strain over the last 18-24 months -- there have been a relatively small amount of bank failures.
The point of the above information is this: there was no financial meltdown. As a result one of the primary reasons that led to the Great Depression did not happen thereby lowering the possibility of a second Depression.
In addition, the Congress passed the stimulus package which is just now starting to hit the economy:
Not so fast, say the plan's authors. Larry Summers, director of the National Economic Council, says the stimulus already has contributed to the economy's recent stabilization. And Summers insists unemployment might already have hit 10% if the president hadn't acted. "I think the stimulus is just about on track, progressing about as we expected," he tells USA TODAY.
As of July 3, the administration says, about $217 billion of the stimulus is being felt throughout the economy. That breaks down into: $43 billion in payroll tax relief plus $174.9 billion the government has committed to contracts.
In Boulder, Colo., Blake Jones, president of Namaste Solar, says the stimulus saved about 15 jobs at his small manufacturer. A $3 billion Treasury Department program converted an existing tax credit for solar investments to a direct payment, prompting commercial customers who no longer could benefit from a tax credit to go ahead with projects.
"The outlook was very bleak. ... Now we're anticipating not losing business, but we may continue growing," Jones said.
While critics complain that the stimulus has been slow out of the gate, Summers says the administration always planned for the stimulus to work over a two-year period. So far, the modest economic boost from the government coffers has been overwhelmed by other developments. Oil prices have risen from roughly $35 a barrel in February to just under $60 today, draining more than $165 billion from the economy on an annual basis. Partly in response, the July reading of consumers' expectations for the future took its biggest dive since October.
And let's not forget the Federal Reserve also dropped interest rates to -- well -- 0% after adjusting for inflation.
Simply put, there has been strong policy response to the crisis. While there is disagreement about various parts of the packages the point is Washington has not sat on their hands -- they have acted. And these actions have prevented a complete collapse and or meltdown of not only the US financial system but the economy. As a result, we're now in the middle of a severe recession not a black swan situation.
If the economy had continued in free fall along multiple indicators the black swan argument would have merit. But the economy has in fact started to stabilize (albeit at low levels). Consider these charts:
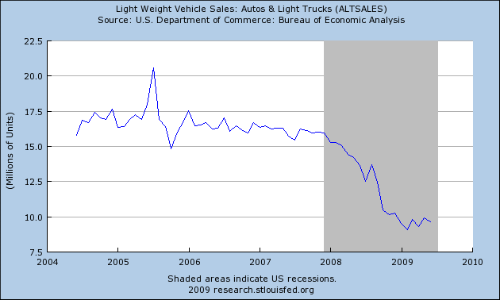
Auto sales have levels off, as have
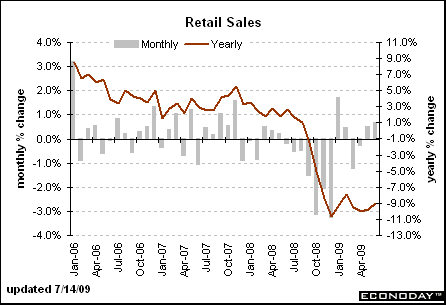
retail sales and
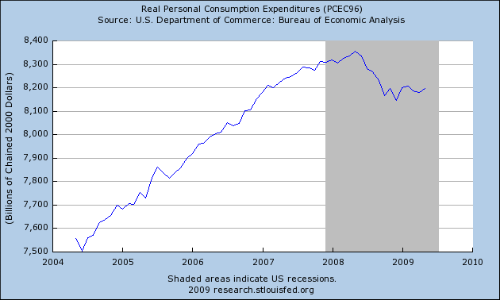
real personal consumption expenditures.
On the employment front, today we learned that initial unemployment claims are still coming down (as is the 4-week moving average)
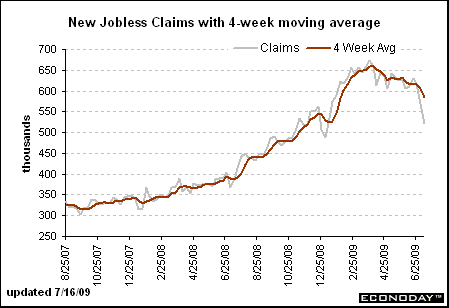
Simply there are multiple signs things are stabilizing albeit at low levels.
If the freefall had continued after the above mentioned policy actions, then the "black swan" arguments would be appropriate. But not in light of the information above. While things certainly are not great right now the evidence is the worst is behind us.
Unemployment Claims Drop

The 4-week moving average continues to drop.
New Deal Democrats wants to add the following point:
1. Historically there is a spike of new jobless claims that begins this week. This year there has been virtually no spike at all.
2. While the auto layoffs anomaly is a fair criticism, the proper way to deal with it is to spread the adjustment over the last ~10 weeks, with the result that the 4 week moving average would still be under 600,000 or about 10% under the peak from April, which suggests that this is a "real" indicator of nearly imminent GDP recovery.
Industrial Production Drops .4%
Industrial production decreased 0.4 percent in June after having fallen 1.2 percent in May. For the second quarter as a whole, output fell at an annual rate of 11.6 percent, a more moderate contraction than in the first quarter, when output fell 19.1 percent. Manufacturing output moved down 0.6 percent in June, with declines at both durable and nondurable goods producers. Outside of manufacturing, the output of mines fell 0.5 percent in June, and the output of utilities increased 0.8 percent. The rate of capacity utilization for total industry declined in June to 68.0 percent, a level 12.9 percentage points below its average for 1972-2008. Prior to the current recession, the low over the history of this series, which begins in 1967, was 70.9 percent in December 1982.
This is one set of statistics that still gives me the willies. Or -- to put it another way -- if there is anything that could screw up the bottoming process it's this series of numbers. Thankfully there are finally in a "less worse" situation.
Click for a larger image

Notice the following on the above chart:
1.) The monthly decline series has been improving in fits and starts for the last six months. However, it is still negative.
2.) The first quartet numbers were worse than the second quarter numbers (although both are still negative).
In addition, the charts are downright ugly still (click on all for a larger image):


The capacity utilization number indicates we're going to have a low investment total at the beginning of the next expansion as manufacturers ramp up existing production at the expense of new buildings/facilities etc...
Bottom line: if there is one series that really threatens a recovery this is it.
Thursday Oil Market Round-Up

On oil's weekly chart, notice that prices are still in an uptrend but they are right at crucial technical support levels. In addition, the MACD is close to giving a sell signal and prices have run into resistant from the 50 day EMA. Let's coordinate that data with the daily chart.

On the daily chart prices are below a trend line and are running into upside resistance at the 10 day EMA. Also note the shorter EMAs have crossed below the 50 day EMA. However, the MACD (which is declining) is moving into a position where it might give a sell signal.
Bottom line: there are equal weightings for the bull and bear argument right now.
Wednesday, July 15, 2009
Today's Markets

The main reason I thought the market was moving lower was the completion of a head and shoulders formation which usually moves lower. However, this time prices moved sharply higher. My reasoning behind the downward call was also based on a declining MACD and RSI along with a simple belief that traders would want to start taking some profits from the rally. In reality, we're gotten better than expected economic and earnings news and (probably) some short covering driving the market higher. The SPYs have broken through the upper trendline and are now just below the 200 day EMA.

The QQQQs have also moved through upper resistance on strong volume with a big gap higher. This was largely the result of Intel's announcement today.

Prices on the IWM are still contained, but today they gapped higher on strong volume.

The transports are either in a triangle consolidation pattern or a downward sloping pennant pattern. Either way they are still contained for now.
So -- we have two indexes that have moved through upside resistance and two more that are still contained. In addition, the transports hasn't broken through upside resistance yet. I think this is key because we need people to start trading like we're going to move more stuff from point A to point B in order for the economy to start growing again.
Intel's Earnings Surpirse
Intel Corp's quarterly results and outlook blew past Wall Street forecasts on better-than-expected consumer demand for PCs, especially in Asia, setting an auspicious tone for the technology sector.
Shares of Intel, the world's largest chipmaker, jumped 8 percent on the report, driving Standard & Poor's 500 stock index futures sharply higher and bolstering technology shares such as arch rival Advanced Micro Devices Inc.
Intel projected third-quarter revenue at $8.1 billion to $8.9 billion, compared with analysts' average forecast of $7.8 billion, according to Reuters Estimates.
CFO Stacy Smith said fourth-quarter gross margins could scale the high end of a "normal" range -- which Intel defines as 50 to 60 percent -- due partly to declining production costs for new generations of chips and other factors.
Intel's strong showing came despite what it described as weak demand from the corporations that traditionally are big buyers of computer equipment, and comments by Intel executives that Microsoft's forthcoming Windows 7 operating system is unlikely to revive corporate spending this year.
"You have an $8 billion quarter with very little enterprise spending taking place," said Broadpoint Amtech analyst Doug Freedman. "The consumer is healthier than we expected."
Retail Sales Up

The retail sales chart has three important pieces of information.
1.) The free-fall that occurred at the end of last year. After the public learned that Lehman was bankrupt and that the entire financial system was in free fall they literally stopped spending on everything. This is the area of long-gray lines.
2.) The consumer has started to return to the retail sphere. This is the second area of gray lines at the right.
3.) The year over year decline has bottomed. This is the circled area.
The general slant of the latest figure was it was caused by gasoline and car sales. Therefore this isn't a real increase. While I agree that unadjusted gasoline sales helped to increase sales, the increase in auto sales is encouraging. Sales ex-autos were up .3%. The sales increase was obviously caused by the shutdown of dealerships which was part of the GM and Chrysler bankruptcies. However, consumers saw deals and bought them. And they purchased durable goods -- which is also a good thing. People don't go into debt if they don't have some confidence in the future.
Budget Deficit Over $1 Trillion

According to the CBO, there are two problems: increased spending and decreased revenue --
For the first nine months of the fiscal year, declining receipts from individual income and payroll taxes account for almost 60 percent of the overall decrease in receipts. Those collections are down by almost $200 billion. Withholding of income and payroll taxes fell by about $80 billion (or 6 percent) compared with receipts in the first three quarters of 2008, primarily because of the ongoing effects of the recession on wages and salaries and the effective tax rates on that income. Receipts from corporate income taxes have declined sharply, falling by $133 billion (or 56 percent).Outlays through June were $457 billion higher than in the same period last year, CBO estimates. That total includes $147 billion for the Troubled Asset Relief Program (TARP), recorded on a net-present-value basis, and spending of $83 billion in support of Fannie Mae and Freddie Mac. Spending for all other federal programs rose by nearly 14 percent (or $275 billion) relative to outlays in the first nine months of fiscal year 2008. In contrast, net outlays for interest on the public debt declined by more than 25 percent (or $49 billion) because of lower short-term interest rates and lower costs for inflation-indexed securities.
Simply put, the economy is in one hell of a mess.
I personally advocated for the stimulus largely because at the time there were signs of the beginning of a deflationary spiral. Simply put -- no one wants that. And looking back, I would still make the same recommendation because deficit spending is the least objectionable of the options.
However, I also wrote an article about all the impact of all the spending which is below. I think it's good to note we're pretty much at the end of out fiscal ability right now (at least in my opinion).
Here begins the old article on the deficit.
There has been a war of words written about Washington's recent increase in spending. However, none of this has focused on the numbers -- as in the data. So, let's take a look at the numbers to see what they tell us.
First, some background. I was against Bush's deficit spending for a large part of his administration. One reason was I was against the Iraq War more or less from the beginning. From an economic perspective, war is a horrible utilization of resources. In addition, Bush made the same fiscal mistake Reagan made: he decreased revenues by cutting taxes and increased spending. This is a recipe for increasing debt, which was the final result of Bush's policies. Total debt outstanding at the end of Bush's first year in office (9/30/01) was $5,807,463,412,200.06. When he left office 9/30/08) that number was $10,024,724,896,912.49.
However, I supported most of the current spending (see this article and this article for more information). The reason for that is simple: read A Monetary History of the US by Milton Friedman -- especially the chapter titled "The Great Contraction". Starting with the announcement of Bear Stearns in the summer of 2007 that two of its hedge funds were suffering major losses the US financial system has been in a shooting gallery. What really made the great depression worse were the financial events of 1929-1933 when the US went through major financial turmoil. That essentially shut down the economy, leading to a contraction of more than "50% in current prices from 1929 to 1933". This time the situation was no different. In addition, by the end of 2008 it was obvious the country's greatest threat was a deflationary spiral. In short, the government had two choices: do nothing and practically guarantee economic free fall or do something to prevent it.
Throughout the above statements is the idea that government should act prudently during good times in order to spend during bad times -- that is, use its spending muscle during the bad times to limit the economic damage of a slowdown while cutting its spending and letting the private sector take over when the economy turns around. At least -- that's the ideal. It has yet to happen in real practice (although the 1990s came pretty close).
All that being said, let's take a look at where we are now. According to the Bureau of Public Debt, total US debt is $11,406,012,959,882.55 while total nominal US GDP is $14.089 trillion, making the debt/GDP ratio 80.956%. That's not good, but not catastrophic either. However, the budget projections from the CBO provide the following deficits for the years 2009-2012: $-1.845, $1.379, $-.970 and $-658. So, assuming these estimates are correct, by the end of fiscal 2012 we'll have $4.852 trillion more in debt. Tacking that onto the current daily total of all debt outstanding we get $16.258 trillion. Now -- assuming we have no growth for the next four years and our nominal GDP stays at $14 trillion we would have a debt/GDP ratio of 116% by the end of fiscal 2012. That is not a good development. That does assume there will be no GDP growth over the next 4 years which is also not likely. However, no matter how you slice the information it is not a healthy way to run an economy.
But let's look at this from another angle: interest paid on the debt. Let's assume we don't retire any debt (which we won't) buy only pay interest on the debt. Can we at least afford that? Here is a chart of the percentage of interest payments as a percentage of total federal expenditures.
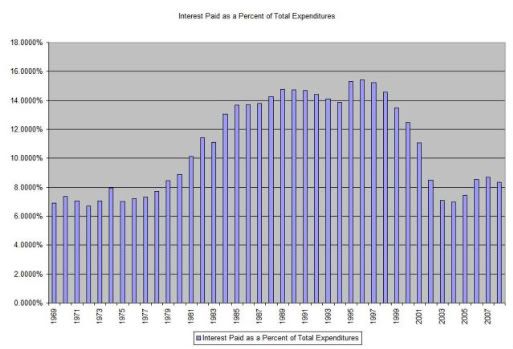
This number was at its highest in the late 1980s to the early 2000s when it fluctuated between (roughly) 14% and 15%. It dropped during the first part of this decade thanks to record low interest rates. Those will not remain for the next four years. However, the above chart indicates the interest payments are not so high we will face current problems. In addition, we do have room for upward movement on interest rates.
So -- the overall conclusion is we're going to be pushing the envelope of US finances which is never good. Overall debt/GDP will most surely be at 100% by the end of fiscal 2012. In addition, the interest component of the federal budget will surely increase as well. Now -- is this development fatal? No. But are we adding more stress to the system? Yes. But finally, do we have a choice? That is, is there another viable option right now? No. Fiscal conservatives (who by the way don't exist in the Republcan party's policy implementation arm) will argue to do nothing. But given the precarious nature of the economy right now that is still a recipe for economic suicide.
Wednesday Commodities Round-Up

On the multi-year chart, notice that we're still forming large reverse head and shoulders formation.

That places gold's latest move in context. What we have (so far) is a pennant pattern.

And on closer look we see that gold's sell-off may be nearing the end as indicated by the volume decrease over the last few weeks.
Tuesday, July 14, 2009
Today's Markets


Look at these charts in tandem. The six month chart at the top shows the current move could be the final piece in a bull market flag pattern -- prices have jumped to the upper band and appear ready to move through the band. The three month chart shows this in more detail
First -- this blows the "head and shoulders" analysis out of the water. In addition, it is starting to look like evil trader was right about this being a trap.

Jobless Claims: Comparing the current data with "False Dawns"
Partly in response to my previous post, New Jobless Claims at the End of Recessions, my co-blogger Invictus has raised the issue of "False Dawns". That's a fair question, and one that I deal with in detail in this post.
The original idea that under certain circumstances (all met here) the failure to make a new high in initial jobless claims during a recession only 3 weeks afterward, meant that the Recession was within a month or two of ending, was espoused by Robert J. Gordon at Vox EU, and was subsequently examined by Dr. James Hamilton of the UCSD at Econbrowser. The discussion by Gordon featured a nice comparative graph, which I have updated to show the subsequent course of new jobless claims since the time he prepared the graph (the data for the current recession is shown in deep red):

Gordon's article is lengthy and I encourage you to click through and read the whole note. In any event, Gordon identifies 6 "false dawns" during the recessions from 1970 to the present, analyzes each one, and purports to show that none of the conditions apply to the new high in the 4 week moving average for initial jobless claims that was recorded on April 4. Since we are now 13 weeks from that high, I have revisited and expanded his analysis to take into account behavior of initial jobless claims more than 3 weeks after a new high. Using a definition of at least a 3% decline in new claims over at least 2 weeks after a high, I have identified a further 3 candidates for "false dawns" in the 7 recessions - including the present one - since initial jobless claims have been reported starting in 1964.
Those calculations result in the chart below, identifying the year(s) of the observation of the period of "false dawn", the raw numbers of claims at both the false dawn and the subsequent false low, the percentage decline in claims, and the week of the subsequent new high in claims. Finally I give the number of weeks from false dawn to false low, and false dawn to new high.
| Year | week | False High | week | False Low | % decline | Weeks to new high | Weeks to false low | Weeks to next High |
|---|---|---|---|---|---|---|---|---|
| 1974 | 2/09 | 321 | 5/11 | 290.5 | (-9.4%) | 8/10 | 13 wks. | 26 wks. |
| 1981 | 12/26 | 551 | 1/16 | 521 | (-5.4%) | 2/13 | 3 wks. | 7 wks. |
| 1982 | 2/13 | 552.5 | 3/6 | 534 | (-3.4%) | 3/27 | 3 wks. | 6 wks. |
| 1982 | 4/24 | 587 | 5/22 | 583 | (-0.7%) | 6/5 | 4 wks. | 6 wks. |
| 1982 | 6/19 | 601 | 7/31 | 570 | (-5%) | 8/21 | 6 wks. | 9 wks. |
| 1990-1 | 12/29 | 456 | 1/19 | 438 | (-4%) | 2/2 | 3 wks. | 5 wks. |
| 2000 | 8/26 | 313 | 10/14 | 297 | (-5%) | 11/18 | 8 wks. | 13 wks. |
| 2001 | 1/6 | 352 | 1/20 | 338 | (-4%) | 2/10 | 2 wks. | 5 wks. |
| 2008-9 | 12/20 | 546 | 1/10 | 524 | (-6%) | 1/24 | 3 wks. | 5 wks. |
| 2009? | 4/4? | 659? | 7/4? | 606? | (-8%) | --- | 13 wks.? | --- |
In summary, only two of the 9 possible previous false dawns last more than 4 weeks to the false low, and only two lasted more than 9 weeks until a new high. Of those two, only one "false dawn" lasted 13 weeks until its false low, and only that same one featured a percentage decline in new claims as high as the current situation: the false dawn of February 1974. Gordon distinguishes the 1974 false peak by noting that "a distinguishing feature of global peaks is a preceding period of relatively rapid increases in new claims. The weekly change in new claims (as before, the four-week moving average) is always greater than 3% prior to true peaks" - unlike the +0.2% change in the 8 weeks just prior to the 1974 false peak.
As stated in the previous post, our current situation has featured a higher percentage decline from the high in new claims than most prior actual highs since the series' inception in 1964. That means, while the odds are not perfect, there is an extremely high probability, based on past patterns, that the April 4 high was the actual high for this recession and not a false dawn.