Monday, March 3, 2008

A Closer Look At the Industrials


The 5 year chart of the XLIs shows an average that is still above its long-term trend line. However, note the average is close to testing that line. Also note the possibility of a double top in late 2007.


Above is a year chart of the XLIs in daily increments. I found this chart to be very perplexing because I couldn't find clear patterns. However, I do think the descending triangle (the first shape on the chart) followed by the consolidation sector over the last month are pretty much on target. Also note the decreasing volume over the last month or so. This is a sign the consolidation is coming to and end and the chart will move in one or the other direction.


With the SMAs, notice the following:

-- Prices are just below the 200 day SMA, indicating a bear market. But prices aren't that far below.

-- The rest of the SMAs are bunched together, indicating a clear lack of direction. Also note that prices have been bouncing around between the SMAs for the last month or so.

The bottom line with this chart is it's looking for where to go.

A Closer Look At the Consumer Discretionary Sector

As I mentioned yesterday, I'm going to spend some time this week looking at each sector of the market to see that the charts say. Remember, I'm working on the assumption the economy is either in or very close to beginning a recession.


The XLYs rose from 2003-2004 then consolidated for 2005-2006. They went higher in 2007 forming a double top in the first half of the year and have since fallen to 2005-2006 levels on higher volume,


The chart for the last year shows a clear pattern of lower lows and lower highs -- a classic bearish chart.


The SMA picture is interesting. This is similar to a lot of charts we're seeing right now.

-- The 50 and 200 day SMAs are heading lower, while

-- The short SMAs (10 and 20 SMAs) are headed higher.

-- Prices are below the 200 day SMA

-- Prices have recently broken below the moving averages. If this continues, the SMA s -- all of them -- will continue to move lower.

Today's Markets

I'm going to use 5-day charts to show how the markets are doing.


Starting on Wednesday afternoon, the SPYs saw a lot of bear market pennant patterns. It's as though prices were falling down a set of stairs. However, it looks as though the market might be thinking about rallying. Today ended on a high-volume price spike. There is also the possibility of a double bottom today as well.


After forming an ascending triangle on Tuesday through Thursday last week, the QQQQs dropped hard, following the SPYs and IWMs lower. However, the QQQQs broke the downward trend in the last few minutes of trading on high volume, indicating a reversal might be in order.


The comments from the SPYs apply here, although without the double bottom comments.

A Closer Look At the Financial Sector

From IBD:

Global losses from mortgage and other credit problems will likely top $600 billion, UBS said. That's four times higher than the $150 billion or so that financial companies have marked down since the subprime debacle unfolded.

A separate study presented at a University of Chicago event forecast losses will hit $400 billion.

.....

AIG said Friday that the subprime housing debacle had thrown it into "uncharted waters" that were likely to remain choppy through 2008.

The insurance giant lost a surprise $5.29 billion in the fourth quarter, AIG said late Thursday. It also wrote down $11.1 billion worth of credit swaps.

.....

Huge losses from home loan finance giants Fannie Mae (FNM) and Freddie Mac (FRE) earlier in the week added to concerns, says Stanley.

.....

Rescue plans have been floated for MBIA (MBI) and Ambac Financial (ABK) amid fears they'll be unable to pay claims on subprime-related debt.


Loss estimates for the financial sector have been between roughly $300 - $500 billion. Now UBS is projecting a heftier amount of losses. This is in line with the news that commercial real estate may be the next shoe to drop:

After suffering a beating from their exposure to home loans, banks and securities firms are about to take their lumps from office towers, hotels and other commercial real estate. And the losses could last longer than those from the subprime shakeout.

As the economy wobbles and financing costs rise because of the credit crunch, commercial-real-estate values are starting to slide, with analysts at Goldman Sachs Group Inc. projecting a decline of 21% to 26% in the next two years. That means misery for securities firms with exposure to commercial-real-estate loans and commercial- mortgage-backed securities.

William Tanona, a Goldman analyst, expects total write-downs of $7.2 billion by Bear Stearns Cos., Citigroup Inc., J.P. Morgan Chase & Co., Lehman Brothers Holdings Inc., Merrill Lynch & Co. and Morgan Stanley in the first quarter. Those firms had combined commercial-real-estate exposure of $141 billion at the end of the fourth quarter.


The news for the financial sector has been terrible for the last 9 months. It started with Bear Stearns announcing two hedge funds lost $6 billion and simply progressed from there. This seems like a good time to take a closer look at the XLFs -- the financial sector tracking stock.


The 5-year chart shows the following:

-- The index formed a clear double top in early and mid-2007.

-- The index clearly broke this trend in mid-3Q 2007.

-- The index has dropped about 27% since then.

-- The drop occurred on extremely heavy volume.


Above is the same chart with the daily SMAs. Notice prices are clearly below the 200 day SMA by about 20%. That is a serious bear market.


Assuming the last 5 years comprise one long rally, here are the Fibonacci levels. Notice we are trading right at the lowest level.


Above is a three month daily chart to see the SMAs close-up. Notice:

-- Prices are below the 200 day SMA (see above)

-- The shorter SMAs are below the longer SMAs

-- The 200 and 50 day SMA are both headed lower.

-- The 10 and 20 day SMA are neutral as both are heading sideways right now.

The bottom line is this chart looks terrible. There are plenty of technical and fundamental reasons to stay away for the foreseeable future.

Personal Consumption Expenditures Flat

From the WSJ:

In the latest worrisome signs for the economy, consumer spending stalled in January, after adjusting for rising prices, and income growth slowed.

The Commerce Department said personal spending rose 0.4%, but was unchanged after adjusting for inflation. Such spending was also flat in December and October.

"Households limped into 2008 reeling from higher energy costs, falling home values, less credit availability and weakening employment," said Bank of America senior economist Peter Kretzmer in a note to clients.

.....

The price index for personal consumption expenditures, an inflation gauge watched closely by Federal Reserve policymakers, rose 0.4% in January from the previous month and was up 3.7% from a year ago. Excluding food and energy, prices rose 0.3% and increased 2.2% from January 2007 -- above the Fed's preferred range of 1.5% to 2%.


As IBD stated:

"People are spending all they earn and more just to keep up with inflation," said Joel Naroff, chief economist at Naroff Economic Advisors. "When you adjust for inflation, all that households did was run in place."


Above is a chart from Econoday of real disposable personal income -- income adjusted for inflation. Notice it has been trending down for the last 6 months on a year over year basis.


Above is a chart of real personal consumption expenditures -- consumption adjusted for inflation. Notice it too has been decreasing for the last 4-6 months and is not negative on a year over year basis.


The above chart -- also from Econoday -- shows the University of Michigan consumer sentiment indicator. Notice this indicator has been dropping for the better part of the last year. Dropping income contributes to lower consumer sentiment.

So -- 70% of the economy is clearly slowing. That does not bode well for overall economic growth.

Sunday, March 2, 2008

A Long-Term View of the Markets

Last week I posted a few article dealing with the overall macro-economic situation. here is a diary that uses Bernanke's Congressional testimony as a template for a discussion of the overall economy. 
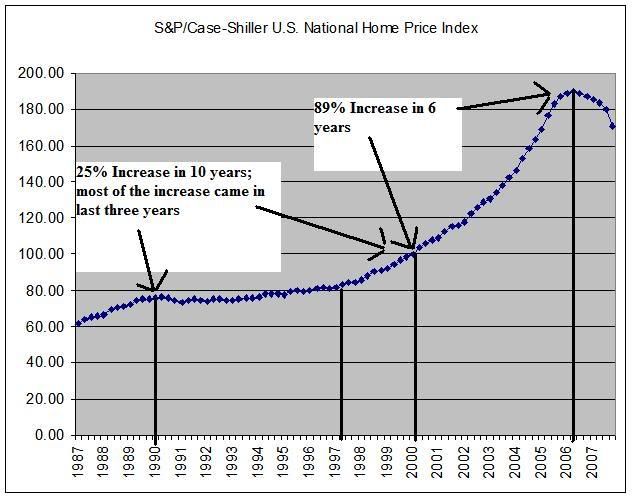
Here is a diary on why housing is nowhere near bottom. Here is an article regarding the strong headwinds consumers face.

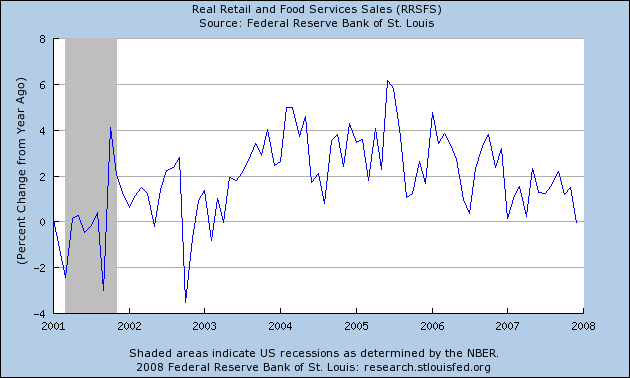
The short version of the above three articles is the economy is looking very bad right now. If we're not in a recession, we're really close to it. In addition, I think the situation in the financial industry will last for at least the next year adding further downward pressure on growth.

Let's assume that earnings are a big driver of the market. Considering that most traders use the S&P's overall PE ratio as a measure of value this seems a solid statement of fact. Therefore, if the economy is slowing, earnings will stand a good possibility of dropping which will lower share prices.

All of this means we can continue to expect the averages to under perform for the foreseeable future. So this week I'm going to look at a lot of charts of the indexes and industries to see what they say.


The 5 year SPYs chart shows the average has broken through two key upward sloping trend lines. In addition, the trend break occurred on high volume. Finally, prices settled around support from a price established in 2006. A move through that level would make 130 the next strong supper level (remember: the market's like round numbers).


The above chart assumes the last 5 years comprise one long upward sloping run. Therefore, use the Fibonacci levels as ideas for where support might be.


The SMAs paint a very confusing picture. The longer-term averages -- the 50 and 200 SMA -- are both heading lower. But the shorter term SMAs are bunched together with prices, indicating a clear lack of direction. Prices have been bouncing around the shorter SMAs for the last month or so.


The 5-year QQQQ chart shows the average has broken two key support lines. The upper channel line started in early 2004 and the upward trending support line started in mid-2006. Currently the QQQQs are consolidating.


Assuming the last 5 years is one ling uptrend, here are the Fibonacci levels for a pullback.


The SMA picture of the QQQQs is just as confusing as the SPYs. The shorter SMAs are below the longer SMAs. But the 10 and 20 day SMA are both heading sideways and both have been tangled up with the candles for the last month. This indicates a lack of direction in the market.


The IWMs have two possible support lines, but the average has clearly broken both.


Assuming the last 5 years has been one long uptrend, here are the Fibonacci retracement levels.


The SMA picture mirrors the SPYs. The longer SMAs (50 and 200 day) are clearly moving lower, but the shorter SMAs are heading sideways and are tangled up with price.


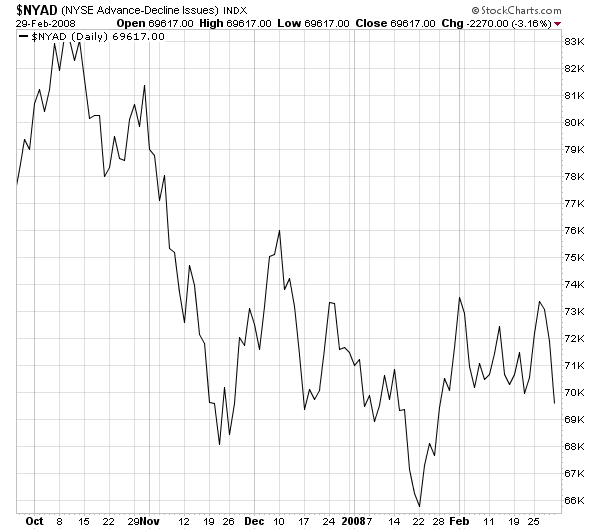
The NY advance/decline line shows the market's indecision. Notice this average is clearly in a trading range.


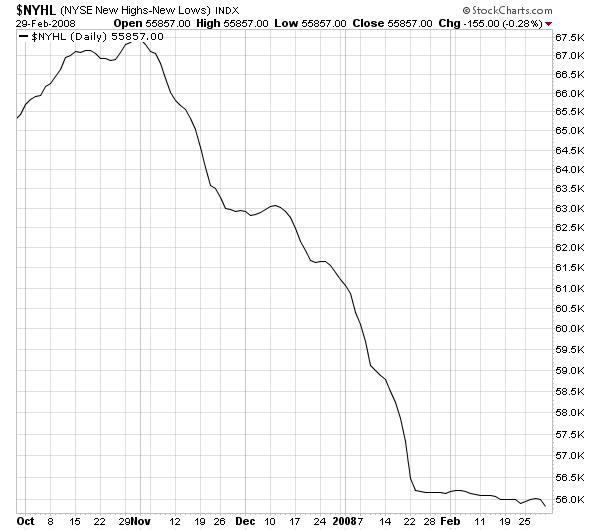
While the NY High/Low is heading lower, the angle has clearly moderated.


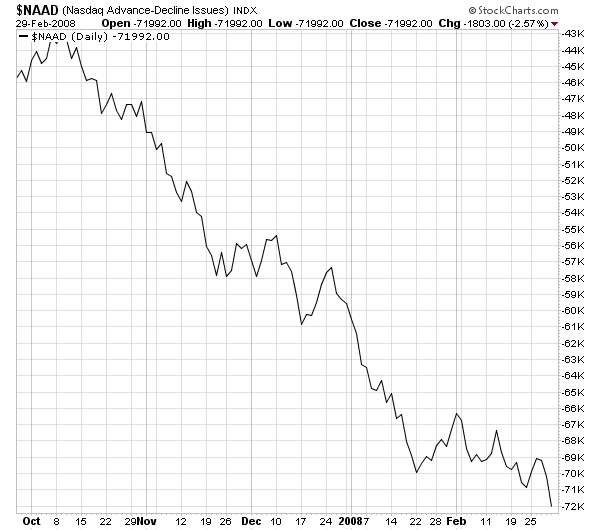
The NASDAQ advance/decline line is still moving lower, but again at a slightly smaller angle.


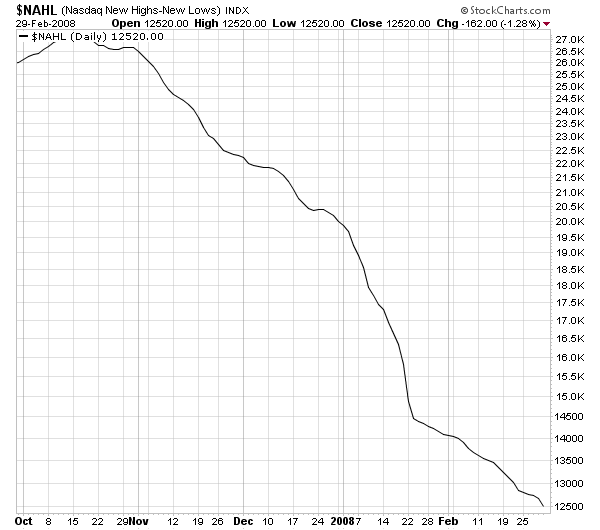
The NASDAQ new high/low line is heading lower, but at a slightly less severe angle.

So, what do all of these charts mean?

-- All of the major averages have clearly broken multi-year uptrends.

-- However, their current status is very unclear. The long-term SMAs say the markets are moving lower, while the shorter SMAs indicate a clear indecisiveness. My guess is the bad economic news is being trumped by the Fed's promises to continue cutting rates in the near future.

Next up, we'll take a look at some of the market sectors to see how their charts look.

The Week Ahead

The big news next week is the employment picture, which comes out on Friday.

On Monday we get ISM manufacturing and Construction spending. These are also very important. The Empire State and Philly Fed numbers were very weak last month. ISM should give us a clearer idea of where manufacturing is.

With construction spending, pay particular attention to non-residential. That has helped to keep this number from seriously crashing. However, with credit tightening this number may start to take a hit.

Saturday, March 1, 2008

Last Week's Markets


The SPYs rose until late Wednesday when they clearly broke their uptrend. The SPYs dropped for the rest of the week. There were several gaps down and the market closed the week on a low point on heavy volume. This is a very bearish last few days to the trading week.


The QQQQs formed a triangle consolidation (technically this is an ascending triangle because the bottom is, well, ascending) on Tuesday through Thursday. Note the 45.50 provided a great deal of resistance to the rally. Once the QQQQs broke through support they dropped hard. Notice the large gaps down and the fact the market ended near the low point for the week on heavy volume. This is also a very bearish chart.


The IWMs formed a double top on Tuesday and Wednesday. Then they dropped hard for the rest of the week. Notice the gaps down and the fact the index closed near its weekly lows on heavy volume.

On the daily charts notice the following:


The SPYs and QQQQs are still stuck in a trading range.


But the IWMs have broken lower.

Friday, February 29, 2008

Weekend Weimer and Beagle.

The markets are closed so it's time to stop thinking about economics and the markets. To help you get in the relaxing mood, here are some pictures of my dogs (the Weimeraners) and the future Mr$. Bonddad's dog -- the Beagle.


The Coming Negative Equity Problem

Mish has been all over this story.

From today's WSJ:

Goldman Sachs economists estimate that as much as $3 trillion in mortgages could be underwater by the end of the year, leaving 30% of the country's outstanding mortgages in negative equity. Since there is roughly $1 trillion in subprime mortgages outstanding, that means a large amount of better-quality mortgages, such as prime and Alt-A -- a category between prime and subprime -- will be attached to negative equity.


This situation is already leading to people walking away:

Sgt. First Class Nicklaus Skaggs is among those looking to walk way. Mr. Skaggs bought his home in April 2005 shortly after returning to California from a one-year tour of duty in Baghdad.

The $455,000 three-bedroom home he and his wife purchased in Vacaville, about one hour northeast of San Francisco, is worth an estimated $285,000 today, well below the $453,000 he owes on his mortgage. The monthly mortgage payment, which jumped after its interest rate increased, is now $4,000, up from $2,980 when he bought the house.

Mr. Skaggs expects to be redeployed to Iraq again later this year. But he can't sell his home, since there are few buyers, and he can't refinance because lenders require a large down payment he doesn't have. Now, the 18-year Army veteran has decided to walk away from his mortgage. He hopes in a few years lenders see his decision as a unique situation created by the housing meltdown. "I don't think that house is going to recover in value any time soon," said the 40-year-old. "I'd just be throwing the money away."

.....

In the Phoenix area, where home prices were off 15% in the fourth-quarter when compared with a year ago, accountant Steven Ulrich says several of his clients have recently said they plan to walk away. One client's home is now worth $100,000 less than the mortgage and the other is $60,000 underwater.

"It surprised me," said Mr. Ulrich, who works at The Focus Group in Scottsdale. "I'd never had people doing that before, if they had to it was something they were forced into. But these people are choosing it as a strategy, and I think it's going to be happening a lot more."


First, this is entirely rational behavior. There is no point in paying more for something than it is worth.

The financial sector is going to have problems for some time because of this. By some time I mean at least the next year and probably longer. Notice where home prices are on the Cash Shiller price index; prices are just starting to correct:


The bottom line is all the writedowns we've been hearing about are going to continue for the foreseeable future. The writedowns first started because the debt wasn't worth nearly as much as people thought it was. Now we have a second problem: lenders who actually hold the underwater mortgages will be forced to devalue them in order to reflect current market condition.

Now -- let's see how this will impact financial institutions. According to the FDIC, here are some highlights about where FDIC insured banks are currently:

For all of 2007, insured institutions earned $105.5 billion, a decline of $39.8 billion (27.4 percent) from 2006. This is the lowest annual net income for the industry since 2002 and is the first time since 1999-2000 that annual net income has declined. While much of the decline in industry earnings was concentrated among some of the largest institutions, evidence of broader weakness in earnings bespoke an operating environment that was less favorable than in previous years.

.....

Net charge-offs registered a sharp increase in the fourth quarter, rising to $16.2 billion, compared to $8.5 billion in the fourth quarter of 2006. The annualized net charge-off rate in the fourth quarter was 0.83 percent, the highest since the fourth quarter of 2002. Net charge-offs were up year-over-year in all major loan categories except loans to the farm sector (agricultural production loans and real estate loans secured by farmland).

.....

Despite the heightened level of charge-offs, the rising trend in noncurrent loans that began in mid-2006 continued to gain momentum in the fourth quarter. Total noncurrent loans -- loans 90 days or more past due or in nonaccrual status -- rose by $26.9 billion (32.5 percent) in the last three months of 2007. This is the largest percentage increase in a single quarter in the 24 years for which noncurrent loan data are available.


.....

Insured institutions’ loss reserves posted their largest increase in 20 years in the fourth quarter, but this growth did not keep pace with the growth in noncurrent loans.


Ladies and gentlemen, the quarterly banking profile indicates times are just starting to really hit the banks. But you ain't seen nothing yet.

The Dollar's Plight and Status

There is a fascinating story in today's WSJ today about the dollar. It mentions the current nosedive is causing a ton of problems for countries around the world. But it also mentions the dollar is very entrenched in global finance which means changing dominant currencies (to the euro, for example) would be extremely difficult.

Beaten down by fears of a U.S. recession, the dollar is falling with new speed -- creating severe challenges not just for the U.S., but also for sugar traders in Brazil, central bankers in the Persian Gulf and a host of others.

.....

Yet for all of the gloom, the world is unready to let go of America's unloved dollar. Akin to the way Microsoft's often-criticized Windows operating system remains indispensable to the majority of computer users, the dollar remains the common language of finance, the medium of exchange in everything from sugar to wheat to oil.

Shaking the dollar loose from that place would require a vast reworking of the global financial system that few parties seem prepared to confront. It is far from certain that the dollar will continue to decline. But if it does, businesses and policy makers around the world could be wrestling with the problems created by their dependence on it for many years.


I love the Microsoft comparison -- that just makes me feel warm and fuzzy all over. But I think it is a very apt comparison.

The whole article is a great read.

Thursday, February 28, 2008

Translating "Fedspeak"

Bernanke spoke to Congress on Wednesday. His opening statements provide a good outline of where the economy is presently. I have interspersed his comments with some news stories and various graphs to clarify Barnanke's points. I have separated his comments by indenting and italicizing them.

Here is a link to his complete testimony.

The economic situation has become distinctly less favorable since the time of our July report. Strains in financial markets, which first became evident late last summer, have persisted; and pressures on bank capital and the continued poor functioning of markets for securitized credit have led to tighter credit conditions for many households and businesses. The growth of real gross domestic product (GDP) held up well through the third quarter despite the financial turmoil, but it has since slowed sharply. Labor market conditions have similarly softened, as job creation has slowed and the unemployment rate--at 4.9 percent in January--has moved up somewhat.


Regarding banking:

Record-high loan-loss provisions, record losses in trading activities and goodwill impairment expenses combined to dramatically reduce earnings at a number of FDIC-insured institutions in the fourth quarter of 2007. Fourth-quarter net income of $5.8 billion was the lowest amount reported by the industry since the fourth quarter of 1991, when earnings totaled $3.2 billion. It was $29.4 billion (83.5 percent) less than insured institutions earned in the fourth quarter of 2006. The average return on assets (ROA) in the quarter was 0.18 percent, down from 1.20 percent a year earlier. This is the lowest quarterly ROA since the fourth quarter of 1990, when it was a negative 0.19 percent. Insured institutions set aside a record $31.3 billion in provisions for loan losses in the fourth quarter, more than three times the $9.8 billion they set aside in the fourth quarter of 2006.


GDP isn't doing that well:

The U.S. economy slowed sharply in the fourth quarter, growing at a 0.6% annual rate, unrevised from last month's estimate, the Commerce Department reported Thursday.

For all of 2007, the economy grew at the weakest pace in five years, rising at an inflation-adjusted 2.2% after a 2.9% gain in 2006. The economy grew 4.9% in the third quarter.


Employment isn't looking that hot either:


Year over year job growth has been dropping for about a year and a half and is now negative.


Also note the unemployment rate is edging up.

Many of the challenges now facing our economy stem from the continuing contraction of the U.S. housing market. In 2006, after a multiyear boom in residential construction and house prices, the housing market reversed course. Housing starts and sales of new homes are now less than half of their respective peaks, and house prices have flattened or declined in most areas. Changes in the availability of mortgage credit amplified the swings in the housing market. During the housing sector's expansion phase, increasingly lax lending standards, particularly in the subprime market, raised the effective demand for housing, pushing up prices and stimulating construction activity. As the housing market began to turn down, however, the slump in subprime mortgage originations, together with a more general tightening of credit conditions, has served to increase the severity of the downturn. Weaker house prices in turn have contributed to the deterioration in the performance of mortgage-related securities and reduced the availability of mortgage credit.

The housing market is expected to continue to weigh on economic activity in coming quarters. Homebuilders, still faced with abnormally high inventories of unsold homes, are likely to cut the pace of their building activity further, which will subtract from overall growth and reduce employment in residential construction and closely related industries.


New home sales have been dropping for awhile.


Existing home sales have been as well

I dealt with housing this week in this article.

Consumer spending continued to increase at a solid pace through much of the second half of 2007, despite the problems in the housing market, but it appears to have slowed significantly toward the end of the year. The jump in the price of imported energy, which eroded real incomes and wages, likely contributed to the slowdown in spending, as did the declines in household wealth associated with the weakness in house prices and equity prices. Slowing job creation is yet another potential drag on household spending, as gains in payroll employment averaged little more than 40,000 per month during the three months ending in January, compared with an average increase of almost 100,000 per month over the previous three months. However, the recently enacted fiscal stimulus package should provide some support for household spending during the second half of this year and into next year.


Real retail sales -- sales adjusted for inflation -0 are barely positive right now.


Personal Consumption Expenditures aren't looking that hot either.

The business sector has also displayed signs of being affected by the difficulties in the housing and credit markets. Reflecting a downshift in the growth of final demand and tighter credit conditions for some firms, available indicators suggest that investment in equipment and software will be subdued during the first half of 2008. Likewise, after growing robustly through much of 2007, nonresidential construction is likely to decelerate sharply in coming quarters as business activity slows and funding becomes harder to obtain, especially for more speculative projects. On a more encouraging note, we see few signs of any serious imbalances in business inventories aside from the overhang of unsold homes. And, as a whole, the nonfinancial business sector remains in good financial condition, with strong profits, liquid balance sheets, and corporate leverage near historical lows.


Ben's right about business investment -- it's been pretty strong. But with the credit crunch, I have to wonder how long that can last. My guess is a lot of the growth we've seen over the last two quarters comes from deals that started before the credit markets fell apart. The next few quarters will be crucial to determining if the trend continues.


Overall industrial production is doing fine. But you have to remember this figure includes all production such as utilities.


The Philly and Empire State indexes tell a very different tale. They show a lot of pullback.


And last months durable goods numbers weren't that good -- and durable goods orders have been negative from a year over year perspective for the last year.

The only good picture in all of this is exports -- one of the few benefits of a crashing dollar.

Bottom line: Ben has a lot of reasons to be concerned right now.