Saturday, March 17, 2007
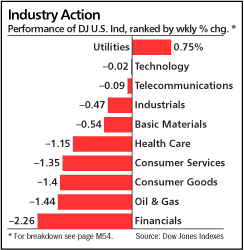
Can You Say Flight to Qualtiy?
From Barron's. Utilities were the only industry to gain last week. Also not that financial shares -- which contain subprime mortgage lending and are the largest percentage component of the S&P 500 -- were the biggest looser.


Last Week in Review
I finally broke down a few months ago and got a subscription to Barron's which has been one of my favorite financial publications for a really long time. The following excerpt is from their weekly market wrap (subscription required):
This article highlights two important trends. The first is simple US market strength. When the big financial heads talk about the US markets being deep and robust, they are talking about a combination of factors -- overall confidence in the economy, sophisticated analysis, overall a pretty good spreading out of risk etc... When the author above notes all of the problems the US market has weathered in the last 5-6 years, these factors are an underpinning of his statements.
In addition, the damage from the housing and auto sector's problems has been contained. I should add the important caveat: so far. We still have a while to go before either of these sectors hits bottom, so it's still possible the negative effects will bleed into the national economy.
So -- the US markets are resilient.
HOWEVER, the subprime problems of the last few months have once again raised understandable concern about how resilient the US economy is. When the author is talking about people sniffing around for problems, this is what he is talking about. Right now the market is still trying to figure out the complete impact of the subprime shakeout. Frankly, we don't know its complete impact, so everybody is looking for signs that problems have bled into another area.
Psychologically, these are the two forces competing righting now.
Whether the recent pullback will prove prescient, or become yet another premature over-reaction, remains to be seen. The ferocity of Tuesday's selling -- declining stocks outpaced advancing ones, 10 to 1 -- certainly suggests a vigilant crowd sniffing for the first whiff of trouble.
"That intensity has less to do with the market's fundamentals than its mindset -- the mindset of a market looking for a crisis," says James Paulsen, Wells Capital Management's chief investment strategist. He ticked off a litany of "crises" that had menaced the economy since this bull market began, including the Iraq war, the jobless recovery in 2003, interest-rate hikes that began in 2004, the bird-flu scare, the oil-price surge, Hurricane Katrina, the 2006 inflation scare, the flat-yield curve and, now, the subprime spill. "Each time, caution has persisted, and that has allowed the bull run to persist," he says.
While the housing and auto segments contracted by an alarming 10% last year, these make up 9% of real gross domestic product. The rest of the economy expanded 4.3% in 2006. "For widespread fears of continued economic weakness to prove correct, both housing and autos will need to keep collapsing this year," Paulsen says.
This article highlights two important trends. The first is simple US market strength. When the big financial heads talk about the US markets being deep and robust, they are talking about a combination of factors -- overall confidence in the economy, sophisticated analysis, overall a pretty good spreading out of risk etc... When the author above notes all of the problems the US market has weathered in the last 5-6 years, these factors are an underpinning of his statements.
In addition, the damage from the housing and auto sector's problems has been contained. I should add the important caveat: so far. We still have a while to go before either of these sectors hits bottom, so it's still possible the negative effects will bleed into the national economy.
So -- the US markets are resilient.
HOWEVER, the subprime problems of the last few months have once again raised understandable concern about how resilient the US economy is. When the author is talking about people sniffing around for problems, this is what he is talking about. Right now the market is still trying to figure out the complete impact of the subprime shakeout. Frankly, we don't know its complete impact, so everybody is looking for signs that problems have bled into another area.
Psychologically, these are the two forces competing righting now.
Friday, March 16, 2007
The Markets Today
At least it's Friday. The markets meandered traded in different ways today.
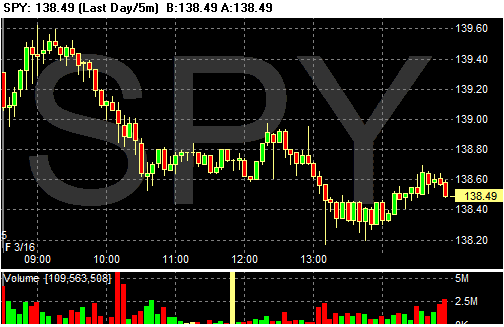
The SPYs couldn't find a bottom until after 3PM EST. While they rallied after that, note the heavy volume of selling at the end. If the selling had started sooner there may have been a big end-of-the-day sell-off.
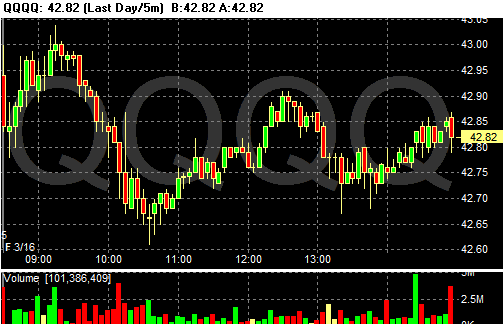
The QQQQs were down a touch (.09%), largely because of the strong computer industrial production figure. Traders were obviously looking for a tech rebound. But notice that like the SPYs there was a big volume spike at the end of the day.
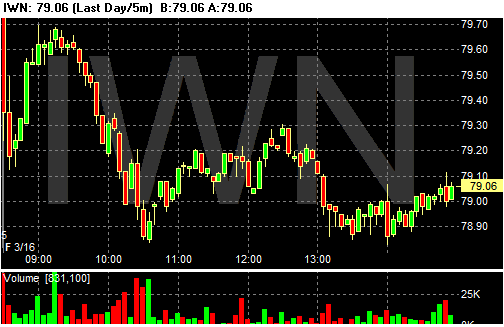
The IWNs just couldn't get any momentum today. They hit the same floor twice, tried to rally from there and just couldn't make it.
Short version -- the markets just aren't that happy right now.
The SPYs couldn't find a bottom until after 3PM EST. While they rallied after that, note the heavy volume of selling at the end. If the selling had started sooner there may have been a big end-of-the-day sell-off.
The QQQQs were down a touch (.09%), largely because of the strong computer industrial production figure. Traders were obviously looking for a tech rebound. But notice that like the SPYs there was a big volume spike at the end of the day.
The IWNs just couldn't get any momentum today. They hit the same floor twice, tried to rally from there and just couldn't make it.
Short version -- the markets just aren't that happy right now.
Industrial Production Ramps Up
From the Federal Reserve:
The big increase came in consumer goods which increased a very large 1.5%, and utilities which increased 6.7%.
We've been getting a mixed signal from the industrial/manufacturing statistics for the last few months. The regional Fed surveys have been mixed, the ISM is hovering around neutral, yet the industrial production number jumped a pretty large 1% in March.
It's important to remember this jump was in two areas, one of which (utilities) can be attributed to weather related issues. In addition, the downward GDP revision from earlier this month was attributed to a technical inventory issue. Commentators noted because of the downward revision in inventories industrial production would have to increase. It appears that is happening.
Industrial production increased 1.0 percent in February after a decrease of 0.3 percent in January and a rise of 0.8 percent in December. Output in the manufacturing sector gained 0.4 percent in February and was led by increases in motor vehicles and in high-technology goods. The output of utilities jumped 6.7 percent in February, as colder-than-average temperatures boosted production at both electric and natural gas utilities. The output of mines edged up 0.1 percent. At 113.1 percent of its 2002 average, overall industrial production for the month was 3.4 percent above its year-earlier level. The rate of capacity utilization for total industry in February rose 0.6 percentage point, to 82.0 percent, a level 1.0 percentage point above its 1972-2006 average.
The big increase came in consumer goods which increased a very large 1.5%, and utilities which increased 6.7%.
We've been getting a mixed signal from the industrial/manufacturing statistics for the last few months. The regional Fed surveys have been mixed, the ISM is hovering around neutral, yet the industrial production number jumped a pretty large 1% in March.
It's important to remember this jump was in two areas, one of which (utilities) can be attributed to weather related issues. In addition, the downward GDP revision from earlier this month was attributed to a technical inventory issue. Commentators noted because of the downward revision in inventories industrial production would have to increase. It appears that is happening.
CPI Up .4%
From the BLS:
Food increased .8% -- the highest move in a year. It increased .7% in January. The compounded annual 3-month food index is 6.1%. In other words, agricultural price spikes noted yesterday are starting to bleed through to consumer prices.
CBS Marketwatch noted:
Energy prices increased .9% and their compound 3-month growth rate is 14.9%. In other words, the more volatile elements of the index are rising pretty fast right now.
The unadjusted 12-month rate is 2.4% -- .4% above the Fed's comfort zone.
Here's how Bloomberg reported this news:
The Consumer Price Index for All Urban Consumers (CPI-U) increase 0.5 percent in February, before seasonal adjustment, the Bureau of Labor Statistics of the U.S. Department of Labor reported today. The February level of 203.499 (1982-84=100) was 2.4 percent higher than in February 2006.
Food increased .8% -- the highest move in a year. It increased .7% in January. The compounded annual 3-month food index is 6.1%. In other words, agricultural price spikes noted yesterday are starting to bleed through to consumer prices.
CBS Marketwatch noted:
Food prices jumped for the second straight month, rising 0.8% -- the largest gain in nearly two years. Prices for fresh fruit rose 5.7%, the most in 19 years, while fresh vegetable prices also rose by 5.7%. Read the full government report.
Cold weather in California has damaged some crops, sending prices higher. Corn -- a primary input for many food items -- has also increased in price as more of the crop gets earmarked for ethanol production.
Energy prices increased .9% and their compound 3-month growth rate is 14.9%. In other words, the more volatile elements of the index are rising pretty fast right now.
The unadjusted 12-month rate is 2.4% -- .4% above the Fed's comfort zone.
Here's how Bloomberg reported this news:
Prices paid by U.S. consumers rose 0.4 percent last month, paced by gains in fuel, food and medical care that highlight Federal Reserve concerns over inflation.
The increase in the consumer price index followed a 0.2 percent January rise, the Labor Department said today in Washington. Core prices, which exclude food and energy, rose 0.2 percent and were 2.7 percent higher than a year earlier.
Combined with last month's jump in wholesale prices, the figures make it tougher for the Fed to lower rates should the mortgage crisis cause the economy to stumble. Policy makers are forecast to leave their benchmark interest rate unchanged for a sixth time when they meet next week.
``Inflation is running faster than the Fed would like it to run,'' Michael Moran, chief economist at Daiwa Securities America Inc. in New York, said before the report. ``They believe it will fall gradually on its own as economic growth eases and they'll be patient in reacting to the numbers.''
Dollar Update
From Bloomberg:
Let's look at the daily and weekly charts from Stockcharts. Here's the daily chart:
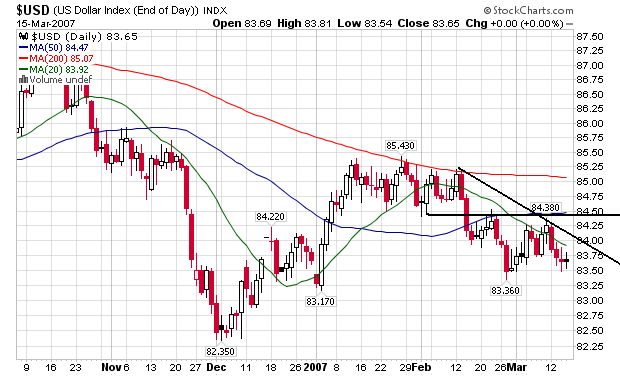
From a technical perspective, notice the latest rally didn't even hit resistance established in late January/early February. Instead the average reversed a bit above the 20-day SMA. Also notice that instead of breaking out once it crossed the 20-day SMA, the dollar index reversed. All of this simply says there is a lack of upward momentum in the dollar index.
Here's the weekly chart:
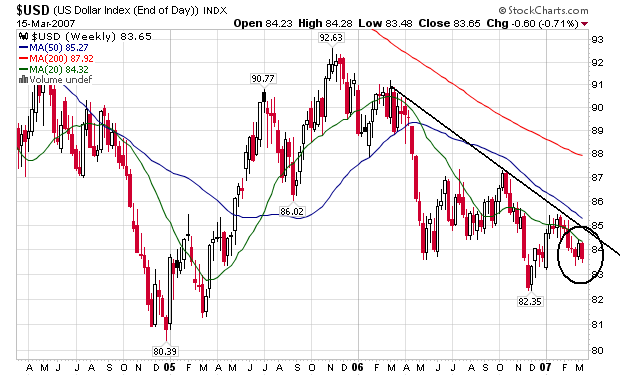
We're still firmly in a downtrend. In fact, as we approached the downtrend line we reversed with a strong bar which is in the circled area. All this means there is a strong bearish sentiment on the weekly chart.
The dollar slid to the lowest level this year against the euro before a U.S. consumer-confidence report that may reinforce concern economic growth is slowing.
The U.S. currency also headed for the biggest weekly loss since early December on speculation rising numbers of homebuyers with poor credit histories will fail to pay back loans. Signs that a housing slowdown is feeding through to consumption are also hurting the dollar. Global stocks fell today, adding to losses this month that may weigh on spending by individuals.
``The U.S. dollar is under pressure,'' said Hans Guenter Redeker, head of currency strategy at BNP Paribas SA in London. ``The U.S. economy is weakening'' and with ``the interest rate gap closing, obviously you want to have euros, not dollars.''
Let's look at the daily and weekly charts from Stockcharts. Here's the daily chart:
From a technical perspective, notice the latest rally didn't even hit resistance established in late January/early February. Instead the average reversed a bit above the 20-day SMA. Also notice that instead of breaking out once it crossed the 20-day SMA, the dollar index reversed. All of this simply says there is a lack of upward momentum in the dollar index.
Here's the weekly chart:
We're still firmly in a downtrend. In fact, as we approached the downtrend line we reversed with a strong bar which is in the circled area. All this means there is a strong bearish sentiment on the weekly chart.
China Approves Property Laws
From the NYTimes:
First a BIG caveat: I have no knowledge of internal Chinese politics, nor do I have any knowledge of its legal system. Therefore I can't comment on the sincerity of this law.
But, this is a very interesting development from a historical perspective. A passing analysis of democratic development indicates property rights are an essential element in the democratic development. I think you can successfully argue that the growth of the middle class was in fact a primary reason for Democratic development during the Renaissance.
After more than a quarter-century of market-oriented economic policies and record-setting growth, China on Friday enacted its first law to protect private property explicitly.
The measure, which was delayed a year ago amid vocal opposition from resurgent socialist intellectuals and old-line, left-leaning members of the ruling Communist Party, is viewed by its supporters as building a new and more secure legal foundation for private entrepreneurs and the country’s urban middle-class home and car owners.
But delays in pushing it through the Communist Party’s generally pliant legislative arm, the National People’s Congress, and a ban on news media discussion of the proposal, raise questions about the underlying intentions and the governing style of President Hu Jintao and Prime Minister Wen Jiabao, experts say.
First a BIG caveat: I have no knowledge of internal Chinese politics, nor do I have any knowledge of its legal system. Therefore I can't comment on the sincerity of this law.
But, this is a very interesting development from a historical perspective. A passing analysis of democratic development indicates property rights are an essential element in the democratic development. I think you can successfully argue that the growth of the middle class was in fact a primary reason for Democratic development during the Renaissance.
Thursday, March 15, 2007
More Agricultural Price Charts
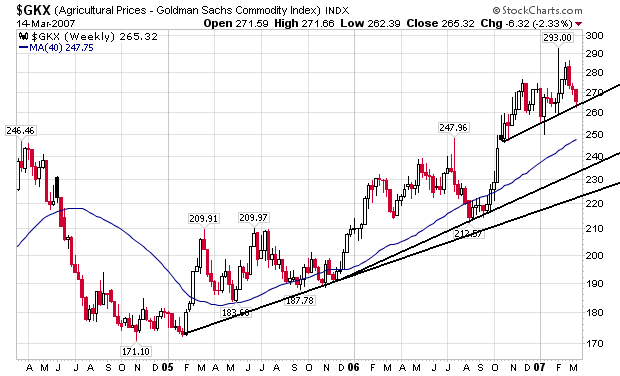
This is a chart from Stockcharts of the CRB Agricultural Index. It says one thing: agricultural prices are increasing at a high rate:
The Markets Today
Instead of looking at an intra-day chart, today I wanted to look at the 3-month daily charts for the SPYs, QQQQs and IWNs. It's been a few weeks since the first big sell-off, so the markets have had time to absorb that loss and figure out where they're going.
Here's the SPYs and IWNs
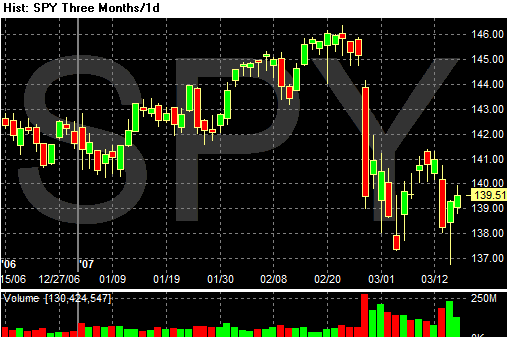
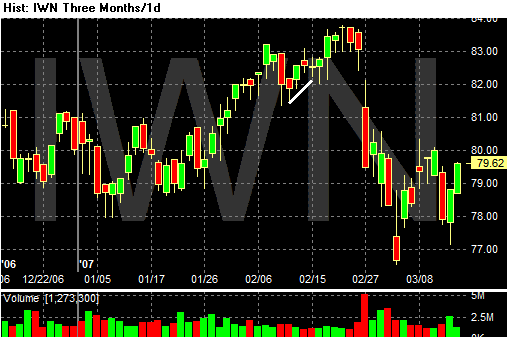
The most bullish interpretation of both these charts is they are forming a double bottom or triangge consolidation. A double bottom is a reversal pattern, meaning it occurs at tops or bottoms. If this is the case, then the market should rally from here If this is a triangle formation it can be either a reversal or continuation pattern (meaning a pattern that occurs in the middle of a trend). If that is the case we need the market to move decisively in one direction or another to confirm the trend.
Because there are multiple and conflicting technical interpretations of the current market fundamental considerations are more important than usual. Fundamentally we've had a ton of bad news over the last few weeks. Subprime mortgage problems abound; manufacturing is hovering between expansion and contraction and producer prices increased more than estimated which hems in the Fed. In other words, the fundamental backdrop clearly favors the bears.
Here's a chart for the QQQQs:
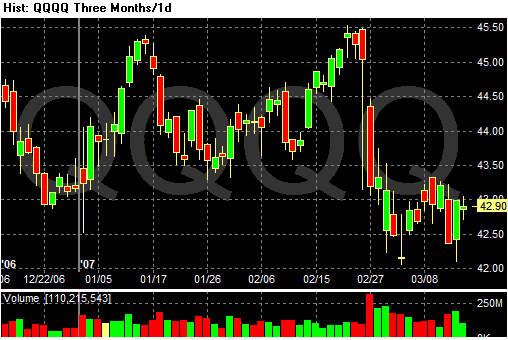
This is what Gartley would call a "complex" formation, which means it's difficult to categorize conclusively. I think of these patterns as rectangle patterns, largely because you can draw a rectangle around it. There is the possibility of a double bottom and a triangle, but neither formation are very strong.
All of the previous fundamental analysis still applies.
Short version: we're still waiting for confirmation in either direction, but the fundamental picture is not promising.
Here's the SPYs and IWNs
The most bullish interpretation of both these charts is they are forming a double bottom or triangge consolidation. A double bottom is a reversal pattern, meaning it occurs at tops or bottoms. If this is the case, then the market should rally from here If this is a triangle formation it can be either a reversal or continuation pattern (meaning a pattern that occurs in the middle of a trend). If that is the case we need the market to move decisively in one direction or another to confirm the trend.
Because there are multiple and conflicting technical interpretations of the current market fundamental considerations are more important than usual. Fundamentally we've had a ton of bad news over the last few weeks. Subprime mortgage problems abound; manufacturing is hovering between expansion and contraction and producer prices increased more than estimated which hems in the Fed. In other words, the fundamental backdrop clearly favors the bears.
Here's a chart for the QQQQs:
This is what Gartley would call a "complex" formation, which means it's difficult to categorize conclusively. I think of these patterns as rectangle patterns, largely because you can draw a rectangle around it. There is the possibility of a double bottom and a triangle, but neither formation are very strong.
All of the previous fundamental analysis still applies.
Short version: we're still waiting for confirmation in either direction, but the fundamental picture is not promising.
Philly Fed Stalls
This chart from the report says it all.
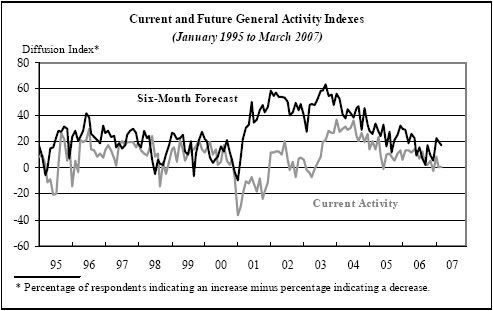
Business conditions are hovering around zero. They have been here before and bounced, so this might not be a predictor of future problems.
But the usual 6-month enthusiasm has decreased a bit:
This is a weak report as well. Overall business conditions are hovering between expansion and contraction.
Here's a link to the full report -- Here's a PDF
Business conditions are hovering around zero. They have been here before and bounced, so this might not be a predictor of future problems.
But the usual 6-month enthusiasm has decreased a bit:
The outlook for manufacturing growth over the next six months showed a slight moderation this month. The future general activity index fell three points, and most of the other future indicators followed suit: The index for future new orders decreased four points, and future shipments decreased one point. Firms were also less optimistic about future growth in employment. The future employment index decreased eight points; 25 percent of the firms expect to increase employment over the next six months, and 16 percent expect to decrease it.
This is a weak report as well. Overall business conditions are hovering between expansion and contraction.
Here's a link to the full report -- Here's a PDF
Empire State Index Drops Big
Here is a link to the PDF report
The general business conditions index dropped from 24.3 to 1.8. That's the biggest drop we have seen in a year. The index increased last month, but that was obviously a one-time pop. I'm thinking it may have been simple enthusiasm for the new year.
New orders decreased from 19 to 3. This is another very large drop -- one that has not happened in the last year.
Prices paid increased slightly from 27 to 30.
This is a bad report, plain and simple. It shows a sharp decline in the present business conditions.
The general business conditions index dropped from 24.3 to 1.8. That's the biggest drop we have seen in a year. The index increased last month, but that was obviously a one-time pop. I'm thinking it may have been simple enthusiasm for the new year.
New orders decreased from 19 to 3. This is another very large drop -- one that has not happened in the last year.
Prices paid increased slightly from 27 to 30.
This is a bad report, plain and simple. It shows a sharp decline in the present business conditions.
PPI + 1.3%, Core +.4%; Agricultural Price Spikes Hit Numbers
From the BLS:
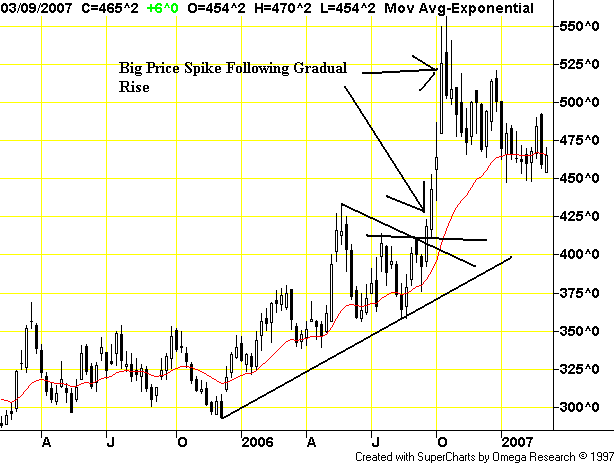
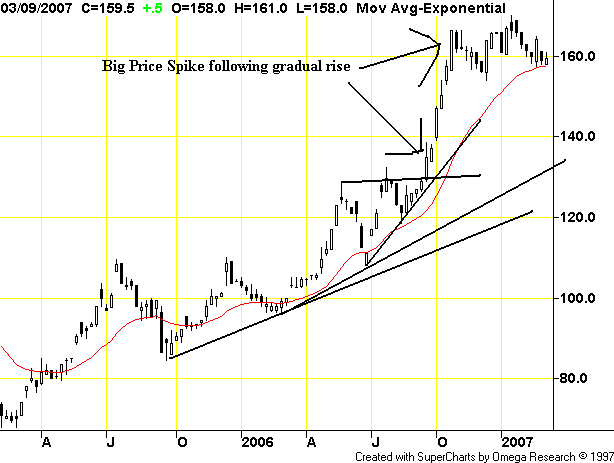
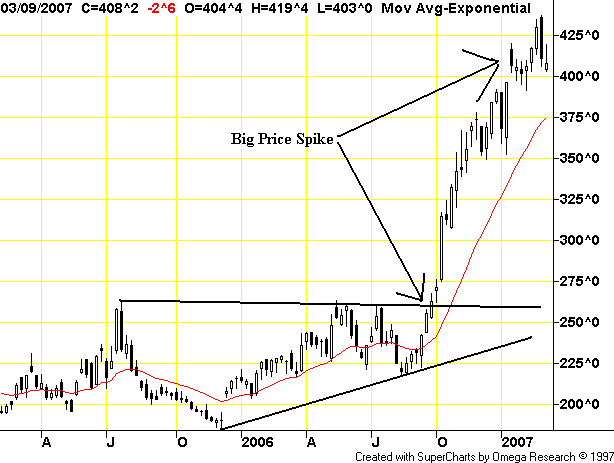
Food increased 1.9%. They rose 1.5% in December and 1.1% in January. In the year before they would occasionally spike 1.1%, but never with gains like we have seen for the past three months. Let's look at some future's charts, because they tell an as-of-yet untold tale. Agricultural prices are spiking.
Weekly Wheat Chart:
Feed Wheat Weekly:
Corn Weekly:
Barley Weekly:
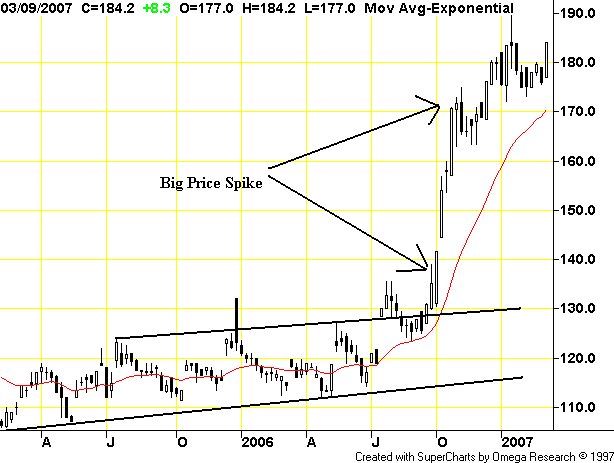
Each of these charts has about 2 1/4 years of information, so we're not looking at seasonal price fluctuations (which futures were originally designed to help ameliorate). We're looking at damn big price moves in agricultural prices. Don't expect the food component of PPI to come down anytime soon.
The Producer Price Index for Finished Goods advanced 1.3 percent in February, seasonally adjusted, the Bureau of Labor Statistics of the U.S.Department of Labor reported today. This increase followed a 0.6-percent decline in January and a 0.9-percent rise in December. At the earlier stages of processing, the intermediate goods index turned up 1.1 percent after falling 0.7 percent in the previous month, and prices for crude goods climbed 8.9 percent following a 6.3-percent decrease in January.
Food increased 1.9%. They rose 1.5% in December and 1.1% in January. In the year before they would occasionally spike 1.1%, but never with gains like we have seen for the past three months. Let's look at some future's charts, because they tell an as-of-yet untold tale. Agricultural prices are spiking.
Weekly Wheat Chart:
Feed Wheat Weekly:
Corn Weekly:
Barley Weekly:
Each of these charts has about 2 1/4 years of information, so we're not looking at seasonal price fluctuations (which futures were originally designed to help ameliorate). We're looking at damn big price moves in agricultural prices. Don't expect the food component of PPI to come down anytime soon.
H&R Block's Mortgage Unit Has More Problems
From the WSJ:
This brings up an interesting point. With all of subprime's current problems, it's natural for vulture investors to come in buying cheap assets; that's the market at work.
But, will subprime companies be able to sell their distressed assets at decent prices? Will the problems in subprime prevent deals from going through?
H&R Block Inc.'s disclosure of more losses on subprime mortgages is stirring up doubts about the planned sale of its home-lending business.
In a quarterly report filed with the Securities and Exchange Commission, the nation's largest tax preparer said it cut the carrying value of certain mortgage assets by an additional $29.2 million at its Option One unit, which, based on market share, ranked third last year among home-loan providers to people with scuffed credit.
H&R Block Chairman and Chief Executive Mark Ernst said "we are progressing as planned" with the anticipated sale of Option One and "remain committed to announce results and further steps by the end of this month." He previously has told analysts and investors that the Kansas City, Mo., company would expect the sale price of the mortgage arm to exceed its book value of $1.3 billion.
But skeptics abound. "It seems hard to believe that they can command anything near the price they are talking about for Option One in this market, if they can sell it at all," said analyst Kathleen Shanley at GimmeCredit, which says investors should "avoid" buying H&R Block bonds.
This brings up an interesting point. With all of subprime's current problems, it's natural for vulture investors to come in buying cheap assets; that's the market at work.
But, will subprime companies be able to sell their distressed assets at decent prices? Will the problems in subprime prevent deals from going through?
Trade Deficit Improves
This report came out a few days ago. But I've been a bit preoccupied with the markets so I'm getting to it now.
From the BEA
So we have some good news and bad news. The bad news is the trade deficit set another record last year, but the good news is it may be decreasing a bit.
OK - let's look at some specifics.
The goods and services press release stated:
Total exports were $114,405 billion in January 2006 and $126,672 in January 2007. Over the same period, total imports were $180,875 and $186,745. Another way to look at this is total exports are about 63% of imports in January 2006 and 68% of total imports in January 2007. That means that exports still have a long way to go before they are at parity with imports. In other words, the decrease is good news, but let's not get too excited.
Here is a report from the San Francisco Federal Reserve from late last summer. The report studied the effects of oil imports on the trade deficit. The reports conclusion was very important:
I think this report was incredibly important because it showed why oil imports are such a big deal from a trade perspective. Without oil imports, the trade deficit would be less by a considerable amount. This is another reason oil prices are so incredibly important to monitor.
So, what do we know now?
1.) The trade deficit is decreasing, although at a slow rate.
2.) Oil prices are a really big factor of the trade deficit.
From the BEA
A drop in oil prices and strong U.S. exports shrank the fourth-quarter deficit to $195.8 billion -- or about 5.8% of gross domestic product -- its smallest in more than a year. That compared with a third-quarter deficit of $229.4 billion.
So we have some good news and bad news. The bad news is the trade deficit set another record last year, but the good news is it may be decreasing a bit.
OK - let's look at some specifics.
The goods and services press release stated:
The U.S. Census Bureau and the U.S. Bureau of Economic Analysis, through the Department of Commerce, announced today that total January exports of $126.7 billion and imports of $185.8 billion resulted in a goods and services deficit of $59.1 billion, compared with $61.5 billion in December, revised. January exports were $1.4 billion more than December exports of $125.3 billion. January imports were $1.0 billion less than December imports of $186.7 billion.
Total exports were $114,405 billion in January 2006 and $126,672 in January 2007. Over the same period, total imports were $180,875 and $186,745. Another way to look at this is total exports are about 63% of imports in January 2006 and 68% of total imports in January 2007. That means that exports still have a long way to go before they are at parity with imports. In other words, the decrease is good news, but let's not get too excited.
Here is a report from the San Francisco Federal Reserve from late last summer. The report studied the effects of oil imports on the trade deficit. The reports conclusion was very important:
Oil prices have almost quadrupled since the beginning of 2002. For an oil-importing country like the U.S., this has substantially increased the cost of petroleum imports. International trade data suggest that this increase has exacerbated the deterioration of the U.S. trade deficit, especially since the second half of 2004. One factor can explain this evolution: The real volume of U.S. petroleum imports has remained essentially constant. One explanation for why the demand for petroleum imports has not declined in response to higher prices comes from a model in which firms are fairly limited in their ability to adjust their use of energy sources, such as oil, in the short term.
I think this report was incredibly important because it showed why oil imports are such a big deal from a trade perspective. Without oil imports, the trade deficit would be less by a considerable amount. This is another reason oil prices are so incredibly important to monitor.
So, what do we know now?
1.) The trade deficit is decreasing, although at a slow rate.
2.) Oil prices are a really big factor of the trade deficit.
Wednesday, March 14, 2007
The Markets Today
What a difference a day makes. The markets were in much better shape today. Here are the SPYs, QQQQs and IWNs.
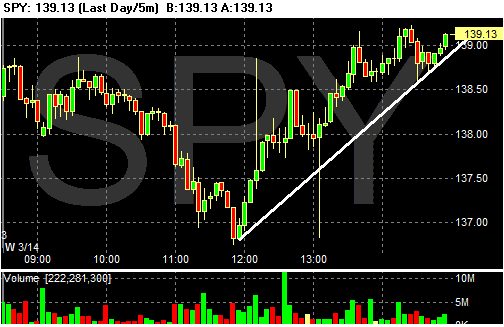
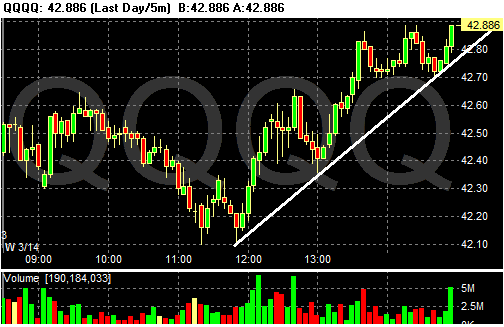
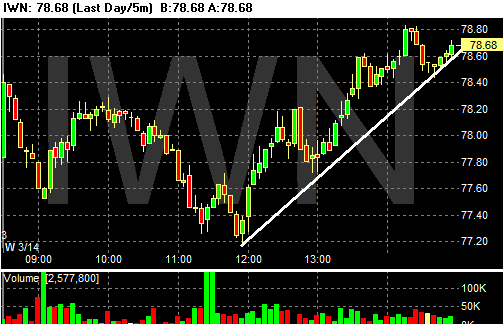
All of the markets started rallying at a bit before noon. All closed at or near their highs for the day. The QQQQs had a nice volume spike at the end.
I will add that today does feel like a technical bounce rather than the start of a new rally. Traders are conditioned to buy on the dips. In addition, no market goes down forever so some rebound is almost always in order after a large sell-off.
All of the markets started rallying at a bit before noon. All closed at or near their highs for the day. The QQQQs had a nice volume spike at the end.
I will add that today does feel like a technical bounce rather than the start of a new rally. Traders are conditioned to buy on the dips. In addition, no market goes down forever so some rebound is almost always in order after a large sell-off.
Import Prices Surprise on the Downside
From the BLS:
The best part of this report was the year over year change. From February 2006 to February 2007 import prices increased 1.3%.
However, take a look at the statements on oil:
Take a look at the chart below on oil. Remember we're going into the summer driving season.
From Bloomberg:
I would add, this is a Fed positive report for now. Oil still remains a wild card in deck.
The U.S. Import Price Index rose 0.2 percent in February, the Bureau of Labor Statistics of the U.S. Department of Labor reported today. The increase followed a 0.9 percent decline in January and was led by an upturn in petroleum prices. The price index for exports increased for the fourth consecutive month, advancing 0.7 percent in February.
The best part of this report was the year over year change. From February 2006 to February 2007 import prices increased 1.3%.
However, take a look at the statements on oil:
Prices for imports increased 0.2 percent in February as a 2.0 percent increase in petroleum prices more than offset a modest decline in nonpetroleum prices. The advance in petroleum prices followed declines in four of the previous five months, and despite the February upturn petroleum prices decreased 2.6 percent over the past year.
Take a look at the chart below on oil. Remember we're going into the summer driving season.
From Bloomberg:
Prices of U.S. imports rose less than forecast in February, held down by lower costs for metals and machinery that may help keep a lid on inflation.
The 0.2 percent increase followed a 0.9 percent drop in January, the Labor Department said today in Washington. Prices excluding petroleum fell 0.1 percent. Separate figures from the Commerce Department showed the current-account deficit shrank last quarter to $195.8 billion.
The cheapest imported business equipment in almost a year is among factors that may make it easier for the Federal Reserve to keep interest rates unchanged. Policy makers will see reports on wholesale and consumer prices in coming days as they prepare for next week's interest-rate meeting.
``This is definitely a Fed-positive report,'' said Ellen Zentner, an economist at Bank of Tokyo-Mitsubishi UFJ Ltd. in New York. ``It supports the case for the Fed to sit tight and continue to watch inflation pressures recede.''
I would add, this is a Fed positive report for now. Oil still remains a wild card in deck.
GM Injects $1 Billion Into GMAC Because of Subprime Mortgages
From Reuters:
Let's look at this in more detail, because it raises some possibly scary issues.
GM sold GMAC. Part of the terms of the agreement said GMAC would be worth a minimum of $14.4 billion. After looking at the books again the curreny book value was obviously below the stated minimum value. To correct the problem, GM injected $1 billion dollars into GMAC.
Think about what that might mean. Does GMAC have $1 billion in losses or possible losses as the result of mortgage issues?
General Motors Corp. (NYSE:GM - News) will inject $1 billion into GMAC, its former finance arm said on Tuesday, a capital infusion needed to complete the sale of the automaker's majority stake in the face of escalating defaults in the U.S. mortgage market.
GMAC, which reported results on Tuesday, said that even after the equity injection from GM, "continuing pressures in the U.S. mortgage sector" would weigh on its future earnings.
Under terms of its sale to a group led by Cerberus Capital Management, GM had guaranteed a minimum book value of $14.4 billion when the sale closed at the end of November.
However, a recalculation of GMAC's book value revealed a shortfall caused by the mortgage losses that GM is now trying to address with the $1 billion cash injection this quarter.
Let's look at this in more detail, because it raises some possibly scary issues.
GM sold GMAC. Part of the terms of the agreement said GMAC would be worth a minimum of $14.4 billion. After looking at the books again the curreny book value was obviously below the stated minimum value. To correct the problem, GM injected $1 billion dollars into GMAC.
Think about what that might mean. Does GMAC have $1 billion in losses or possible losses as the result of mortgage issues?
Oil Market Update
From AFX News:
However, gas prices are still increasing, as shown by this chart from the latest DOE report:
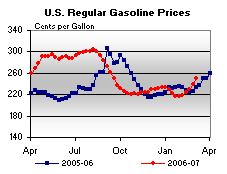
Here's what the DOE said in their latest report:
Note two things. First, they said prices have increased sharply again. Those are two words you don't like to see in front of gas prices. Secondly, prices are higher than they were at this time last year when gas hit $3/gallon and above in some regions.
Here's a chart of oil:
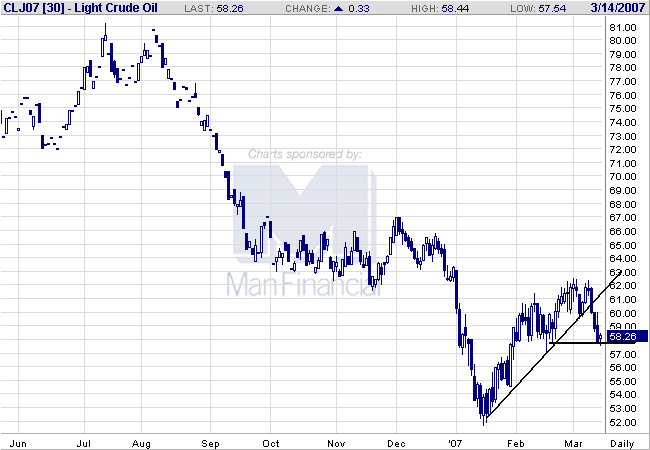
Oil has sold-off and broken its rally that started in mid-January. So far, it appears to be bottoming at roughly $58/bbl.
Let's sum up so far. Crude oil prices are lower now than this time last year (when they were about $66-$70/bbl). However, gasoline prices are higher now than they were last year. What's odd is now we have a higher stockpile of gasoline than we did last year. Here's the chart of gasoline inventories, with last summer marked 1 and the current level marked 2:
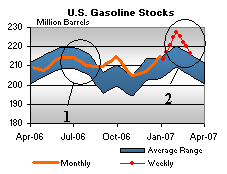
We have more supply now (although it is dropping), but prices are higher. Gas prices may be moving up in response to the drop in inventories and the speed of the drop.
Maybe the issue is the overall oil inventory, which has dropped since the summer peak:
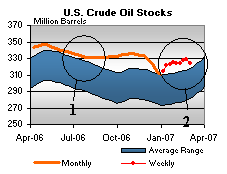
Why all of this talk about oil? In his latest Congressional testimony, Bernanke said inflation was down largely as the result of decreasing energy prices. Therefore, as energy prices increase we can probably expect an uptick in inflation. This will hem the Fed in and prevent them from lowering interest rates if there is a continued economic slowdown.
The US Energy Information Administration said crude oil stocks rose by 1.2 mln barrels in the week ending March 9 to a total of 325.3 mln barrels. The latest figure was in line with analysts' expectations of an increase of 1.3 mln barrels, according to an AFX poll.
However, gas prices are still increasing, as shown by this chart from the latest DOE report:
Here's what the DOE said in their latest report:
Gasoline prices rose sharply again, increasing 12.2 cents to 250.5 cents per gallon for the week of March 5, 2007. Prices are now 17.4 cents per gallon higher than at this time last year. All regions reported price increases. The East Coast had the largest increase, with prices up 15.4 cents to 249.1 cents per gallon. Midwest prices rose 9.5 cents to 246.5 cents per gallon. Prices for the Gulf Coast were up 13.3 cents to 236.7 cents per gallon. Rocky Mountain prices increased 10.4 cents to 235.3 cents per gallon, while prices for the West Coast were up 10.1 cents to 276.5 cents per gallon. California prices were also up 10.1 cents, to 289.7 cents per gallon, 41.7 cents per gallon above last year’s price.
Note two things. First, they said prices have increased sharply again. Those are two words you don't like to see in front of gas prices. Secondly, prices are higher than they were at this time last year when gas hit $3/gallon and above in some regions.
Here's a chart of oil:
Oil has sold-off and broken its rally that started in mid-January. So far, it appears to be bottoming at roughly $58/bbl.
Let's sum up so far. Crude oil prices are lower now than this time last year (when they were about $66-$70/bbl). However, gasoline prices are higher now than they were last year. What's odd is now we have a higher stockpile of gasoline than we did last year. Here's the chart of gasoline inventories, with last summer marked 1 and the current level marked 2:
We have more supply now (although it is dropping), but prices are higher. Gas prices may be moving up in response to the drop in inventories and the speed of the drop.
Maybe the issue is the overall oil inventory, which has dropped since the summer peak:
Why all of this talk about oil? In his latest Congressional testimony, Bernanke said inflation was down largely as the result of decreasing energy prices. Therefore, as energy prices increase we can probably expect an uptick in inflation. This will hem the Fed in and prevent them from lowering interest rates if there is a continued economic slowdown.
Asian Markets Tank
From the WSJ:
I guess we're returning the favor from a few weeks ago.....
Asian-Pacific markets fell sharply Wednesday in the wake of a sharp sell-off on Wall Street, with Japan's benchmark index falling 2.92% with exporters retreating as the yen strengthened against major currencies.
I guess we're returning the favor from a few weeks ago.....
Subscribe to:
Posts (Atom)