Go and do something else aside from economics and market watching.
I'll be back tomorrow afternoon.
Saturday, March 10, 2007
Friday, March 9, 2007
The Markets Today
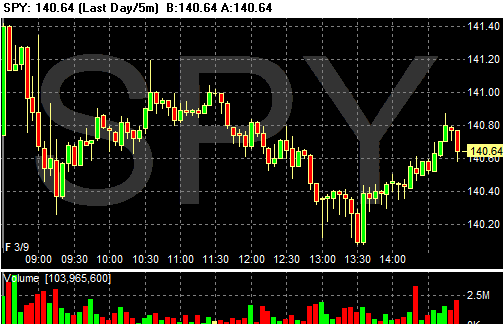
SPY: -.01%
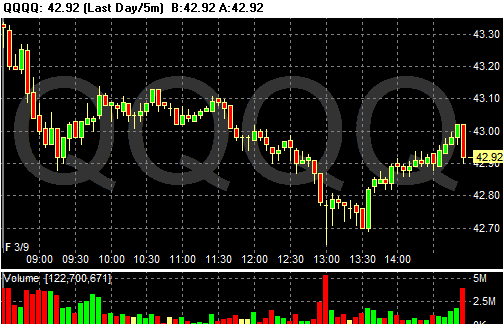
QQQQ: +.05%
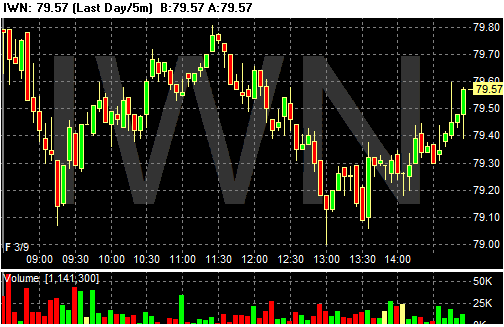
IWN: +.48%
Translation: money flowed into the small cap market today. Everybody else was scratching their heads.
Looking at the charts, we have a lot of meandering in the SPYs and QQQQs. They opened higher, dropped, moved around, sold-off then rallied. The IWNs at least closed higher.
QQQQ: +.05%
IWN: +.48%
Translation: money flowed into the small cap market today. Everybody else was scratching their heads.
Looking at the charts, we have a lot of meandering in the SPYs and QQQQs. They opened higher, dropped, moved around, sold-off then rallied. The IWNs at least closed higher.


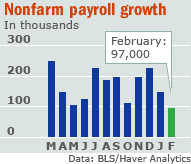
Payrolls + 97,000
First a disclaimer. The BLS has revised this number a great deal. Recently they reported they added an additional 800,000 jobs to the 2006 totals. Clearly their current model is pretty flawed.
In today's report we learn the BLS found an additional 35,000 jobs in January with their upward revision for the month.
Be that as it may....
Here's a link to the report.
Construction lost 62,000. The housing slowdown is starting to hit employment numbers. I would expect this number to continually worsen over the next year as the housing slowdown starts to bleed into the rest of the economy.
Here's how the BLS reported it:
The rest of the gains were split between professional, business and leisure jobs.
While total private hourly earnings increased 6 cents, hours worked decreased by .1%. Decreased hours usually makes increased wages a wash.
The last few employment reports have all showed a slowing economy -- even with the subsequent revisions. This report clearly falls within that as well. In addition, we're seeing housing really hit employment. Earlier this month housing starts dropped 16%. That means housing related employment will one decrease further.
Here's a chart from CBS Marketwatch of the last year of job growth:
In today's report we learn the BLS found an additional 35,000 jobs in January with their upward revision for the month.
Be that as it may....
Here's a link to the report.
Construction lost 62,000. The housing slowdown is starting to hit employment numbers. I would expect this number to continually worsen over the next year as the housing slowdown starts to bleed into the rest of the economy.
Here's how the BLS reported it:
In the goods-producing sector, construction employment fell by 62,000 in February after posting a gain of 28,000 in January. Unusually severe winter weather conditions in some areas of the country in February likely contributed to job losses in the industry. Employment declined in both residential (-21,000) and nonresidential (-25,000) specialty trades, and heavy construction lost 10,000 jobs. Employment in residential specialty trades has been declining since February 2006.
Manufacturing employment continued to trend down over the month (-14,000). Job losses occurred in wood products (-4,000), semiconductors and electronic components (-3,000), and textile mills (-3,000). Machinery added 5,000 jobs in February. In mining, employment rose by 4,000.
The rest of the gains were split between professional, business and leisure jobs.
While total private hourly earnings increased 6 cents, hours worked decreased by .1%. Decreased hours usually makes increased wages a wash.
In the service-providing sector, health care employment rose by 33,000 in February, as job growth continued throughout the component industries. Over the year, health care employment has increased by 340,000.
Employment in professional and business services continued to trend up in February (+29,000) with small gains occurring in most of its component industries. Over the past 12 months, this industry has added 460,000 jobs. In February, employment in services to buildings and dwellings grew by 11,000. Temporary help services employment was little changed over the month and over the year.
Elsewhere in the service-providing sector, food services and drinking places added 21,000 jobs in February. Over the year, food services employment has risen by 348,000. Employment in the information industry was up by 13,000 in February. Within financial activities, depository credit intermediation added 4,000 jobs. Over the month, employment was essentially unchanged in both wholesale and retail trade. Air transportation lost 7,000 jobs.
The last few employment reports have all showed a slowing economy -- even with the subsequent revisions. This report clearly falls within that as well. In addition, we're seeing housing really hit employment. Earlier this month housing starts dropped 16%. That means housing related employment will one decrease further.
Here's a chart from CBS Marketwatch of the last year of job growth:
New Century Financial Stops Making Loans
From the WSJ:
I doubt this will be the last we will hear of New Century Financial or the subprime market.
In the clearest sign yet of how rapidly funding is vanishing for the risky loans that helped fuel the housing boom, nervous creditors forced New Century Financial Corp., the nation's second-largest subprime mortgage lender, to stop making new loans.
The Irvine, Calif., company, which has been plagued by rising defaults on its subprime mortgage loans -- home loans made to borrowers with weak credit -- said it has been in talks with its creditors to "identify ways to address their concerns" and obtain more funds in the near term. But it added that "there can be no assurance that these efforts will succeed."
Yesterday, people close to the matter said New Century got fresh financing from one of its biggest creditors, investment bank Morgan Stanley. Even so, the company's mounting woes intensified speculation that it may be forced to file for protection from creditors under Chapter 11 of the federal Bankruptcy Code unless it can find a suitor or sell assets soon.
I doubt this will be the last we will hear of New Century Financial or the subprime market.
Subprime Problems May Increase Housing Inventory
From Bloomberg:
Existing housing inventory is one of the reasons I have been bearish on the housing market.
Housing inventory is expressed as "months available for sale given current sales rates." Another way to put this is "how many months would it take to clear existing inventory at current sales rates?" According to the Census Bureau there are currently enough new homes on the market for 6.8 months of sales at the current sales rate. This number has jumped around between 5.2 and 6.8 for the last year. Eyeballing the numbers, it looks like the lower 6s is about the median.
According to the National Association of Realtors there were 3.549 million existing homes on the market in January or 6.6 months of inventory. An increase of 500,000 would increase that level to a little over 4 million. Those totals won't come onto the market all at once. Instead, they will come onto the market gradually, which will make clearing existing inventory that much more difficult.
Rising mortgage defaults by subprime borrowers may add more than 500,000 homes to a residential real estate market already beset by slumping prices, according to CreditSights Inc.
In January, 4.09 million new and existing homes were offered for sale, down from 4.43 million in July 2006, the National Association of Realtors and the U.S. Commerce Department said. New homes accounted for 536,000 of the January total, down from a record 573,000 in July.
A five-year housing boom that ended a year ago was fueled in part by the growth of mortgage products marketed to borrowers with poor credit histories. Now, as defaults on subprime loans surge to a seven-year high, more than 20 lenders have closed or sought buyers since the start of 2006. The survivors are raising their lending standards.
``We estimate that the effect of looser lending standards could translate into another 533,000 homes coming onto the market as borrowers default -- an unwelcome phenomenon given the existing supply surplus,'' Sarah Rowin and Frank Lee of bond research firm CreditSights wrote in a March 1 report.
Existing housing inventory is one of the reasons I have been bearish on the housing market.
Housing inventory is expressed as "months available for sale given current sales rates." Another way to put this is "how many months would it take to clear existing inventory at current sales rates?" According to the Census Bureau there are currently enough new homes on the market for 6.8 months of sales at the current sales rate. This number has jumped around between 5.2 and 6.8 for the last year. Eyeballing the numbers, it looks like the lower 6s is about the median.
According to the National Association of Realtors there were 3.549 million existing homes on the market in January or 6.6 months of inventory. An increase of 500,000 would increase that level to a little over 4 million. Those totals won't come onto the market all at once. Instead, they will come onto the market gradually, which will make clearing existing inventory that much more difficult.
More on Retail Sales
This is a graph from Investors Business Daily
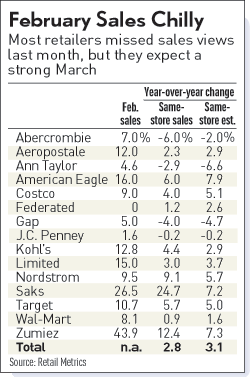
Note that sales are still growing, but they are coming in below where analysts thought they were.
Here's the salient points from IBD:
Also, read The Big Pictures hilarious take on the recent news in retail sales.
Note that sales are still growing, but they are coming in below where analysts thought they were.
Here's the salient points from IBD:
February's soft showing came in the wake of solid January sales gains, lifted by a late month cold snap. As a result, retailers entered February with much of their winter goods cleared — and well stocked for spring.
But when the cold hit, shoppers didn't want spring apparel and couldn't find coats or sweaters.
"In February the last thing you wanted to buy was a spring outfit," Perkins said. "And if you were going to buy for now there wasn't much in the stores."
The month's adverse weather held down February same-store sales by at least half a percentage point, said Michael Niemira, chief economist at the International Council of Shopping Centers.
Because February typically has the year's second lowest sales volume behind January, one shouldn't extrapolate too much from the month's results, he said.
Also, read The Big Pictures hilarious take on the recent news in retail sales.
Thursday, March 8, 2007
Daily Market Charts
Because the employment report is so important right now, I think it's a good idea to get a look at the daily market charts before the news release. I think they all say pretty much the same thing, so here they are in the following order: SPYs, QQQQs IWNs
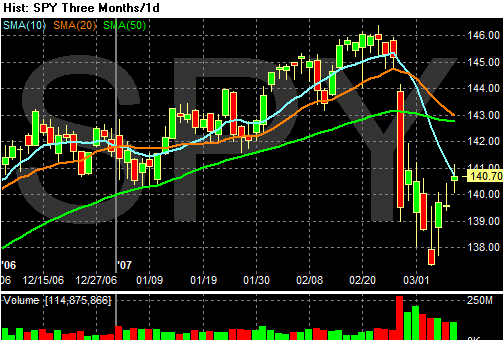
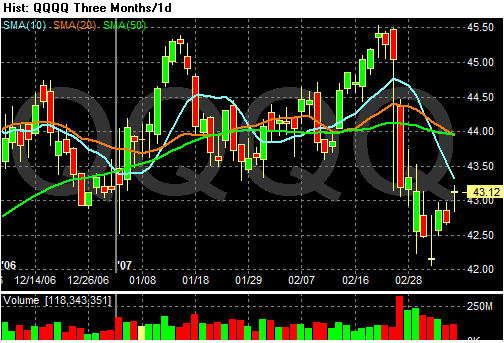
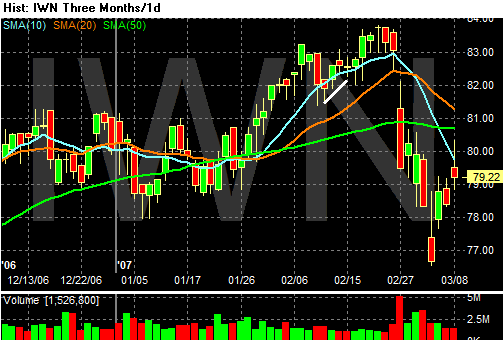
We had the big down day, followed be a slightly less pronounced decline. All three charts have a classic candlestick hammer style bottom. While we had a relief rally over the last few sessions, notice it's been on declining volume. In addition, the candle bars of the rally are weak -- the open and closes are very close. All of these factors can signal the rally is losing steam and traders are looking for a reason to sell. In addition, all three averages are approaching their respective 10-day moving averages, which could be a resistance line for all three.
Again, this is not set in stone. We're simply trying to play the averages about what could happen.
We had the big down day, followed be a slightly less pronounced decline. All three charts have a classic candlestick hammer style bottom. While we had a relief rally over the last few sessions, notice it's been on declining volume. In addition, the candle bars of the rally are weak -- the open and closes are very close. All of these factors can signal the rally is losing steam and traders are looking for a reason to sell. In addition, all three averages are approaching their respective 10-day moving averages, which could be a resistance line for all three.
Again, this is not set in stone. We're simply trying to play the averages about what could happen.
The Markets Today
The closing price indicates this was a good day -- the SPYs were up .76%, the QQQQs were up .91% and the IWNs were up 1.03%. But we had two big sell-offs -- one during the last half hour of trading. Traders are obviously nervous about tomorrows employment report.
In addition, note how the markets spiked up at the beginning, but couldn't hold onto these gains throughout the day. This further indicates nervousness.
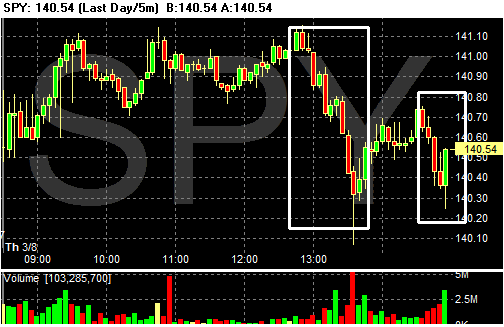
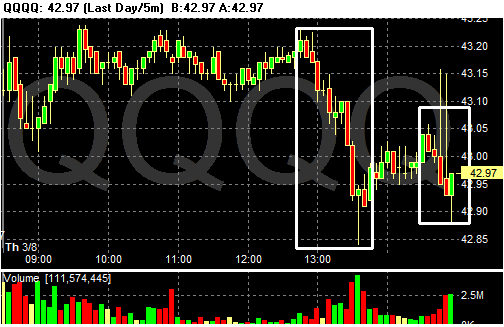
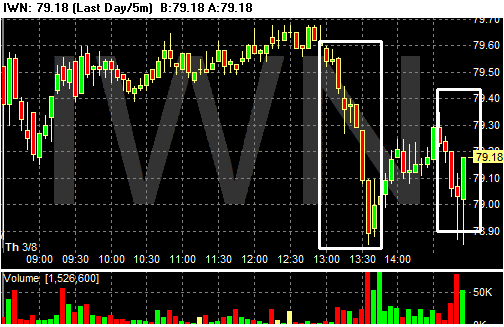
In addition, note how the markets spiked up at the beginning, but couldn't hold onto these gains throughout the day. This further indicates nervousness.
Housing and Employment
Big thanks to Bonddad's girlfriend for this from MSNBC:
I looked at housing and employment about 6 months ago. A conservative reading of job growth puts housing related jobs at about 30% of total growth for this expansion. That's including construction, financial and professional services. In other words, housing is really important to this expansion.
The blog Calculated Risk has estimated that between 200,000 to 400,000 jobs will be lost as housing cools. Additionally, we really haven't started to see the big drop because housing starts are just starting to slow. Business construction may absorb some of these losses, but as of now we don't know how many.
Now the housing slump is hitting yet another target: housing-related jobs, a list that includes everyone from the people who build and sell houses to makers of appliances and furnishings.
That's a sharp contrast to the height of the housing boom in 2005-06, when the industry was responsible for creating some 25,000 to 50,000 new jobs every month, according to Mark Zandi, chief economist at Moodys.com.
“In the recent months it’s been laying off workers at a pace of 25,000 to 50,000 per month,” he said. “And I think the next couple of quarters we’ll start seeing job losses of between 50,000 and 75,000 per month. ... I think the housing market is going down a whole other notch.”
I looked at housing and employment about 6 months ago. A conservative reading of job growth puts housing related jobs at about 30% of total growth for this expansion. That's including construction, financial and professional services. In other words, housing is really important to this expansion.
The blog Calculated Risk has estimated that between 200,000 to 400,000 jobs will be lost as housing cools. Additionally, we really haven't started to see the big drop because housing starts are just starting to slow. Business construction may absorb some of these losses, but as of now we don't know how many.
Retail Sales Disappoint
From Bloomberg:
This is another piece of bad economic news this week. We had a drop in durable goods and productivity and higher labor costs. The Beige Book was slightly optimistic, but noted it had concerns with housing. It also said nothing had change on the inflation front, implying rates aren't coming down anytime soon.
While this report isn't horrible because sales are still positive, its weakness may imply the consumer is slowing down his retail purchases.
The coldest February since 1979 caused U.S. retailers' sales to grow at the slowest pace in 11 months as consumers delayed purchases of spring merchandise.
Wal-Mart Stores Inc., the world's biggest retailer, said sales at stores open at least 12 months rose 0.9 percent, less than the company's forecast of 1 percent to 2 percent. Luxury stores and retailers with designer clothes, including Target Corp., the second-largest U.S. discount chain, fared better, with sales surpassing analysts' estimates.
Total U.S. same-store sales rose 2.4 percent, the smallest gain since March 2006, the International Council of Shopping Centers said based on results from 51 retailers. The majority of retailers missed estimates after cold weather cut demand for shorts, dresses and spring merchandise, while a snowy Valentine's Day in the U.S. Northeast kept some shoppers home.
``We hate to hear weather as an excuse, but I think it was pretty legitimate this month,'' said Lori Wachs, who helps manage $100 billion at Philadelphia-based Delaware Investments, including retail shares. Retailers ``are going to have a lot of ground to make up in March.''
This is another piece of bad economic news this week. We had a drop in durable goods and productivity and higher labor costs. The Beige Book was slightly optimistic, but noted it had concerns with housing. It also said nothing had change on the inflation front, implying rates aren't coming down anytime soon.
While this report isn't horrible because sales are still positive, its weakness may imply the consumer is slowing down his retail purchases.
Memo to Employers: Lose the Second Yacht
 | |
| Why is Pace University making it so hard for Chris Williams to get a union contract? |
On March 1, the House voted 241–185 for the Employee Free Choice Act, which would establish stronger penalties for violation of employee rights when workers seek to form a union and during first-contract negotiations. It also would allow employees to form unions through a majority verification process, in which workers sign cards to indicate their support for a union.
In attacking the bill, Big Business has misleadingly insisted it would take away the secret ballot election process by which workers now form unions. But that argument is a red herring. First of all, Employee Free Choice Act doesn’t take away the secret ballot process. Workers will have a choice between the ballot process and majority verification.
Second, as currently run by the nation’s labor board, this management-controlled election process is anything but democratic. The long, drawn-out process gives management plenty of time to harass and intimidate workers—and let’s face it, how many people want to join a union if their employer threatens to fire them (which 25 percent of private-sector employers do, even though it is illegal)?
Former Labor Secretary Robert Reich puts it this way:
A secret ballot sounds democratic, but workplaces aren’t democracies because employers have the power to hire and fire. That's where the potential for intimidation lies. And the only way around it is to go with a simple up-or-down vote.There are many examples of how the so-called “election process” doesn’t work. Chris Williams, an adjunct physics professor at Pace University in New Jersey, shared his story with us at the AFL-CIO. In December 2003, Williams and a majority of his co-workers signed authorization cards saying they wanted to be represented by New York State United Teachers/AFT (NYSUT/AFT). Pace University's administration then went to enormous lengths to block them from winning recognition and a contract. (A majority of workers can sign authorization cards now—but employers are not required to recognize the union. The Employee Free Choice Act would fix that.) Why would Williams, a well-educated professional, want to join a union? Says Williams:
I would starve to death if I had to rely on my wages from Pace. I'd be homeless. The average pay for an adjunct for a three-credit course is just $2,500 for a 15-week course.While a tenured professor might earn $100,000 per year, an adjunct faculty member in the next classroom with the same qualifications would earn subsistence pay of only $15,000 for the equivalent of a full-time workload. (What was that again from the Bush administration about lack of education behind the nation’s low-wage economy? We’ll address that canard in a future post.)
The adjunct faculty then tried the election process route of the National Labor Relations Board (NLRB). First, the university tried to delay the election. Then, after the election was held in spring 2004 and the adjunct faculty voted overwhelmingly for the union, the university came up with a bizarre legal argument that hundreds of adjunct faculty members should be excluded from the bargaining unit. It actually refused to include them in negotiations with the union. The director of NLRB's Region 2 found the disputed adjunct faculty members were part of the bargaining unit, and the five-member NLRB in Washington, D.C., rejected a request by the university to have the region's decision overturned. But even now, Pace is appealing the decision to the federal appeals court. That postpones the adjunct faculty's rights even longer. So a staggering two-and-a-half years of negotiations have passed and the adjunct faculty still has no contract.
That's why Williams, who sees firsthand the flaws in the current system, supports the Employee Free Choice Act, which provides for mediation and then arbitration if managements and unions can't work out a contract in 90 days.
So, given that most businesses are not interested in running their workplaces like a democracy (“How many people want a four-week vacation? Raise your hands”), we thinketh they doth protest too much that the bill would take away this nonexistent freedom.
Business interests also say workers would be “coerced” into joining a union through the majority verification process. That presumes most workers don’t want to join a union. That presumption is wrong. In fact, some 60 million U.S. workers say they would join a union if they could, based on research conducted by Peter D. Hart Research Associates in December 2006.
Commenting on the American Chronicle, Stephen Crockett, co-host of Democratic Talk Radio, points out how employer cries of intimidation are directed in the wrong direction.
The intimidation is almost entirely on the side of the companies. Companies are in a position of power over workers. Co-workers are simply not in a similar power situation. Only the company is really in the kind of power position to intimidate workers.Most critically, the bill is about economic justice: Full-time workers in unions had median weekly earnings of $833 in 2006, compared with $642 for their nonunion counterparts, and are far more likely to have good health and retirement security. In March 2006, 80 percent of union workers in the private sector had jobs with employer-provided health insurance, compared with only 49 percent of nonunion workers. Union workers also are more likely to have retirement and short-term disability benefits.
And its here—in the dollars and cents—we find the real reason for employer opposition to the Employee Free Choice Act. The past two decades have seen an unprecedented growth in compensation only for top executives and a dramatic increase in the ratio between the compensation of executives and their employees. The average CEO made 411 times the salary of the average worker in 2005. That’s up from 42 times in 1980—a tenfold increase. Meanwhile, average worker's pay increased to about $43,000 in 2004 from about $36,000 in 1980, an 0.8 percent a year increase—about 19 percent total increase—in inflation-adjusted terms.
The average CEO of a Standard & Poor's 500 company made $13.51 million in total compensation in 2005, according to an analysis by The Corporate Library. And that's just the annual take. Seems like what CEOs really fear about the Employee Free Choice Act is that by granting their workers family-supporting wages and health care and retirement security, they might have to forgo that second yacht.
Again, Robert Reich:
America's rising economic tide has been lifting executive yachts, but leaving most working people in leaky boats. Workers need more bargaining power. They should be allowed to form a union when a majority of them wants one. As simple as that.
Beige Book is Out
The Federal Reserve Issued the Beige Book yesterday. Here's a link to the report.
Here are some highlights from various news sources:
WSJ:
From CBS Marketwatch:
From Bloomberg:
From Reuters:
I would encourage everybody to read the full report and all of the news articles as they provide some of the best insight into what the Federal Reserve policy makers are thinking.
Here are some highlights from various news sources:
WSJ:
The report found "modest expansion in economic activity" in many districts, including the regions centered on Chicago, Minneapolis and Philadelphia. But some districts noted some slowing, including Dallas, Boston and St. Louis. It also noted continued demand for skilled workers and some pressure to increase wages
From CBS Marketwatch:
Housing markets remained weak, although there were "signs of stabilization" in some areas.
Manufacturing activity was "steady or expanding," despite the weakness in auto- and housing-related production.
Retail sales were said to be growing steadily. Auto sales were sluggish.
Inflation was "little changed." Pay increases were "moderate."
From Bloomberg:
The general tone of the report was upbeat, describing continued growth in retail sales, services and demand for labor. Policy makers are alert for signs of a deeper economic slowdown after last week's global equities rout and reports showing a prolonged decline in housing.
``I still think that the underlying economic fundamentals are conducive to a pickup in growth as we move through 2007 and 2008,'' Chicago Fed President Michael Moskow said today in a speech in Chicago. ``I am not prepared to significantly change my projections.''
From Reuters:
Policy-makers expect the economy to slowly pick up after losing steam in the fourth quarter as housing cooled. The Beige Book nodded to hopes that this sector might finally be on the mend, while softness among manufacturers remained confined to autos and products linked to residential construction.
I would encourage everybody to read the full report and all of the news articles as they provide some of the best insight into what the Federal Reserve policy makers are thinking.
Hedge Funds and Sub-Prime Lenders
From the WSJ:
Live by the subprime, die by the subprime.
Seriously, this highlights an interesting and perhaps difficult problem in the market. Hedge funds don't make any disclosure reports to the SEC. Therefore, we don't know what they are investing in. We also don't know how many hedge funds are investing in the subprime mortgage area or in what concentration.
This means there could be a few more hedge funds out there reeling from the subprime shakeout. This could lead to a wave of redemptions and a ton of problems in the market.
Hedge-fund investors betting on the riskiest home-mortgage loans are learning a difficult lesson: The higher they fly, the further they fall.
Consider the volatility at Second Curve Capital -- a hedge-fund firm run by Thomas Brown, a former Wall Street research analyst -- which recently has been hammered betting on the stocks of "subprime" lenders, which cater to high-risk borrowers.
The two main funds at Second Curve were down 8% and 10% in January -- and at least as much last month. Hedge-fund databases show the funds' losses for February at 12.5% and 14%, though Mr. Brown contends that the performance was comparable to January.
In any case, it is a significant turnabout from 2006, when the Second Curve funds rose nearly 55%. In 2005, Mr. Brown's funds were down 2%, after soaring 60% in 2004. With $600 million under management, Mr. Brown tends to invest in highly concentrated areas of the financial world, accentuating the bumps.
Live by the subprime, die by the subprime.
Seriously, this highlights an interesting and perhaps difficult problem in the market. Hedge funds don't make any disclosure reports to the SEC. Therefore, we don't know what they are investing in. We also don't know how many hedge funds are investing in the subprime mortgage area or in what concentration.
This means there could be a few more hedge funds out there reeling from the subprime shakeout. This could lead to a wave of redemptions and a ton of problems in the market.
Wednesday, March 7, 2007
DR Horton: "2007 Is Going to Suck"
From CNN:
Pretty hard to misinterpret that comment.
"I don't think '08 is going to be a great year, but it's going to be much better than '07," CEO Don Tomnitz told the Citigroup Industrial Manufacturing Conference
He also said: "'07 is going to suck."
D.R. Horton said it may have to make further write-offs to reflect unsold homes or lower land values.
"We may have more impairments coming," Tomnitz said. "We'll know that on a quarter-by-quarter basis."
Pretty hard to misinterpret that comment.
Markets Drop at Close
I've been posting the daily stock charts since the market sold-off last week. After a big sell-off, the daily charts can give us an idea of what traders are thinking about the market and let us know about the overall confidence level in the market.
Today we had a big sell-off in the SPYs and QQQQs at the end of the trading day. This indicates that traders don't want to hold positions overnight. This indicates a lack of confidence -- or at least a return of caution.
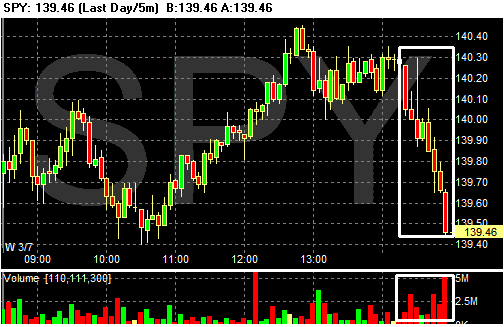
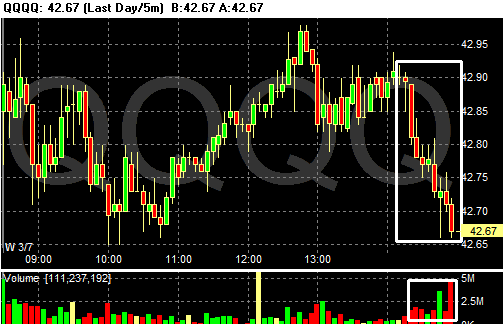
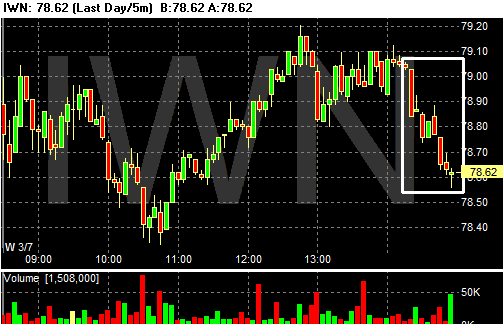
Today we had a big sell-off in the SPYs and QQQQs at the end of the trading day. This indicates that traders don't want to hold positions overnight. This indicates a lack of confidence -- or at least a return of caution.
Oil Inventories Drop; Gas Prices Increase
From CBS Marketwatch:
Looking at the charts from This Week In Petroleum, we see that gas inventories have been dropping for the last few weeks while the oil inventory just dropped this week.
Here's another chart of interest -- gas prices:
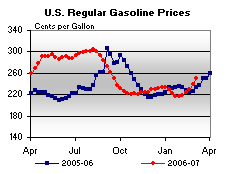
They've been ticking up lately.
Crude-oil futures climbed Wednesday to touch a high of $62 a barrel after U.S. data showed that supplies of crude declined for the first time in three weeks and distillate and gasoline inventories have been falling for several weeks.
"Import dynamics caused surprises in inventory changes," said Jason Schenker, an economist at Wachovia Corp.
"Lower crude and gasoline imports engendered a surprise draw in crude inventories and a larger-than-expected gasoline draw," he said an in e-mailed note to clients. And "the distillate inventory draw was mitigated by increased imports."
Crude for April delivery was last up $1.16 at $61.85 a barrel on the New York Mercantile Exchange, following a climb to as high as $62.
Looking at the charts from This Week In Petroleum, we see that gas inventories have been dropping for the last few weeks while the oil inventory just dropped this week.
Here's another chart of interest -- gas prices:
They've been ticking up lately.
Great New Webpage
I've always like Briefing.com. The link just listed is to a new page that keeps a running tab on up/down volume etc... by the hour. It's a really good page and I'm surprised it took somebody this long to do this.
Homebuilders See Tough Year
From Bloomberg:
We're seeing some very large drops -- 20%+ and 1000 less homes indicates demand is waning. In addition, we still have a ton of inventory on the market at current demand levels that will take awhile to work off.
I thought housing was going to lead the US into recession by the current quarter. However, as the industry still languishes I think the blog Calculated Risk had it right: we're going to see lots of little cuts emerge in the US economy over the coming months. Expect to see declining construction employment, lower mortgage equity withdrawal numbers and lower home construction impacting overall GDP growth.
So far housing's problems have remained in the housing market. Only time will tell if that lasts.
A year after the housing slump began, the spring selling season is off to a rocky start with a glut of unsold properties and buyers like the Binghams putting off purchases, thwarting any chance of a recovery. The National Association of Home Builders in Washington now expects sales to fall for the sixth consecutive quarter after last month predicting a gain. The biggest stock market rout in four years last week, a jump in subprime mortgage failures and concerns about a possible recession are keeping consumers on edge.
....
Builders are bracing for another tough year after seeing 2006 sales plunge 17 percent, the most since 1990. For some, such as Toll Brothers Inc., the largest U.S. builder of luxury homes, the lackluster spring market is a surprise. Chairman and Chief Executive Officer Robert Toll told investors three months ago the market may be poised to rebound. It didn't happen.
``We're all a little more disappointed than we were two weeks ago,'' Toll said Feb. 22 on a conference call, responding to questions about February sales. ``We didn't have anywhere near the bump up that we usually see.''
The same day, Horsham, Pennsylvania-based Toll Brothers cut the number of homes it expects to build to 6,000 to 7,000, the second reduction in four months. In August, the company's estimate was 7,000 to 8,000 homes. Toll Brothers also lowered its fiscal year profit outlook on Feb. 22.
Miami-based Lennar Corp., the biggest U.S. builder by revenue, expects new home deliveries to tumble 20 percent this year. Hovnanian Enterprises Inc. of Red Bank, New Jersey, the industry's sixth-largest company, reported a fiscal first-quarter loss after the number of contracts signed slid 23 percent.
We're seeing some very large drops -- 20%+ and 1000 less homes indicates demand is waning. In addition, we still have a ton of inventory on the market at current demand levels that will take awhile to work off.
I thought housing was going to lead the US into recession by the current quarter. However, as the industry still languishes I think the blog Calculated Risk had it right: we're going to see lots of little cuts emerge in the US economy over the coming months. Expect to see declining construction employment, lower mortgage equity withdrawal numbers and lower home construction impacting overall GDP growth.
So far housing's problems have remained in the housing market. Only time will tell if that lasts.
Oil Market Update
The following paragraph about the oil market caught my eye:
Here's the daily chart of oil:
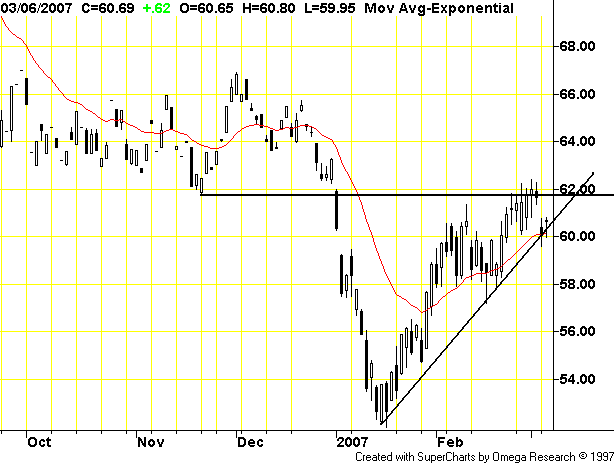
Notice that despite the sell-off this week, the market is still in an uptrend. Because we're close to the current trend-line, this week's action is pretty important from a technical perspective.
However, there are strong fundamental reasons for oil to increase. Once again, remember that we have India and China growing. So long as these economies are making large GDP advances there will be upward pressure on commodity prices. We're also entering the summer driving season in the US, adding further upward pressure.
"There is an expectation that when the equity markets complete the current correction, oil will resume its upward trajectory to test the 65 usd level," noted Harris.
Here's the daily chart of oil:
Notice that despite the sell-off this week, the market is still in an uptrend. Because we're close to the current trend-line, this week's action is pretty important from a technical perspective.
However, there are strong fundamental reasons for oil to increase. Once again, remember that we have India and China growing. So long as these economies are making large GDP advances there will be upward pressure on commodity prices. We're also entering the summer driving season in the US, adding further upward pressure.
Mortgage Risk Premiums Increasing
From the WSJ:
Mortgages are eventually pooled with other mortgages of similar maturity and interest rate and sold to investors. This process is done for all mortgage products. The commercial mortgage backed market is usually considered more secure because businesses are considered more stable than households.
If this market is seeing an increase in its risk premium, other markets must be. That means the cost of issuing and packaging mortgages has gotten more expensive.
Turmoil in the market for bonds backed by home mortgages is starting to infect its commercial cousins: mortgage bonds backed by office towers, hotels and shopping malls.
The cost of insuring commercial-mortgage-backed securities as measured by an index known as the CMBX has jumped since late last month. The spread on the index that tracks riskier, BBB-minus-rated bonds has doubled to 1.64 percentage points this week from 0.84 percentage point on Feb 23, according to Markit Group, which administers the index.
"Moves of this magnitude and speed are uncommon in the unusually calm CMBS markets," noted analysts from Lehman Brothers in a report this week.
Mortgages are eventually pooled with other mortgages of similar maturity and interest rate and sold to investors. This process is done for all mortgage products. The commercial mortgage backed market is usually considered more secure because businesses are considered more stable than households.
If this market is seeing an increase in its risk premium, other markets must be. That means the cost of issuing and packaging mortgages has gotten more expensive.
Subscribe to:
Posts (Atom)