Showing posts with label consumer sentiment.. Show all posts

Tuesday, June 30, 2009

Consumer Confidence Drops


From the Bonference Board:


Consumers' appraisal of present-day conditions was less favorable in June. Those claiming business conditions are "good" decreased to 8.0 percent from 8.8 percent, while those saying conditions are "bad" increased to 45.6 percent from 44.5 percent. Consumers’ assessment of the labor market was also less favorable. Those stating jobs are "hard to get" increased to 44.8 percent from 43.9 percent. Those saying jobs are "plentiful" decreased to 4.5 percent from 5.8 percent.

Consumers' short-term outlook also waned in June. Consumers anticipating an improvement in business conditions over the next six months decreased to 21.2 percent from 22.5 percent, while those expecting conditions will worsen increased to 20.2 percent from 18.0 percent in May.

The job outlook was also more pessimistic. Those anticipating more jobs in the months ahead decreased to 17.4 percent from 19.3 percent, while those anticipating fewer jobs increased to 27.3 percent from 25.6 percent. The proportion of consumers expecting an increase in their incomes declined to 9.8 percent from 10.8 percent.

Notice that within the various sub-categories we have a slight movement from positive to negative. But the move is slight (at least so far). If we have another 2-3 months of data then I'll be concerned. But a reading of the data indicates this is a slight shift as opposed to a majov move.

Friday, June 12, 2009

Consumer Confidence Up


Click for a larger image

From Reuters:

U.S. consumer confidence rose to a nine-month high in June but failed again to surpass its level of September 2008, when the spectacular failure of Lehman Brothers sent the world economy into a tailspin, a survey showed on Friday.

The Reuters/University of Michigan Surveys of Consumers said its preliminary index of confidence for June rose to 69.0 from May's 68.7. That was slightly below economists' expectations of 69.5, according to a Reuters poll.

Worryingly, the report's gauges of inflation expectations rose to their highest in months, creating concern for the Federal Reserve, which has pumped money into the financial system to spur recovery from the worst recession in decades.

For the third month now the overall consumer sentiment reading was at its highest since the Lehman debacle last September, which caused severe strains in financial markets, while not breaking through that month's level of 70.3.


Note the following points:

1.) This is the fourth increase in a row. That's important.

2.) As the article notes, we're still not above last September's level. While I am please to see the increases I will be happier when the number is above previous levels.

3.) The inflation expectation is worrying because it indicates people may start to act on inflation expectations.

However -- and overall -- this is a good report.

Wednesday, May 27, 2009

Consumer Confidence Up

From the Conference Board:

The Conference Board Consumer Confidence Index™, which had improved considerably in April, posted another large gain in May. The Index now stands at 54.9 (1985=100), up from 40.8 in April. The Present Situation Index increased to 28.9 from 25.5 last month. The Expectations Index rose to 72.3 from 51.0 in April.

The Consumer Confidence Survey™ is based on a representative sample of 5,000 U.S. households. The monthly survey is conducted for The Conference Board by TNS. TNS is the world's largest custom research company. The cutoff date for May's preliminary results was May 19th.

Says Lynn Franco, Director of The Conference Board Consumer Research Center: "After two months of significant improvements, the Consumer Confidence Index is now at its highest level in eight months (Sept. 2008, 61.4). Continued gains in the Present Situation Index indicate that current conditions have moderately improved, and growth in the second quarter is likely to be less negative than in the first. Looking ahead, consumers are considerably less pessimistic than they were earlier this year, and expectations are that business conditions, the labor market and incomes will improve in the coming months. While confidence is still weak by historical standards, as far as consumers are concerned, the worst is now behind us."


Here is a chart of the data:


The chart shows a big jump -- although we are still at incredibly low levels. The big question is why? Personally, I think a lot of it is political. Now -- before everybody jumps on the "your full of it" line of attack, consider these two graphs from Pollster.com


Last years election was a nadir of sentiment. People were extremely dissatisfied with the direction the country was taking. Since the election the percentage of people who are happier/more positive about the direction of the country has increased. In addition, the number of people who think the country is on the right track has increased and the number of people who think the country is on the wrong track has decreased. That's what the data says.

Tuesday, June 24, 2008

Today's Economic News ..... Stinks

First, home prices are still dropping:

Home prices in 20 U.S. metropolitan areas fell in April by the most on record, signaling the housing recession is far from over, a private survey showed today.

The S&P/Case-Shiller home-price index dropped 15.3 percent from a year earlier, less than forecast, after a 14.3 percent decline in March. The gauge has fallen every month since January 2007. The group began keeping year-over-year records in 2001.

Mortgage defaults and foreclosures are adding to the glut of properties on the market, while stricter loan rules are making it more difficult for prospective buyers to get financing. The prolonged real-estate slump, along with higher fuel prices and a shrinking job market, is taking a toll on consumers and the economy.

``There's such an excess of inventories that we certainly expect to see more price declines,'' said James O'Sullivan, a senior economist at UBS Securities LLC in Stamford, Connecticut. ``The economy is still weakening and housing still looks pretty weak.''

.....

All of the 20 cities in the index showed a year-over-year decrease in prices for April, led by a 27 percent drop in both Las Vegas and Miami. Charlotte, North Carolina, showed a decline for the first time.

One bright spot in the report was that more cities showed a gain in prices in April compared with the previous month. Houses in eight areas rose in value, compared with just two in March. Month-over-month gains were led by Cleveland and Dallas.

``There might be some regional pockets of improvement, but on an annual basis the overall numbers continue to decline,'' David Blitzer, chairman of the index committee at S&P, said in a statement.


This index has been dropping for a year and a half. That's called a trend. And it's not a good trend.

In addition, this isn't going to end anytime soon. Inventory is still sky high and consumer demand is still hampered by massive debt and low confidence.

Speaking of which...

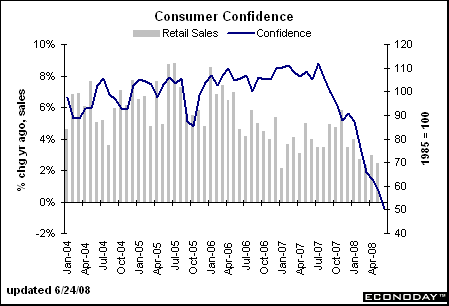
Confidence among Americans dropped to the lowest level in 16 years and house prices fell the most on record, raising the risk that consumers will cut back on purchases after spending their tax rebates.

The Conference Board's confidence index fell to 50.4 in June, lower than forecast, from 57.2 in May. Home prices in 20 cities dropped 15.3 percent in April from a year earlier, according to S&P/Case-Shiller, the most since the group began collecting data.

Consumers, whose spending accounts for more than two thirds of gross domestic product, are being hurt by the housing slump, rising unemployment and higher food and fuel bills.


Short version: this is bad news all the way around. Period.

Monday, February 25, 2008

Consumers Face Strong Headwinds

Consumer spending accounts for about 70% of overall US economic growth. Therefore, the consumer's health is vitally important to further expansion. However, the consumer is under tremendous pressure right now from a variety of fronts. Consider the following:

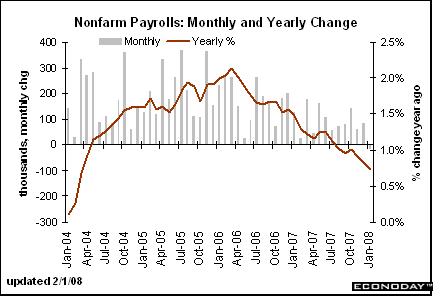
Decreasing Job Growth


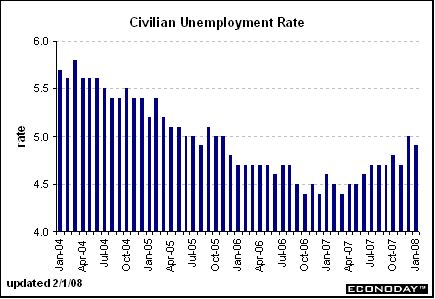
The chart above has the year over year percentage change in employment growth graphed as a line. Notice it has been dropping since the end of the 1Q2006. Also note the gray lines -- which represent the monthly payroll change -- have been decreasing in size as well, indicating the monthly change in payrolls is decreasing. As a result, the unemployment rate is ticking up (although it is still at solid levels).


Decreasing Home Values


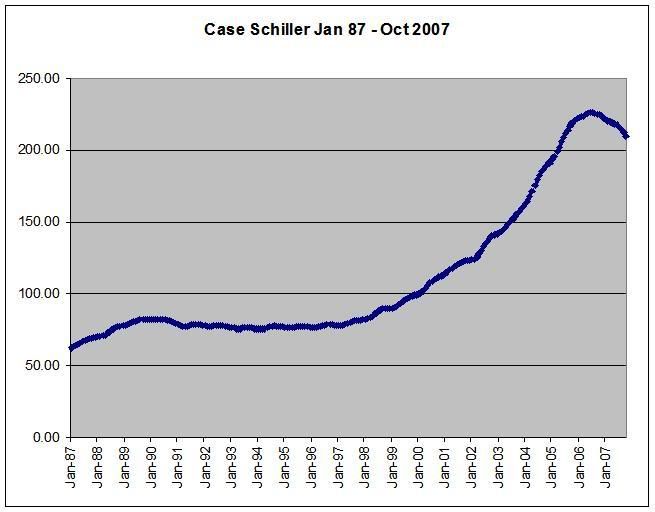
The chart above is the Case-Schiller home price chart. Notice the following:

-- During the last expansion home prices were very stable.

-- Home prices double in the first 6 years of the 2000s.

-- Home prices are now dropping:

That comes on top of the hit homeowners are taking from the drop in housing prices, which fell 7.7 percent in 20 metropolitan areas during November from a year earlier, according to the S&P/Case-Shiller price index.


Inflationary Pressures

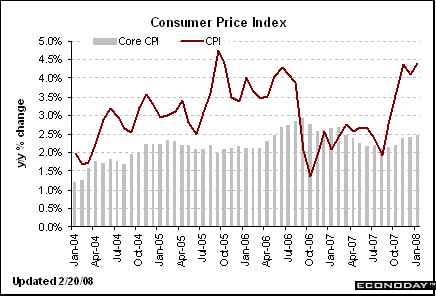
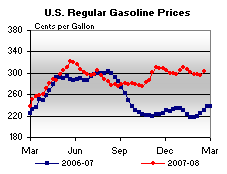
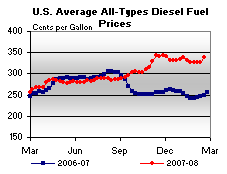
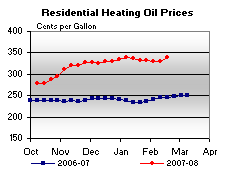
Consumers are seeing high price increases:


Above is the year over year percentage change in inflation.

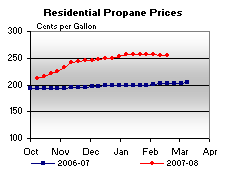
In addition, here are some charts of fuel prices from This Week in Petroleum


A Ton of Debt


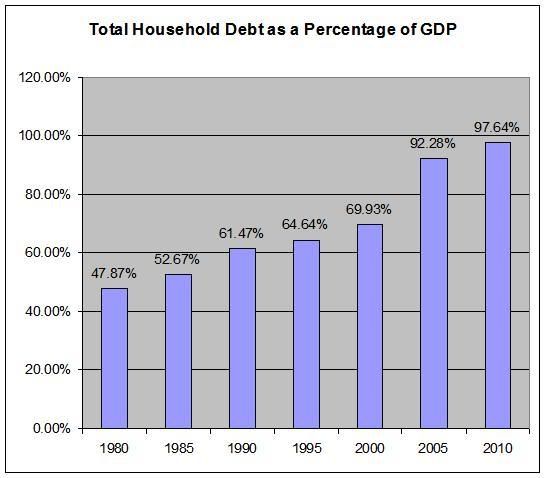
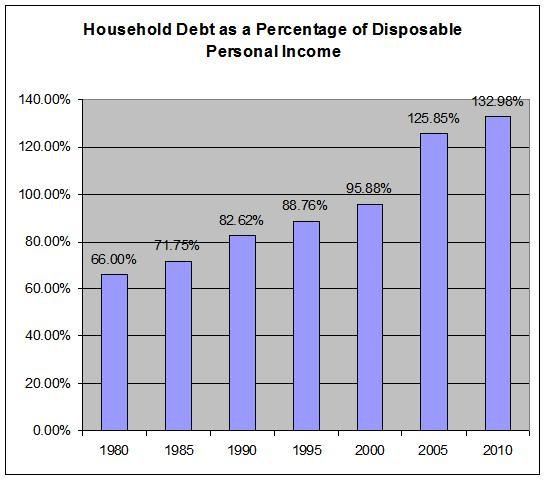
Above are two charts. They use the total outstanding household debt number for the Federal Reserve's Flow of Funds and information on GDP and disposable personal income from the Bureau of Economic Analysis.

There is no economic magic line which says, "over this line is a bad amount of total household debt and below this line is good household debt." It's really more of a sliding scale. Notice that the total household debt number has been increasing for thirty years. At some point, that will start to cause problems.

I have no idea how much stress is too much for the consumer. However, the facts above indicate he is under a tremendous amount of stress right now.

-- Job growth is dropping,

-- Home values are dropping,

-- Inflationary pressures are increasing and

-- He has a ton of debt to deal with.

Charts are from Economday

Thursday, April 19, 2007

US PC sales "sluggish"

From IBD:

The April index reading is almost 20% below the year-ago figure, and is 21% below the 12-month average.

Worse yet for the major PC makers — including Dell, (DELL) Hewlett-Packard, (HPQ) Apple (AAPL) and Gateway (GTW) — demand among some key customer groups has plummeted.

Planned PC purchases among parents sunk 32% in April from March. The purchase intent score for parents is at its lowest level since TechnoMetrica started measuring home PC purchase intent in April 2002.

Also hitting new lows for PC purchase intent were households with incomes over $75,000 and people with graduate or professional degrees. These groups are more likely to buy higher-end, feature-rich PCs, which carry higher prices and profits for PC makers, Kambanis says.

On a positive note, PC purchase intent among people 18 to 24 years old is at its highest level since the poll started five years ago.


IBD included this article so investors could get an idea of whether or not computer makers would be an attractive long of short. However, this information also gives us an idea of consumer sentiment going forward.

Retail sales are the only economic area holding the economy up. Because computers are a pricier item (with laptops still costing about $1000 per), consumer intent to purchase or not purchase these items gives us a clue for how confident consumers are going forward.

The drop in this number indicates consumers may not be that confident going forward. There could be a lot of non-income based reasons for this: Vista is unproven, it's too early to purchase for the fall semester etc... However, this number could also indicate consumers are either strapped financially or at least are pulling in their spending habits a bit.