- by New Deal democrat
June’s new home sales, and Apartment List’s Rent Report, this morning rounded out our view of this important leading sector through June.
New single family home sales are the most leading of all the government housing reports, but they are very noisy and heavily revised. That was on full display this morning, as the original spike higher in May to 763,000 units was revised sharply lower to 715:000. June’s initial number came in lower than that at 697,000:
I’m showing the last 30 years in the above graph because, while we’ve made up half of the decline since just before the Fed started raising rates, this remains a very moderate pace of home building when measured over the longer term.
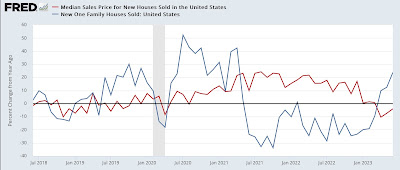
Meanwhile prices (red in the graph below), which follow sales with a lag, are -4.0% lower than they were a year ago:
Prices are not seasonally adjusted, so YoY is the best way to measure. Note that with sales having picked up, we should expect prices to follow suit shortly, ending the anomaly I discussed yesterday of new and existing homes selling for the same median price.
Also, yesterday I neglected to show the updated house price indexes compared with owner’s equivalent rent, so here they are now:
Owners equivalent rent is going to continue to decelerate on a YoY basis, but how soon? In the housing bust, it took three full years (2010 vs. 2007) for OER to follow prices into outright decline.
One clue is that CPI for rent of primary residence (gold in the graph above) was on the same trajectory as OER, turning negative finally with almost the same 3 year lag.
Which brings us to the final update in this post, new apartment rents through June as reported by Apartment List. These rose 0.4% in June, but that is not seasonally adjusted. Compared with pre-pandemic years, it is very low:
So again we need to compare YoY, and here the increase in rents was precisely 0:
This is the lowest since the series’ inception except for the pandemic year.
Because we have a record number of multi-family housing units under construction, there is every reason to believe that this downward trend will continue for awhile. Which means I don’t expect anything like a 3 year delay before the official CPI measure of rents hits 0 as well. And by inference that suggests OER is going to come down a lot faster than it did in 2007-10, when even at peak apartments were being built at less than half the pace they are now.


