- by New Deal democrat
Industrial production is the King of Coincident Indicators. The NBER almost always identifies month of the end, and frequently the beginning, of recessions based on the top and bottom of this statistic. This morning it was reported to have risen for the second month in a row in June. Let’s take a little deeper look.
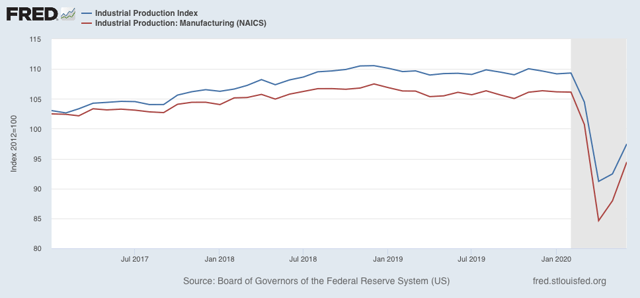
First, here’s the graph of both overall (blue) and manufacturing (red) production since Trump was inaugurated in January 2017:

Both rose by a total of 5% or more until December 2018. In that month both peaked, and both have been in declines since then, first shallow, and then collapsing when the coronavirus hit in March. As of this morning’s report, overall production has regained about 1/3 of its loss since December 2018. Manufacturing has regained about 1/2 of its loss.
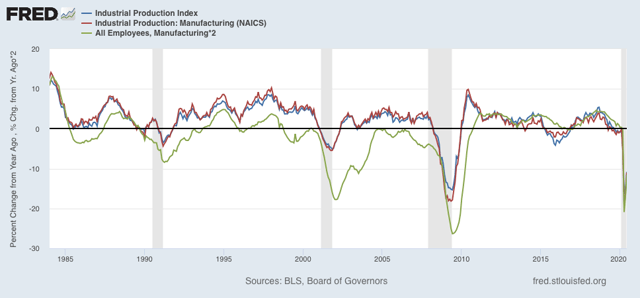
Manufacturing employment (green in the graphs below) has historically followed manufacturing production with a lag of several months. Here’s the long term YoY look since 1984 (employment x2 for scale):

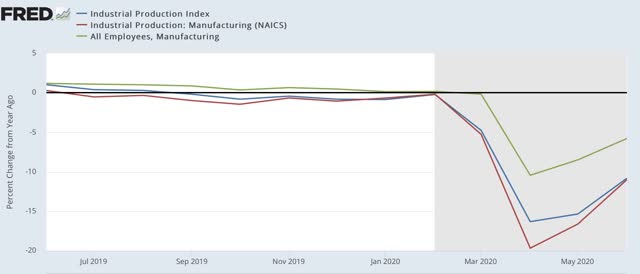
The sudden stop forced on the economy by the pandemic has meant that there has been virtually no lag this year:

But unless manufacturing quickly returns to its February level, I expect that job losses in manufacturing will be more permanent. I.e., employers will not be so quick to rehire all of their laid-off workers.