- by New Deal democrat
Aside from a few sparsely populated rural States and the islands of Hawaii, it’s clear that New York State has by far the best record for a decline in the number of coronavirus cases and deaths, with roughly a 60% decline in new cases in the past 3 weeks.
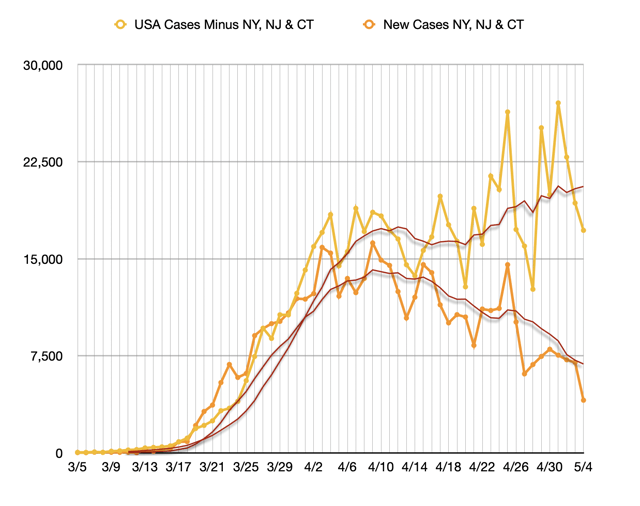
But have the number of new cases outside of NY actually risen? A number of commentators over the past week or so say they have. Here’s a good graph of that metric I saw yesterday:

The above graph indicates that the number of new cases outside of the NY metro area has been rising by about 25% over the past 3 weeks.
Yesterday Nate Silver criticized this line of thought, arguing that it is “penalizing” all those other States for conducting more tests. His point is well taken.
Let me explain below.
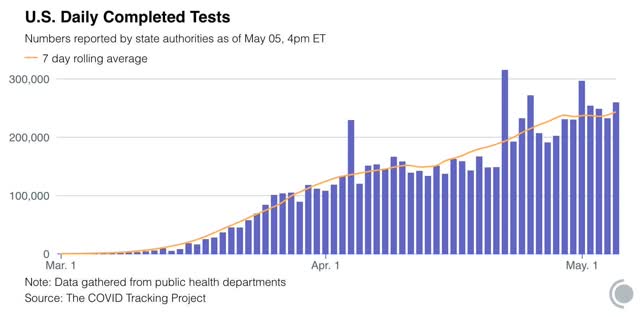
Here is the graph of the number of new tests nationwide from the COVID Tracking Project:

There have been two broad plateaus in the number of tests daily during the past month: April 9 through April 19, at about 135,000/day, and from April 24 to the present, at about 235,000/day. Below I break out, from data from the Tracking Project, tests and positives from NY, the US as a whole, and the US ex-NY for each of those two periods:
Tests:
Date US. NY. US ex-NY
4/9-19 1,487,431 226,006. 1,261,425
4/24-5/4 2,359,197. 276,655. 2,082,542
4/9-19 1,487,431 226,006. 1,261,425
4/24-5/4 2,359,197. 276,655. 2,082,542
%increase: +58.6%. +22.4%. +65.1%
Positive:
Date. US. NY. US ex-NY
4/9-19. 293,337. 82,849. 210,488
4/24-5/4. 276,363. 47,363. 229,000
%in/decrease: -5.8% -42.8%. +8.8%
For both NY and the US as a whole, between the two periods testing has increased strongly, and the absolute number of new cases found by those tests has declined. [Note: Including NJ and CT with NY in the above calculations would not materially change the result. I put them with the rest of the US for ease of calculation.]
When we remove NY from the equation, we find that for the rest of the US, total cases have gone up 8.8%. But the testing that found those new cases went up by 65.1% !
Another way to look at this is that for the US ex-NY, during the period of April 9-19, positive tests were 16.7% of the total (i.e., 210,488/1,261,425). But the additional 821,117 tests only found an additional 19,488 cases, or a rate of 2.4% of the increased total.
This big drop-off, from a 16.7% positivity rate, to a 2.4% positivity rate of the increase, argues very strongly that the big increase in testing is only finding a few new cases. In other words, HAD WE BEEN TESTING AT THE SAME RATE FROM APRIL 9 TO 19, WE WOULD HAVE FOUND MANY MORE CASES THAN REPORTED.
How many? If we had been administering 2,082,542 tests back in mid-April instead of 1,261,425 and had 16.7% positives, we would have found 347,516 total cases, not 210,488, i.e., 66% more than what we actually found then.
But let’s make a more reasonable assumption: that back in mid-April, we were testing only people who really seemed to fit the description of those who were infected, and not even all of them, whereas now we can cast the net wider - which means finding a higher proposition of negative results. Let’s say that, had we been able to test back in mid-April by the amount we are now, the positive rate would have declined by half, from 16.7% positives, to 8.35% positives among just the additional number of tests.
That would give have given us a result of 279,002 positives during April 9-19, rather than the 210,488 we actually found. Comparing that with the 229,000 from April 24-May 4 gives us a decline of -17.9% in cases outside of NY during that time period.
The actual drop-off from 16.7% to 2.4% of positive results among the increased tests was a decline of 85% (i.e., 2.4/16.7). That seems extremely unlikely.
In short, it is very likely that, even leaving out NY, the rest of the US did see a real, and significant, decline in new coronavirus cases from peak in the past 2 weeks. That decline has simply been dwarfed by the much more significant decline of cases in NY.