- by New Deal democrat
Since COVID-19 is a communicable disease, it should hardly be a surprise that the most densely populated States have the most cases per capita, and conversely the least densely States have the least cases. But since that basic point is lost in a lot of the analysis, let’s take a look.
Below are two charts consisting of the 12 most and least densely populated States, their respective population densities, and several measures of coronavirus infections.
The first column gives the rank of the State based on the total number of infections recorded since the start of the pandemic. The second column gives their rank per capita over time since the start of the pandemic. Finally, the third column gives their rank per capita based on infections just over the past week:
| State | Population Density (Per Sq. Mile) | Total # Infections (Rank) | Infections Per capita (Rank) | 1 week Infections Per capita |
|---|---|---|---|---|
| NJ | 1208 | 2 | 2 | 2 |
| RI | 1010 | 21 | 4 | 1 |
| MA | 867 | 3 | 3 | 3 |
| CT | 741 | 9 | 5 | 6 |
| MD | 614 | 12 | 10 | 8 |
| DE | 484 | 33 | 8 | 9 |
| NY | 419 | 1 | 1 | 7 |
| FL | 376 | 8 | 28 | 37 |
| PA | 286 | 6 | 12 | 14 |
| OH | 284 | 14 | 27 | 26 |
| CA | 251 | 5 | 32 | 31 |
| IL | 231 | 4 | 29 | 5 |
On a per capita basis, the data closely fits these States ranks in population density, with three noteworthy outliers: Florida, Ohio, and California. Florida has been rumored to have been massaging their data, but those issues do not pertain to the other two.
| State | Population Density (Sq. Mile) | Total # Infections (Rank) | Infections Per capita (Rank) | 1 week Infections Per capita |
|---|---|---|---|---|
| OR | 42 | 39 | 47 | 45 |
| UT | 36 | 35 | 30 | 29 |
| KS | 36 | 31 | 22 | 11 |
| NV | 26 | 34 | 26 | 35 |
| NE | 25 | 30 | 13 | 4 |
| ID | 20 | 41 | 41 | 44 |
| NM | 17 | 40 | 23 | 19 |
| SD | 11 | 40 | 16 | 23 |
| ND | 11 | 43 | 31 | 25 |
| MT | 7 | 49 | 50 | 50 |
| WY | 6 | 47 | 43 | 41 |
| AK | 1 | 50 | 48 | 48 |
Among the most sparsely populated States, only four are ranked in the top half of States in infections per capita since the outset of the pandemic (Kansas, Nebraska, New Mexico, and South Dakota). A fifth State joins those four among the States with the most infections in the past week (North Dakota). Nebraska in particular is a very poor outlier.
{By the way, the State ranked 49th in per capita number of infections, both over time and in the last week, is Hawaii, which is the 13th most densely populated State but has the obvious advantage of consisting of islands!}.
As I’ve already suggested, Alaska, Hawaii, Wyoming, Montana, and perhaps Idaho are States that could implement a regimen of testing, tracing, and isolating to maintain a containment of the virus. They are 4 of the 11 States that have had less than 10 deaths per day from the virus.
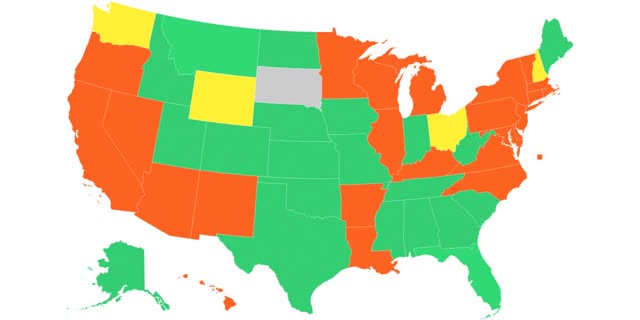
By contrast, Nebraska, Kansas, and Iowa (#9 for per capita infections in the past week) are among the States that have lifted their “stay at home” orders, as shown on the map below:

The main takeaway is simply how hard it is to prevent this virus from spreading in a densely populated area without a strictly adhered to program of quarantining and mask-wearing (as, e.g., performed in Taiwan and Hong Kong). Even New York, which has made the most dramatic progress, has only fallen to #7 in new infections per capita in the last week.