- by New Deal democrat
I don’t normally pay much attention to the new factory orders report, because it is simply too noisy to be of much use. But as of February’s report, released yesterday and showing a -0.1% decline in “core” new orders, there is enough to at least take notice.
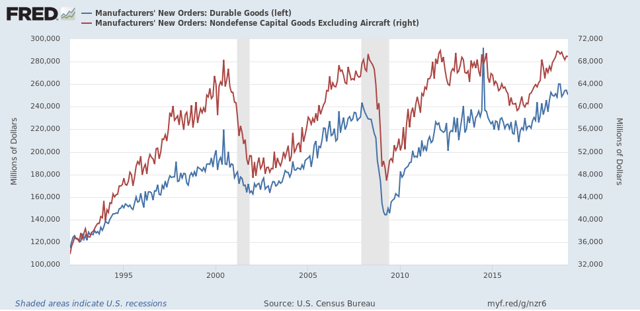
Here are overall new factory orders (blue, left scale) and “core” new orders (red, right scale) for the past 25 years:

In the first place, while they clearly turned down in advance of the 2001 recession, which was a producer-led recession, that wasn’t the case at all, especially for “core” new orders, in the 2008 recession, which was consumer-led. Further, there is so much monthly noise that monthly readings don’t give you reliable signal until the turn is well underway.
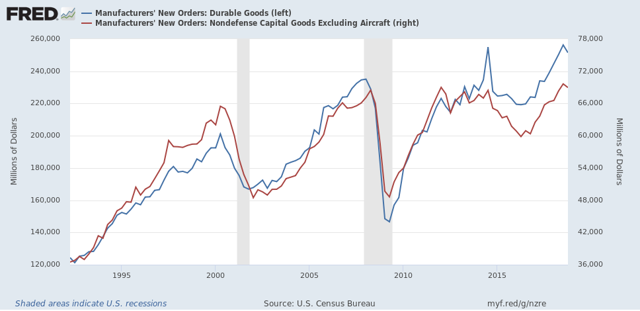
To tease out more signal from noise, here is the same data as above, but on a quarterly basis (note since March data hasn’t been released yet, this ends with Q4 2018):

Much less noisy, but even here a one quarter downturn happens often enough in the middle of expansions that it really doesn’t give us helpful information.
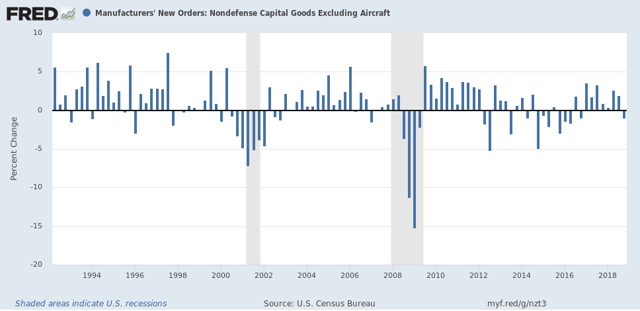
Even two negative quarters in a row, while more helpful, still shows us negative readings in 1998 and 2015-16:

This can tell us that manufacturing is indeed in a downturn, but not enough to reliably forecast a recession.
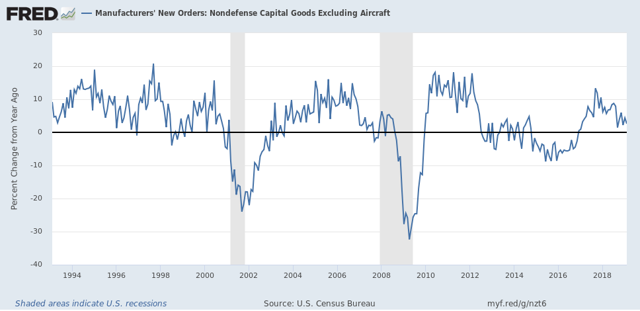
Finally, here is the YoY% change in core new orders:

While a YoY decline for several quarters in a row has occurred before both of the last two recessions, that was also true of 1998 and 2015-16.
That neither overall new orders nor core new orders have made a new high in 6 months as of February, and are likely to be down two quarters in a row once we have March’s data, is certainly evidence of a slowdown in manufacturing. Only in conjunction with indicators from other sectors like construction and consumer spending could we draw any conclusions about an economic slowdown vs. something worse.