First, note how strong the 7-10 year rally is. The uptrend (a) has been in place for nearly three months. The EMAs (b) are incredibly bullish -- all are rising, the shorter are above the longer and prices are above all. The MACD is at worst neutral -- remember -- the line measures the difference between two moving averages. If both continue to move higher at the same rate, the indicator will flatten. The A/D line shows a slight move out of the security, but not in a big way. Simply put, the only thing constricting a rally is yield.


With both the SPYs and the QQQQs, notice that with the exception of one move up and down, prices are remaining in a range. With the SPYs, we're between 105.50 and 110 and with the QQQQs its 43.60 and 46.60.


However, the IWMs and IWCs are still clearly in a downtrend, indicating risk based areas of the market are still considered dicey.

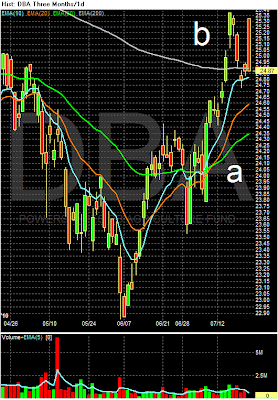
Agricultural prices have clearly broken two major downtrends.

The EMA picture is also bullish (a) -- all the shorter EMAs are rising and prices are above all the EMAs. Also note that prices are using the 200 day EMA as technical support (b).