- by New Deal democrat
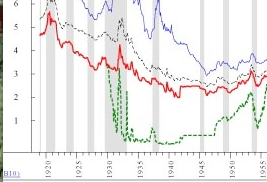
Here is the one and only graph you need to know. It is a portion of a graph was published a couple of years ago. It comes from Ned Davis Research via Andy Bebut a/k/a Theroxylandr at the Wall Street Examiner. Short rates are in green, long rates in red (you can ignore the other lines):

The yield curve has inverted one year before deflation only twice in the last 90 years: in 1928 and in 2007 -- which is why I call that indicator the Death Star. But as you can see, the yield curve remained positive relentlessly from the end of 1929 all the way through the Great Depression, the 1938 Recession, and all of the 1940s. Simply put, a positive yield curve appears to have no leading quality during deflation.
Similarly, indicators based on the spread between short and long rates also appear to have little or no validity during deflations. Hence John Hussman has just touted that whenever the spread between short and long rates is less than 3.1%, a recession ensues. That may have been true in most of the post WW2 era, but Mauldin's indicator completely fails during the New Deal expansion of 1933-37 (the fastest YoY GDP growth ever) , and the entire 1940s.
There is only one Bond measure that I know of that appears to function just about infallibly when it comes to deflations. That is the Dow Jones Bond Index. Almost nobody pays attention to it, but it has been around for 100 years, and here in relevant part is its record:
The DJBI peaked at 99.48 in January 1928. It continued to decline relentlessly until June 1932 when it bottomed at 65.78. Thereafter it rose again until December 1936 when it peaked at 106.01. It declined until March 1938 when it bottomed at 83,39. Thereafter it continued to rise at least until the beginning of WW2 (I haven't researched its behavior in the 1940s).
And what has the Dow Jones Bond Index been doing during the last two years? It started 2008 at 207.14 and put in a low near the end of the year at 181.66. It rose throughout 2009, starting at 207.61 and ending at 246.19, having reached at peak of 249.28 in November. By March of this year it had risen to 250.98. It has continued to rise to 257.68, and as of last Friday it stood at 254.15.