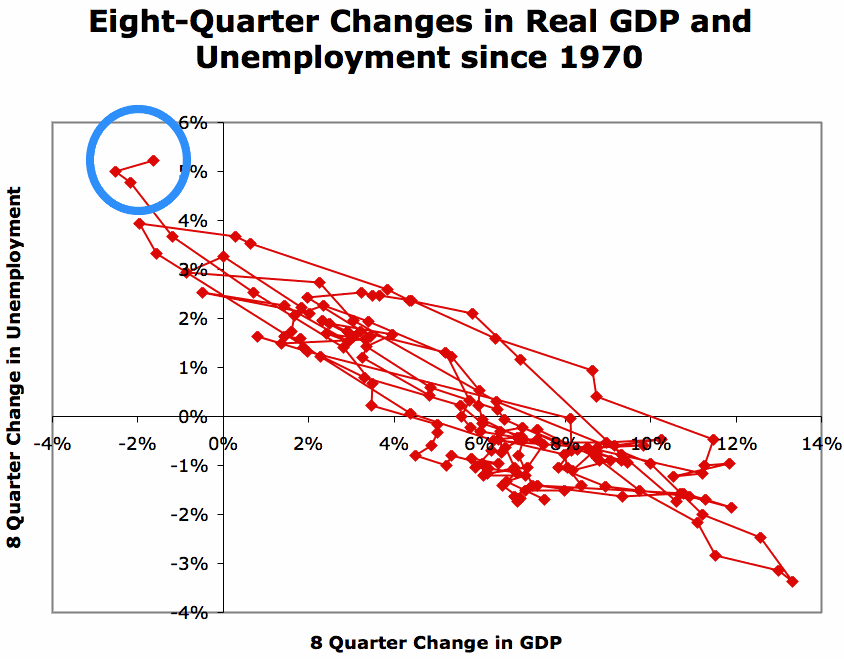
In a post yesterday in response to the Q4 2009 GDP report, Berkeley Prof. Brad DeLong asks, "Where Oh Where Is My Okun's Law?" and includes the following graph:

The circled area to the upper left is the most recent GDP and unemployment rate data which the Professor suggests have broken Okun's law.
In my opinion, the Professor already has the answer at his fingertips. Here is a graph he put together last August purporting to show that"Restricting yourself to post-1995 data seems to make very little difference in Okun's Law":

At that time I suggested to Prof. DeLong that he needed to break out 1995-present from 1948-94, and the change would appear. I suggest now that the most recent data circled by Prof. DeLong in the first graph above shows the following change in the relationship from 1995-present:

The two red dots in the upper left hand corner and the amateurish blue line are mine, and obviously aren't meant to convey mathematical precision, but you get the drift.
I submit that Okun's law still prevails, but the slope of the tradeoff has changed, and the point at which it intersects with a zero change in unemployment has shifted slightly to the right compared with pre-1995 data.
Needless to say, I stand by my posts of earlier this week indicating that if we have another good quarter of GDP growth now (which I regard as baked in the cake per the LEI), we are going to see some job growth.