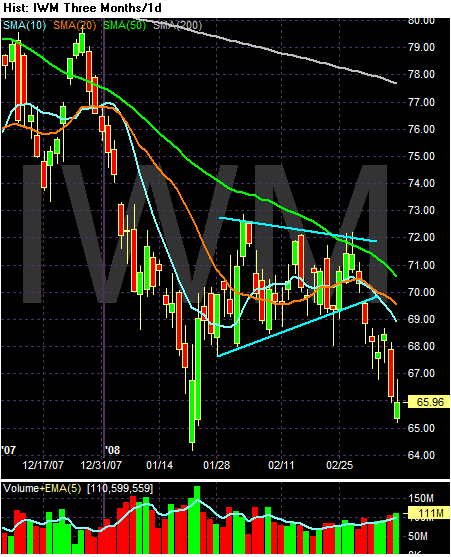
The first index to break the range was the Russell 2000. It fell through the lower support line of a triangle consolidation pattern the week before last. Since then it has continued to move lower. It makes sense for the Russell 2000 to break downside first. The average is composed of smaller companies that are more reliant on a growing economy for their respective earnings.
Also note the following about the SMA picture:
-- All the SMAs are heading lower
-- Prices are below all the SMAs
-- The shorter SMAs are below the longer SMAs
-- However, the 10, 20 and 50 day SMA are still bunched together, indicating all is not lost.
From a technical perspective, there is still support right above 64.

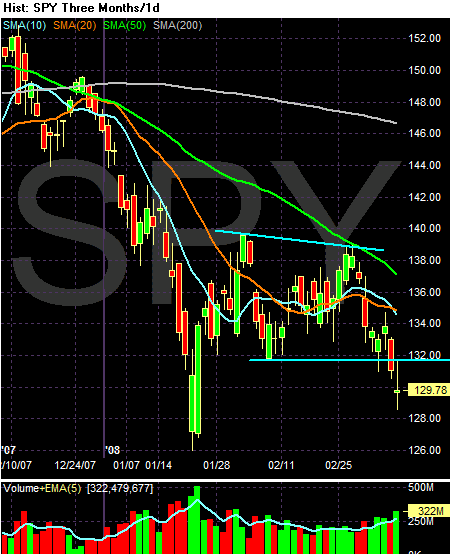
The SPYs broke through downside support on Thursday and continued that trend on Friday. Also note the volume was very high on Friday. But note the candle is a spinning top, which can be a sign of an end to the downside move. From the SMA picture, notice the following:
-- Prices have started to move away from the SMAs. But, the SMAs are still bunched together, indicating some confusion about where prices want to go.
-- The 50 and 200 day SMAs are headed lower.
-- The 10 and 20 day SMAs are still intertwined.

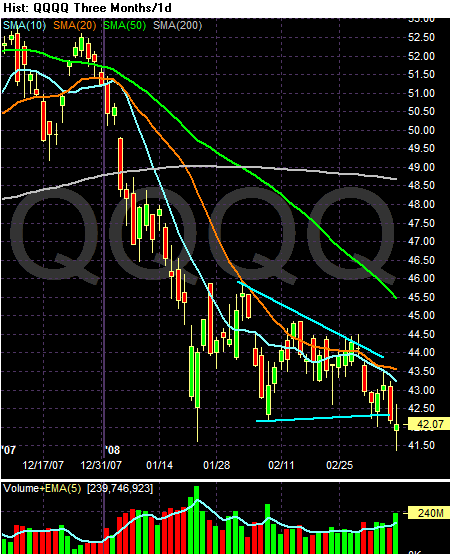
The QQQQs broke through their lower support from a triangle consolidation on Thursday, and they continued that trend on Friday. Also note that volume on Friday was very heavy. However, there is still technical support just above 41.50. From the SMA picture, notice the following:
-- The 10 and 20 day SMAS are still intertwined.
-- The shorter SMAs are below the longer SMAs, although the 10 and 20 day SMAs are extremely close together.
-- The 50 and 200 day SMA are both headed lower.