Over the weekend, Barron's cover story was titled "Is Fannie Mae Toast?" They highlighted some of the accounting issues that Fannie Mae has.
A major scandal erupted at Fannie earlier in the millennium when the company was found to be cooking its books to hide a multibillion-dollar loss it had incurred when massive interest-rate bets went awry. Freddie got nailed at the same time for setting hedging profits aside in a cookie jar to boost results in subsequent years. Yet, the recent lending bets made by Fannie are likely to prove far more damaging.
On the surface, Fannie's balance sheet looks fine. At year end, the company reported regulatory net worth of $45.4 billion, some $3.9 billion higher than the expanded minimum capital of $41.5 billion required by federal regulators. But with its extreme leverage -- assets stand at 20 times net worth -- Fannie has little room for error. And there appear to be significant problems with the way Fannie has valued both its assets and liabilities.
For example, some $13 billion of its $45.4 billion in net worth consists of deferred tax assets that have value only if Fannie can earn enough money in the near future (say $36 billion) to employ them. That hardly seems likely. During the housing boom of 2002 to 2006, this tax asset only climbed -- from zero to $8 billion as Fannie reported $23 billion in income from 2003 to 2006.
Last year's $2.6 billion loss compounds the problem, pushing the tax asset to $13 billion. At a minimum, accountants may require the company to sharply write down the value of this asset, thus slashing net worth. Bank regulators, for example, limit the amount of deferred tax assets for regulatory purposes to the lesser of the amount expected to be used within one year or 10% of regulatory capital. So if Fannie were a bank, this entire asset would be wiped out. Fannie maintains the value of the asset will be realized over time.
Another soft asset is Fannie's $8.1 billion of Lower Income Housing Tax Credit partnerships. The partnerships' only value, other than helping fulfill Fannie's housing affordability requirements, are the rich tax credits they generate from their intended operating losses. The problem is that Fannie hasn't made enough money to employ these tax credits. Thus the asset is apt to dwindle away to zero without providing Fannie any benefit. Fannie makes no predictions on the future values.
The story is much the same for the liability side of Fannie's balance sheet. There's an item called guaranty obligation, which represents the company's best estimate on what it will have to pay out to make good on any mortgage defaults in its $2.4 trillion guaranty book. On its regular balance sheet, Fannie carries the item at $15.4 billion, but on its "fair value" balance sheet, which attempts to mark every asset and liability to current market value, the guaranty obligations are pegged at $20.6 billion. The problem was, as Morgan Stanley analyst Kenneth Posner discovered, Freddie went through the exact same drill with its guaranty obligations' fair value and chose to mark them much more aggressively. It valued them at 1.5% of its guaranteed book, double the 0.74% of total book that Fannie saw fit to use, even though Freddie's delinquency rate is lower than its rival's.
Had Fannie taken a similar hit, its fair-value net worth would've shrunk by some $20 billion to a paltry $16 billion, compared with its juiced-up regulatory capital of $45.4 billion. Fannie stands by its estimate and says it doesn't know how Freddie arrived at its own.
Finally, Fannie seemed to have been inordinately easy on itself when, in the fourth quarter, it wrote down its $74 billion holdings of privately packaged, non-agency subprime and Alt-A mortgage securities by a mere 6%, or $4.6 billion. In addition, Fannie declared that only $1.4 billion of the write-down constituted a permanent impairment, something that penalized both Fannie's profits and net worth. The remainder of the write-down was deemed a temporary mark-to-market loss that had no such negative impact.
Traders have selling Fannie's shares for some time -- the chart is still very negative.
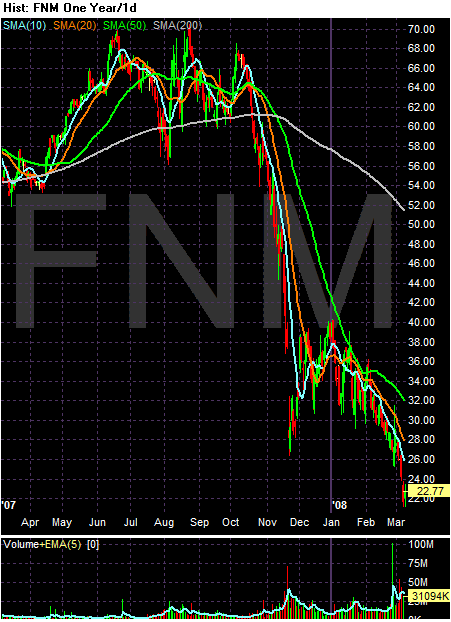
The yearly chart shows a very ugly sell-off.
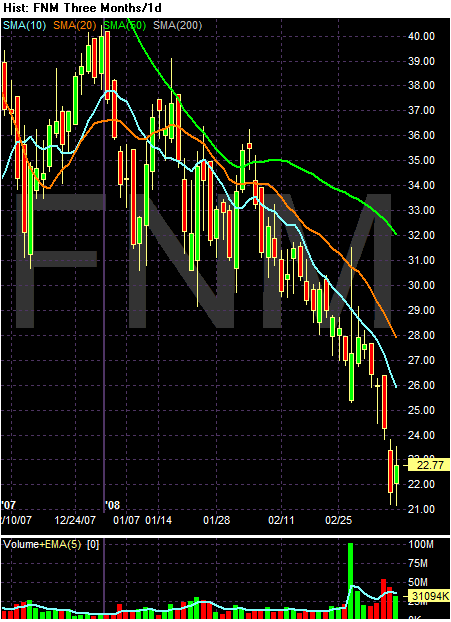
On the 3 month SMA chart, notice the following:
-- Prices are below the 200 day SMA which means the chart is in a bear market.
-- The shorter SMAs are below the longer SMAs
-- Prices are below all the SMas
-- All the SMAs are moving lower.
This is about as bearish as it can get.
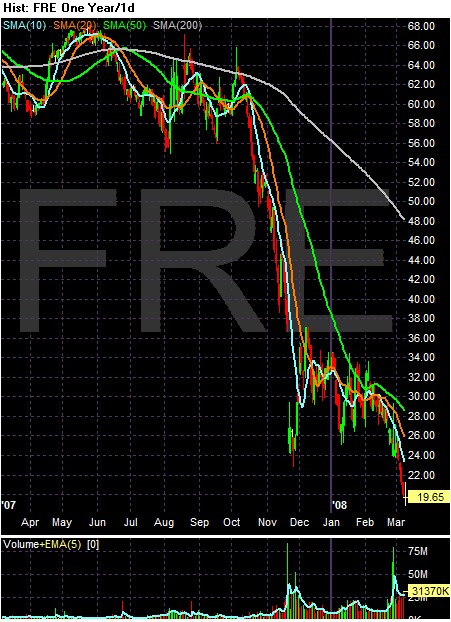
Freddie Mac has been selling off as well. Notice the prices are way below the 200 day SMA.
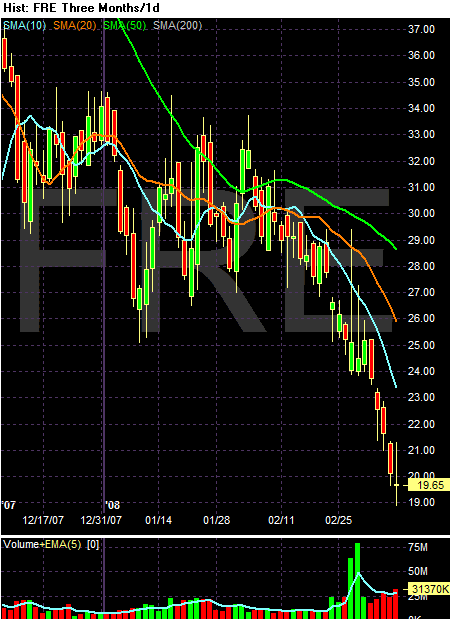
On the 3-month SMA chart, notice the following:
-- Prices are below the 200 day SMA which means the chart is in a bear market.
-- The shorter SMAs are below the longer SMAs
-- Prices are below all the SMas
-- All the SMAs are moving lower.
And finally, here is a 1-year chart of the financial sector:
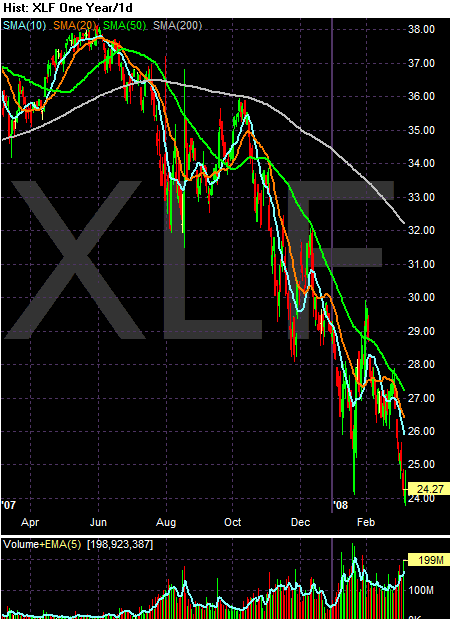
Notice the incredibly hard sell-off for the last year.
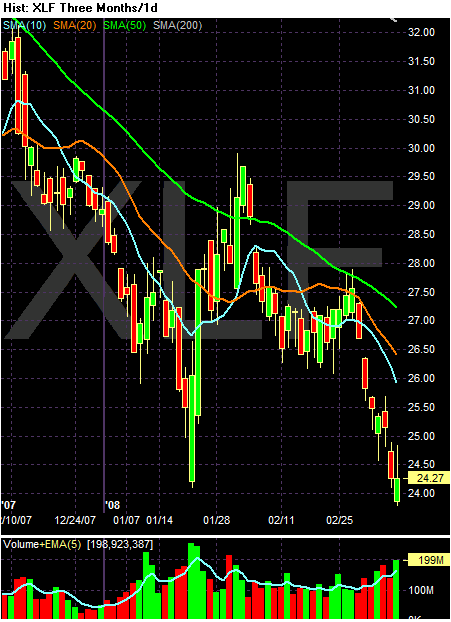
On the 3-month SMA chart, notice the following:
-- Prices are below the 200 day SMA which means the chart is in a bear market.
-- The shorter SMAs are below the longer SMAs
-- Prices are below all the SMas
-- All the SMAs are moving lower.
In other words, the financial sector is still a wreck.