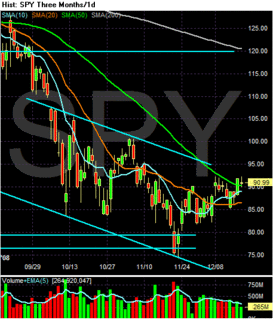
Let's look at the daily chart to see what the technicals tell us:
-- The longer term trends are still bearish: the 50 and 200 day SMAs are both heading lower
-- Prices are still in a downward sloping channel
BUT
-- Prices are above the 10, 20 and 50 day SMA
-- The 10 day SMA is moving higher
-- The 10 day SMA is above the 20 day SMA
This is a chart in transition; it is a mix of bullish and bearish indicators.