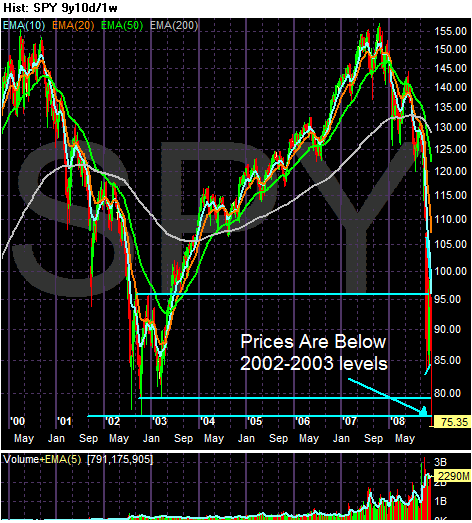
On the multi-year chart, notice that prices are now below the 2002-2003 lows. That means the entire rally of 2003-2007 is now completely gone.

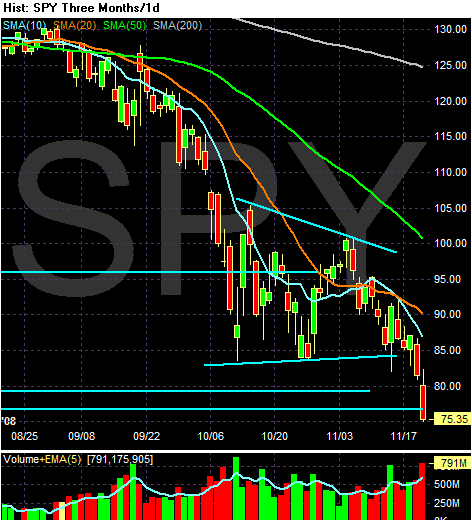
On the daily chart, notice the following:
-- Prices have moved through lower trend line of the triangle
-- All the SMAs are moving lower
-- The shorter SMAs are below the longer SMAs
-- Prices are below all the SMAs
It doesn't get more bearish than this.

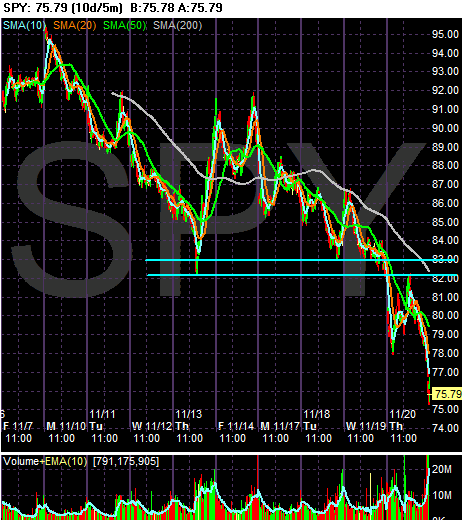
On the 10 day, 5-minute chart, notice the market has lost 20% over the last 10 days.

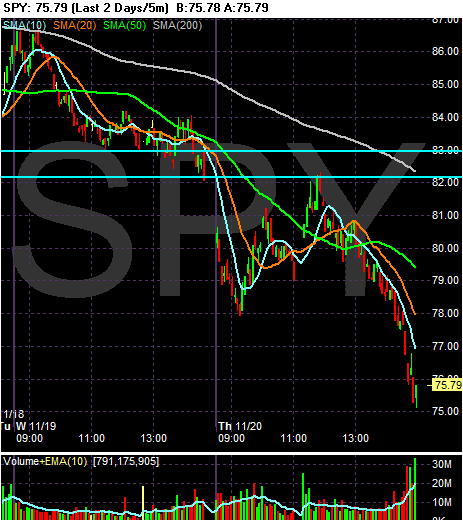
On the two day chart, notice that volume increased as the session wore on. And volume increased to big levels at the close.
Bottom line: There is nothing good on these charts; all of the technical signs are bad.