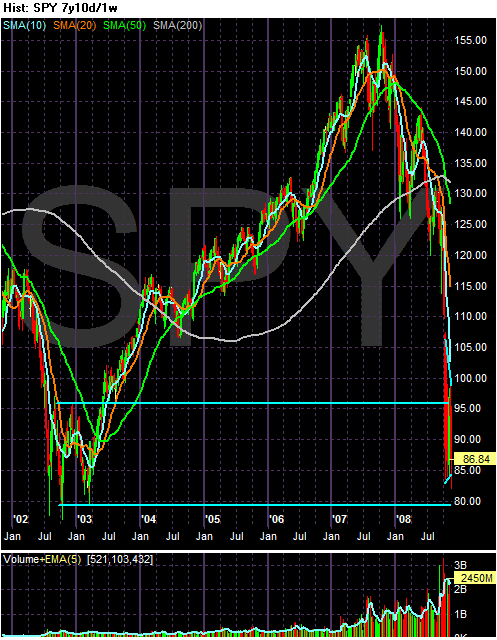
Note the market is currently at levels not seen since the sideways trading of 2003 - 2003. Also note the market traded sideways for three quarters, so we could be in for for a long-term consolidation as the bottom forms. The market would probably need a long bottom to rally from. I drew two lines from the 2002-2003 time period -- one from the top of the trading range and one from the bottom of the trading range. Note we are currently right in the middle of the same range.

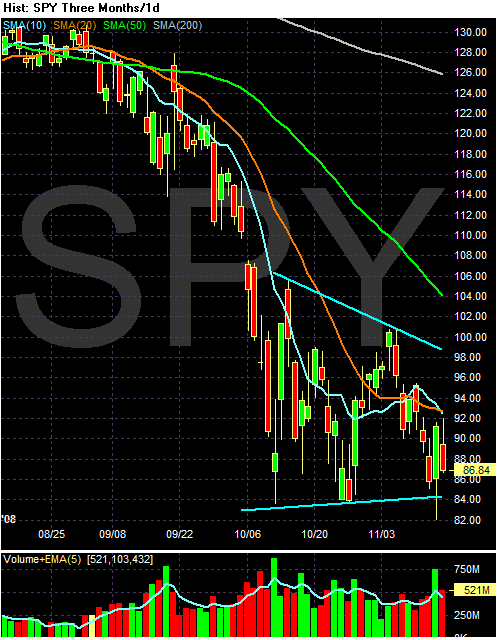
Notice the following on the daily chart:
-- Prices are clearly in a triangle consolidation.
-- All the SMAs are moving lower
-- The 10 day SMA just moved below the 20 day SMA
-- The shorter SMAs are below the longer SMAs
-- Prices are below all the SMAs
This is about as bearish an alignment as you can get.
However, prices are still within the triangle. Also note prices have tested the 84(ish) level three times only to rally from those levels. This indicates traders think 84 is currently a very attractive level and represents a buying opportunity.