These are all weekly charts, meaning one candle equals one week of trading.
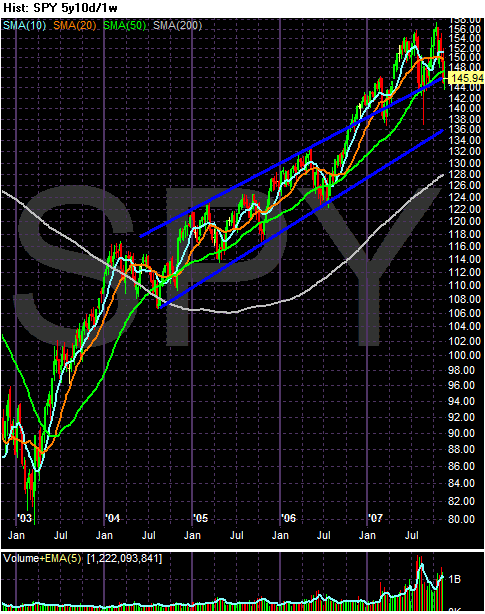
Starting in 2004, the SPYs started in an upward slanting channel. The markets broke out of this channel in late 2006. Three times since that break-out, the SPYs have used the upper channel line as support.
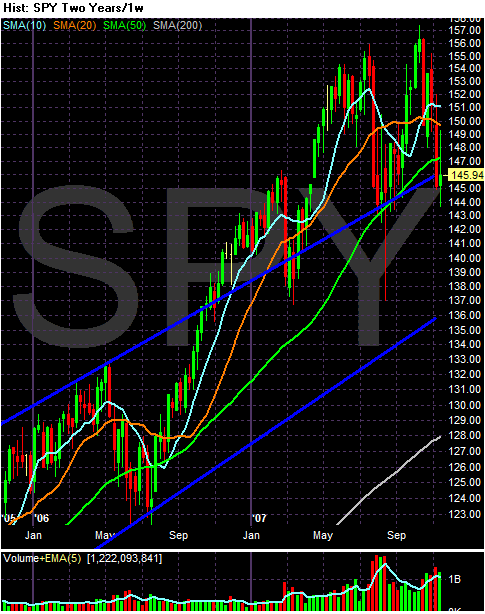
On the two year chart, notice we are right at the upper channel line. Also notice the market could drop from from the current upper channel line at about 145 to the lower channel line at about 136 and still be in the upward moving channel.
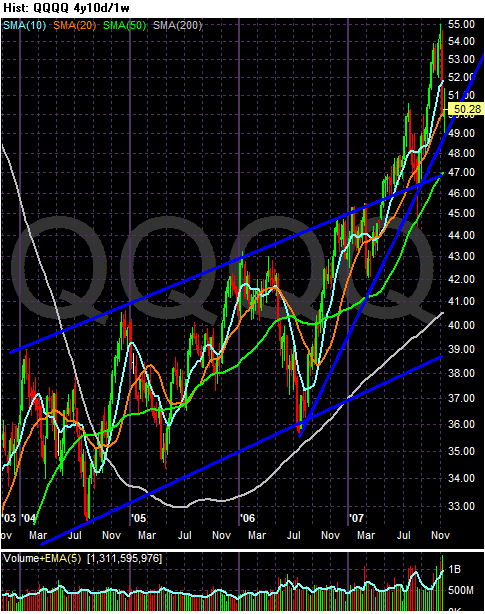
The four year QQQQ chart also shows the market was moving in an upward sloping channel until it broke out of that channel in May of tis year. Also note a second trend line that started a rally from the lower channel line in mid 2006.
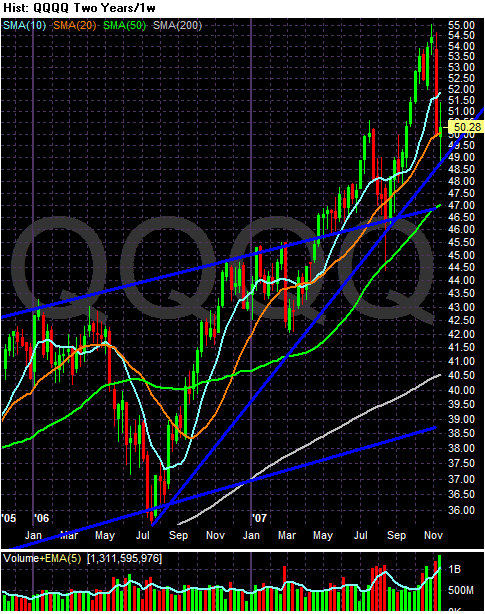
On the two year chart, notice we have a better look at the two primary uptrends. First, notice the QQQQs are still above the trend line that started in mid-2006. The market could drop another 3.5% (approximately) and still be in this uptrend. In addition, notice the QQQQs also have support from the upper channel line of the 4-year upward sloping channel. The markets would have to drop another 6% (approximately) to hit this trend line.
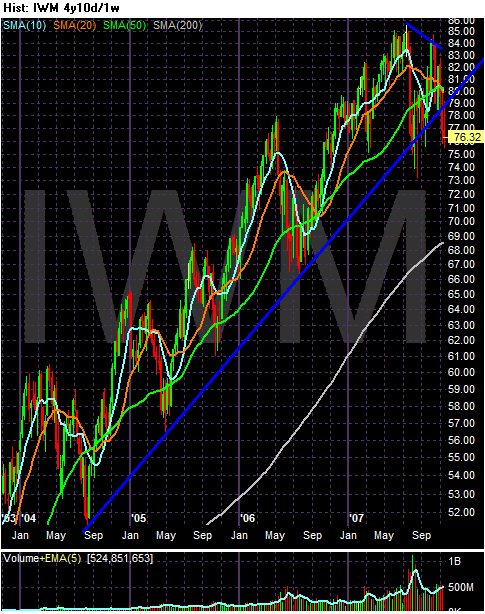
The four year Russell 2000 chart shows a solid four year trend in place.
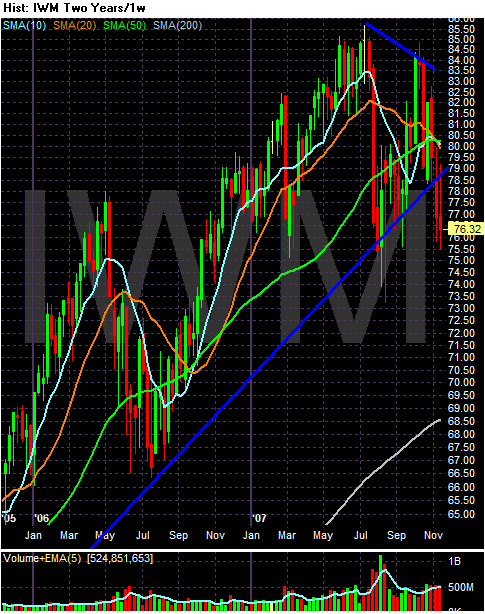
The two year Russell 2000 chart shows a we are below this trend line again. We've been here before earlier this year and bounced back.
So, what can we conclude?
1.) The SPY's are in good technical shape. There are two upward sloping trend lines that form a 4 year channel that will provide support for the index. This index has a long way to go before it breaks this trend.
2.) The QQQQs are also in good technical shape. They have two upward sloping trend lines and two upward sloping rallies in place.
3.) The Russell 2000 is below the trend line of a 4 year trend. This is technically dangerous and a further drop would indicate this average may be changing trend.