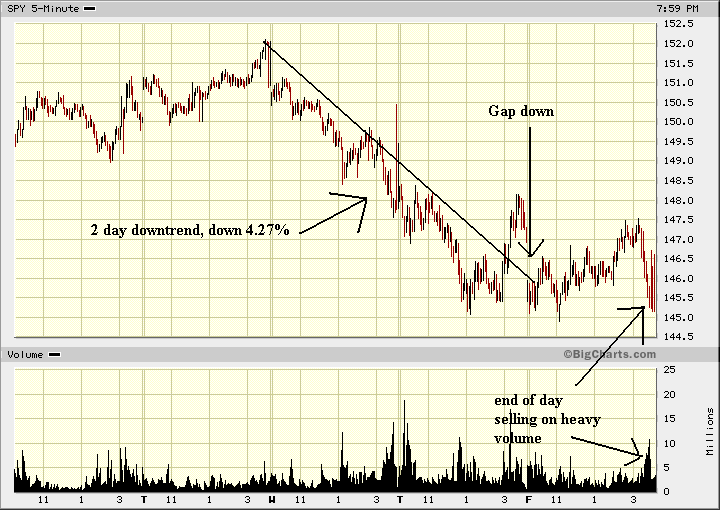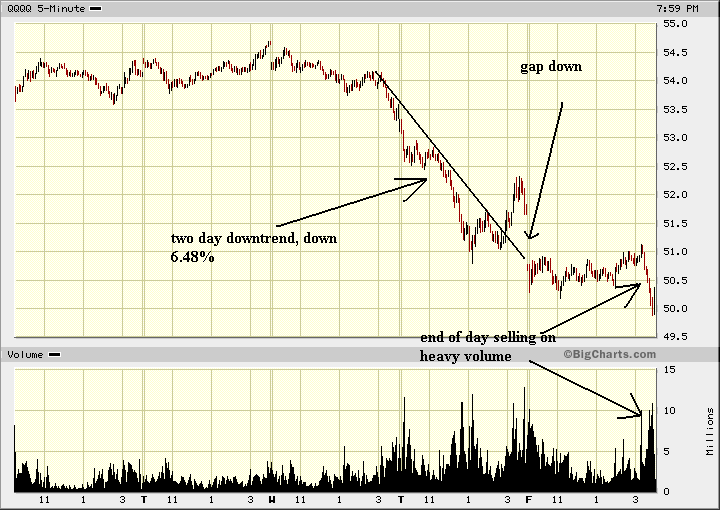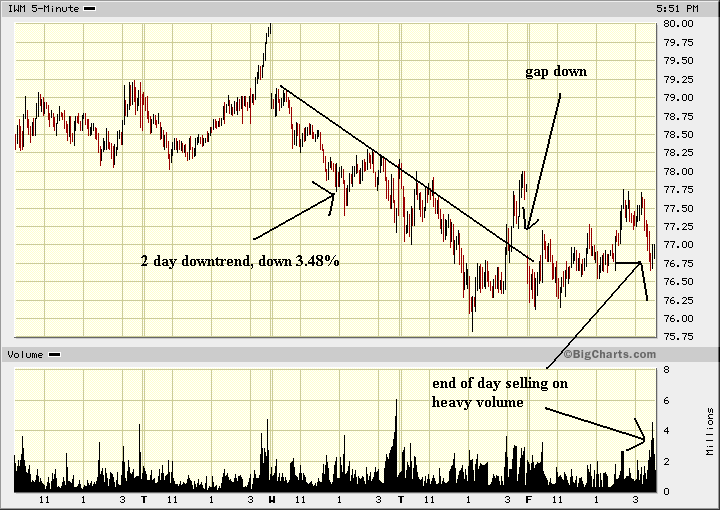


Note the following.
1.) All three averages dropped hard on Wednesday and Thursday. The biggest loser in this sell-off was the QQQQ which was holding onto technical support around 53.5.
2.) All three averages gapped down on Friday.
3.) All three averages had heavy, end-of-day selling on Friday.
What does all of this tell us?
1.) The sell-off was not limited to a particular sector of the market. Assume the SPYs represent more established blue chip companies, the QQQQs represent technology and the IWMs represent small-cap, aggressive growth. Given this assumption traders sold positions in everything. This wasn't one company in a sector reporting bad news and then the sector selling off in sympathy with that report.
2.) The end-of-the day selling on a Friday indicates traders are very nervous about the markets; no one wanted to hold anything over the weekend. If that mentality has not changed then traders could be trigger happy going into the week.
3.) We had two consistent down days (Wednesday and Thursday) followed by a gap down on Friday with heavy end-of-the day selling. That gives us three days of bearish sentiment.
Short version: there is a ton of bearishness and nervousness going into this week.
We have two big news items this week: PPI on Wednesday and CPI on Thursday. These will be very important items because they directly influence Fed policy. A weak number will spur Fed rate cut assumptions and a strong number will do the opposite.