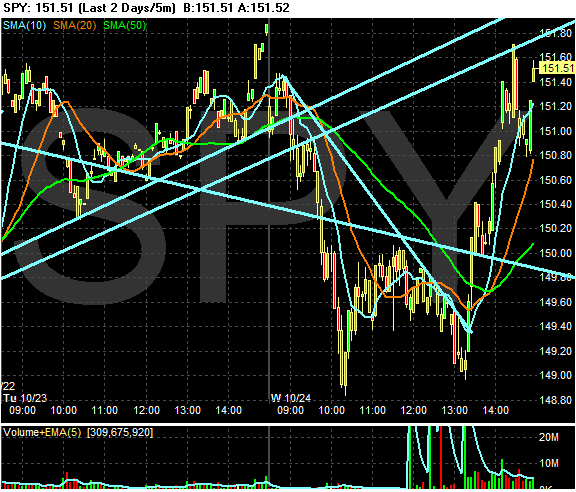
Can you say roller-coaster? Today we learned that existing homes sales are still declining and Merrill Lynch has heavy exposure to the credit crunch. These news items tanked the market at the opening. However, the markets rallied after twice testing important support around 149. Myu guess is there were some by programs that were triggered at these levels.
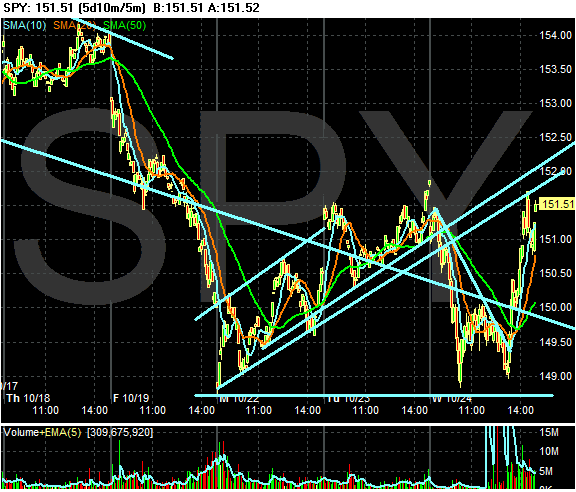
Looking at the 5 day chart, we have some really interesting dynamics to look at.
1.) The markets could be forming a double bottom. That would make sense as traders begin to anticipate the next Fed meeting.
2.) However, the lower trend line from the Monday-Tuesday rally acted like resistance today. The market could conceivably move higher with this line acting as resistance to further upward moves.
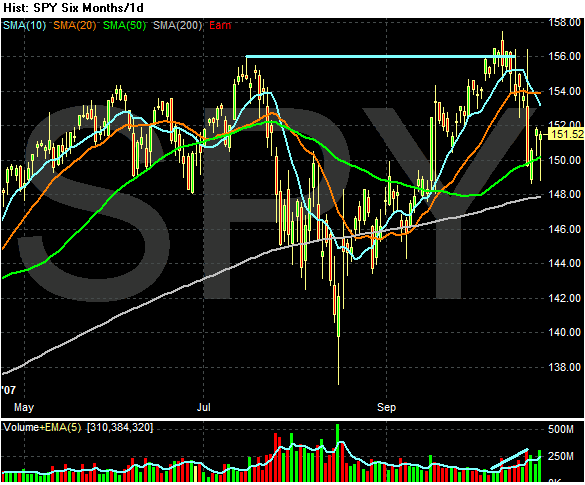
On the daily chart, we have a bounce from the 50 day SMA on decent volume. But we also have two really weak candles -- hammers, which indicate the market is looking for direction right now. In other words, there really isn't a firm trend in place in either direction right now.
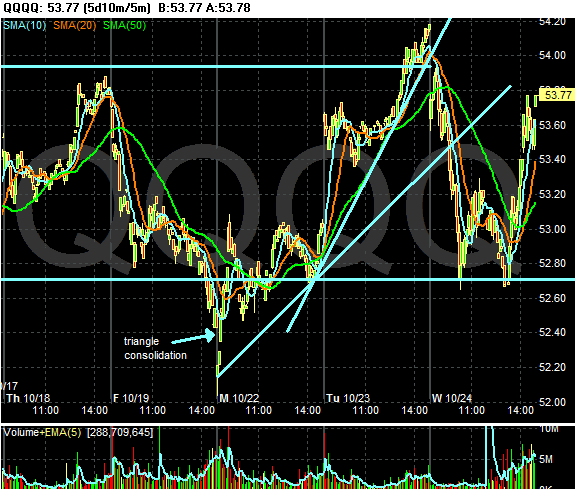
Like the SPYs, the QQQQs had a double bottom today. But they have returned to the top range they were in for the last few weeks.
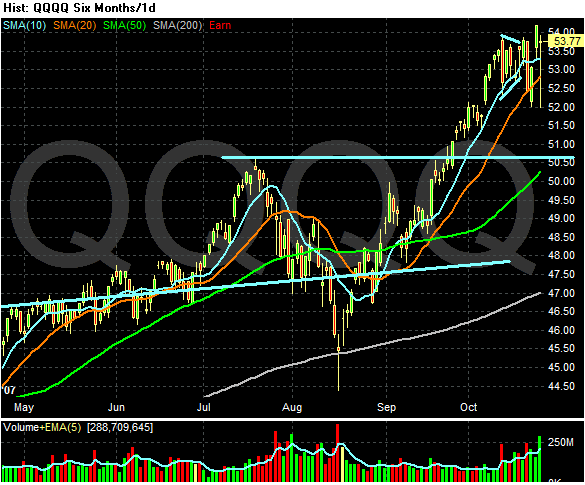
The daily chart illustrates the range a bit better, although it is still sloppy. In general, we are looking at roughly 52.50 to 54 as the topping range right now.