The dichotomy in the market today is astounding. Stocks are either "haves" or "have-nots" and that means investors are herding into a narrow group and pushing them up to where they probably should not be. Unless the rally broadens, the result is usually not very good.
Strongly trending stocks, such as Research in Motion and Google, are the "haves" as they bounce back from setbacks that give stagnant and falling stocks a lot of trouble. For example, Monday's recovery rally left many charts with bullish price reversals and heavy volume. Money was pouring into beaten down stocks looking for bargains.
But Tuesday's session showed just how different the momentum leaders are. They kept rising while the others -- the have-nots - saw their technical buy signals erased.
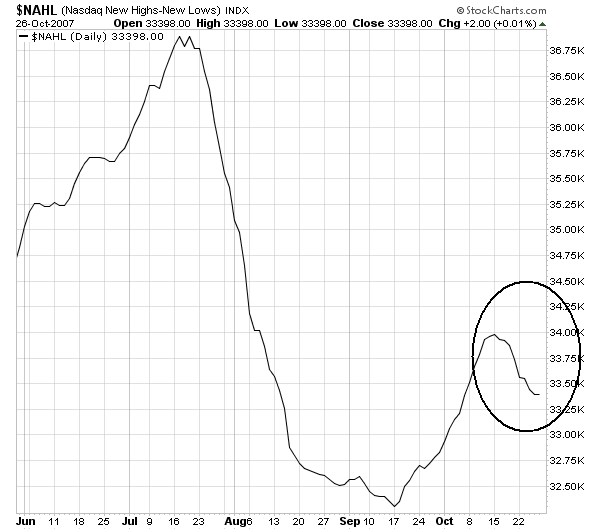
Another have vs. have-not condition dogging the market is the heavy numbers of new 52-week highs and new 52-week lows at the same time. While major indexes are still within spitting distance of all-time watermarks, the presence of all those new highs is to be expected. However, the number of stocks reaching 52-week lows is quite inconsistent with a healthy market.
Now -- let's coordinate that statement with the following charts from Stockcharts.com
The NASDAQ new high/low index is dropping

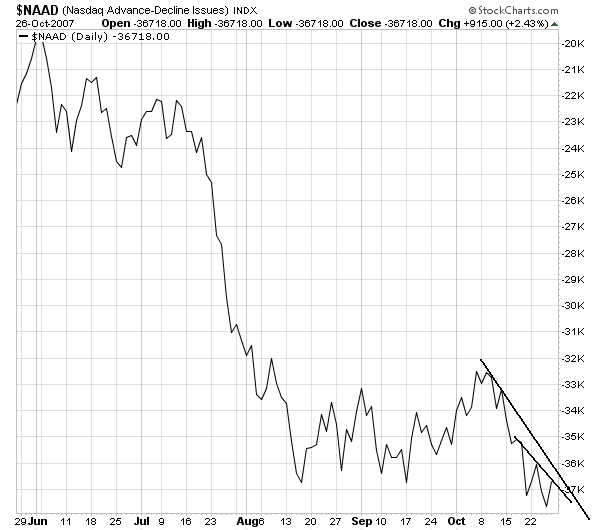
And the NASDAQ advance/decline line is as well

In a recent column Chris Perruna offered the excellent advice to "follow the leaders". This simply means that some stocks are leading the market higher. However, the lack of breadth on the high/low and advance/decline lines indicate these stocks are moving higher without other stocks following them higher. That's a warning sign.
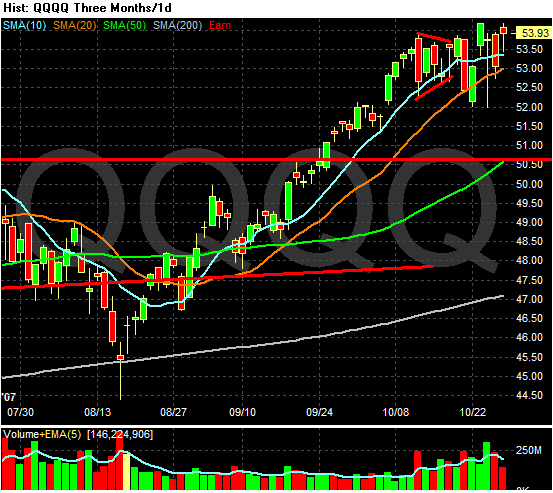
The sum total of all this is simple: On the chart below, there aren't a lot of companies that are responsible for the run-up in the NASDAQ. So, when those companies start too sell-off, watch out.

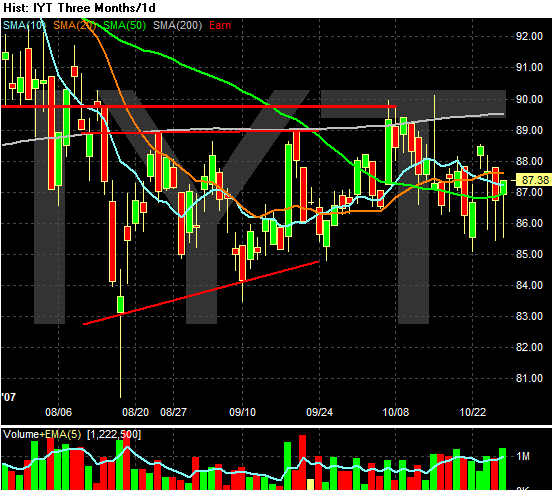
Oh -- and did I mention the Transports are still below the 200 day moving average and are still in a trading range and still haven't confirmed the most recent rally?
