First, let's look at two charts of basic metals:

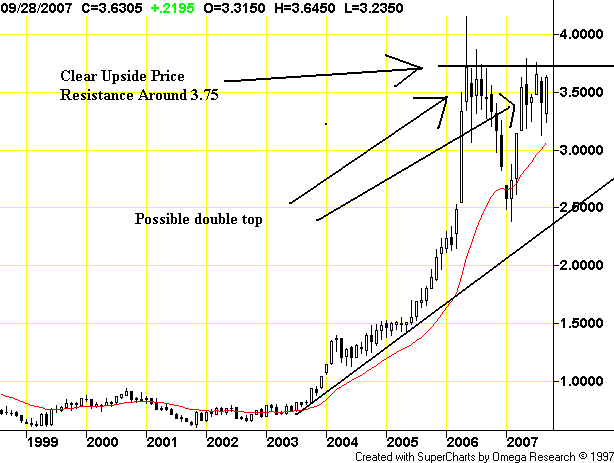
Copper really took-off in mid-2005, when the price moved from 1.50 to about 2.20 by year end. By early 2006 the price again increase to about 3.60, but then sold-off of the 2.60 level. Copper again rallied at the beginning of 2007 and is currently consolidating around the 3.50 area.
Simply put, this is a very bullish chart. There does appear to be upside resistance around the 3.75 area. On the bearish side, we could be seeing a double top forming. But for that to play out China and India would have to go off line. Considering they are currently growing over 10% year, that does not seem likely.

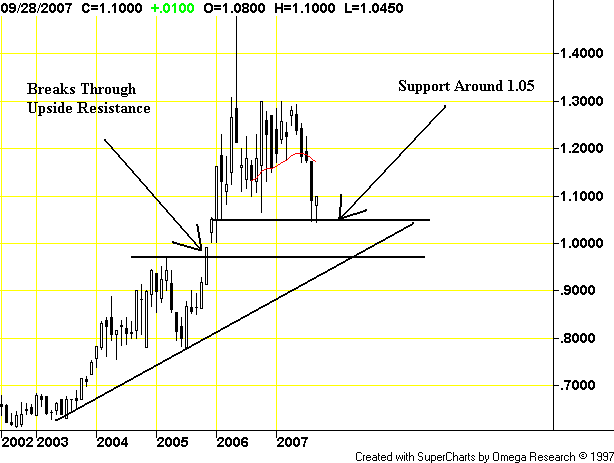
There have been two price runs in aluminum. The first occurred from mid-2003 to early 2004 when the price increased from about .65 to .8. The next big price run occurred from mid-2005 to early 2006 when prices increase from .8 to 1.10. Prices have been in a consolidation range from 1.10 to 1.30 since.
The point of the previous two charts is there is clearly money to be made in the raw materials/basic materials sector of the market. And the ETFs that trade in this area of the market have benefited.

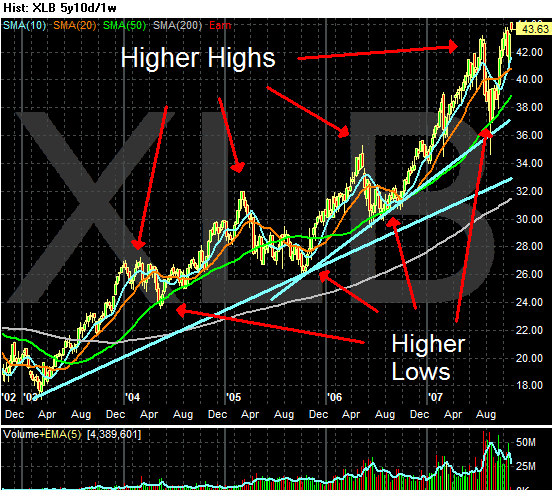
The five year basic materials chart shows a classic bull market chart. We have higher lows and higher highs -- always a good sign. There are also two strong upward slanting trendlines in play. Since mid-2006 the XLBs have used the 200 day SMA as downside support. All in all, this is a great long term chart.

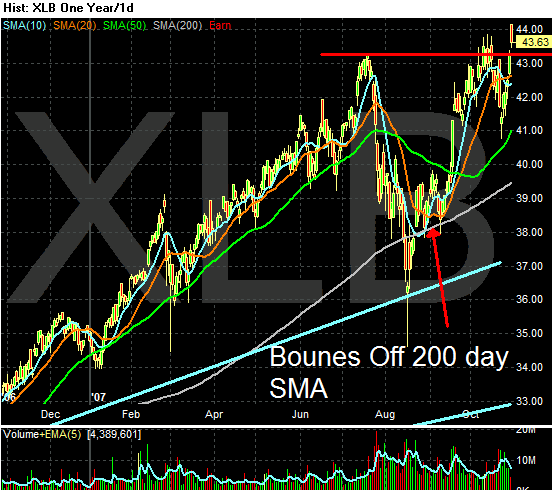
On the year long XLB chart there is a strong rally from November of 2006 to July of this year when the market sold-off. The XLBs traded down to their 200 day SMA and have rallied from that level.
However, the previous highs set in mid0July seem to be giving the index a hard time right now. Notice that in early October prices bunched up around the previous high but had to retreat to retest those levels. While prices have advanced beyond the mid-July levels, the volume has been less than inspiring -- especially yesterday's total. Also note the position of the moving averages. The 10 day SMA is below the 20 day SMA and the 20 day SMA is almost horizontal. While these are not fatal problems, they do not inspire a extreme confidence going forward.
I think a heavy sell-off is doubtful right now largely because the underlying fundamentals are incredibly strong. However, as noted in yesterday's IBD, 3Q basic materials earnings increased 0%. Considering the incredible bull run we have seen in this sector so far, I don't think traders will want to take all their respective chips off the table, instead opting for selling some of their positions in a weak market situation and waiting for fourth quarter results to come in.