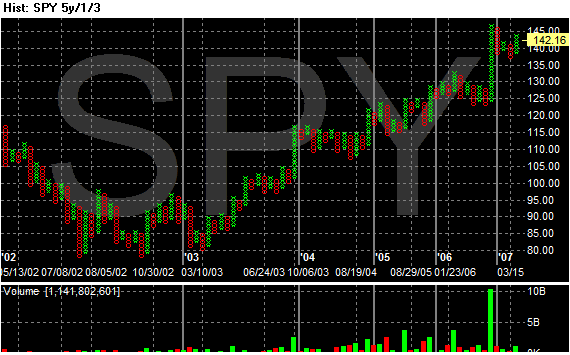
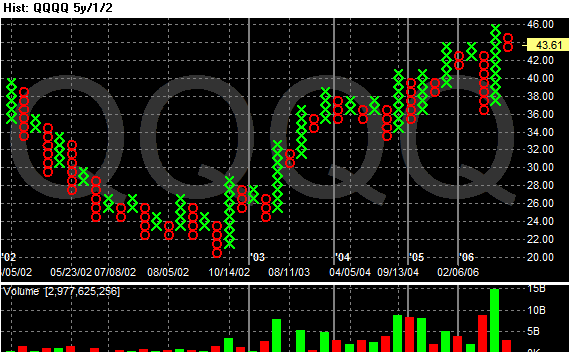
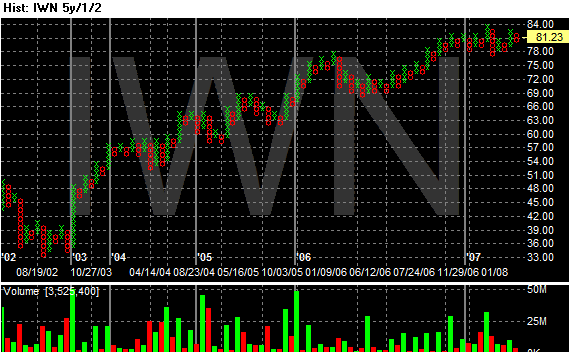
Here is a look at the SPYs, QQQQs and IWNs from a P&F chart perspective. Pay particular attention to the volume totals underneath the green moves up. Think of these as a really, really rough on balance volume indicator. What these charts indicate is on the SPYs and IWNs there are still a lot of people who are still in the market -- the recent moves haven't scared them out.
The QQQQs are a different story. They indicate that aside from the last rally that began at the end of last summer, traders have in general been getting out of the QQQQs. Think of this as something similar to a long-term tech hangover from the 1990s.


