Friday, June 6, 2025

May jobs report: about as poor as an expansiony report could be


 - by New Deal democrat


Even before the new Administration took office in Washington, my focus had been on whether the economy would have a “soft” or “hard” landing, i.e., recession. That has only intensified by the utter chaos of tariff-palooza! So my focus now is looking for “hard” vs.”soft” data indicating its impact.

This month’s employment report was ambiguous on that score, but otherwise was about as poor as a jobs report could be and still be expansionary.

Below is my in depth synopsis.


HEADLINES:
  • 139,000 jobs added. Private sector jobs increased 140,000. Government jobs declined by -1,000. The three month average was an increase of +135,000, about average for this year, but above the lowest average last summer.
  • The pattern of downward revisions to previous months continued this month. March was revised downward by another -65,000, and April was revised downward  by -30,000, for a net decrease of -95,000.
  • The alternate, and more volatile measure in the household report, declined by -696,000 jobs. On a YoY basis, this series increased 2,109,000 jobs, or an average of 176,000 monthly.
  • The U3 unemployment rate was unchanged at its repeated 12 month high of 4.2%. Since the three month average is 4.2% vs. a low of 3.933% for the three month average in the past 12 months, or an increase of 0.267%, this means the “Sahm rule” remains un-triggered. 
  • The U6 underemployment rate was unchanged at 7.8%, down -0.2% from its 3+year high in February.
  • Further out on the spectrum, those who are not in the labor force but want a job now rose sharply by 319,000 to 5.991 million, its highest level since July 2021.

Leading employment indicators of a slowdown or recession

These are leading sectors for the economy overall, and help us gauge how much the post-pandemic employment boom is shading towards a downturn. This month they were mainly negative:
  • the average manufacturing workweek, one of the 10 components of the Index of Leading Indicators, rose 0.1 hour to 41.0 hours, but remains down -0.6 hours from its 2021 peak of 41.6 hours.
  • Manufacturing jobs decreased by -8,000. This series had been  in sharp decline, but even with this month’s decline it has generally leveled off in the past eight months.
  • Within that sector, motor vehicle manufacturing jobs rose 400.
  • Truck driving ended its two month rebound, declining -900.
  • Construction jobs increased another 4,000.
  • Residential construction jobs, which are even more leading, rose 3,600 to yet another post-pandemic high.
  • Goods producing jobs as a whole declined -5,000 from their 17 year high set last month.  These jobs typically decline before any recession occurs. But on a YoY% basis, these jobs are only 0.2%, which is very anemic although not necesarily recessionary.
  • Temporary jobs, which have declined by over -550,000 since late 2022, declilned again this month, by -20,200, setting a new post-pandemic low.
  • the number of people unemployed for 5 weeks or fewer increased 264,000 to 2,451,000, just below its 12 month high of 2,465,000 last August.

Wages of non-managerial workers
  • Average Hourly Earnings for Production and Nonsupervisory Personnel increased $.12, or +0.4%, to $31.18, for a YoY gain of +4.0%, which is an average YoY gain for the past 12 months. Importantly, this continues to be well above the 2.3% YoY inflation rate as of last month.

Aggregate hours and wages: 
  • The index of aggregate hours worked for non-managerial workers rose a small 0.1% to a new record high. This measure is also up 1.1% YoY, about average for the past two years.
  • The index of aggregate payrolls for non-managerial workers also rose 0.5%, and is up 5.2% YoY, about average for the past 12 months. This is also well above the inflation rate, meaning a continuation in the ability of households to increase consumption.

Other significant data:
  • Professional and business employment declined -18,000. These tend to be well-paying jobs. This series peaked in May 2023, bottomed in October 2024, and is up less than 0.2% since then. It remains lower YoY by -0.4%, which in the past 80+ years - until now - has almost *always* meant recession. This is vs.  last spring when it was down -0.9% YoY.
  • The employment population ratio declined -0.3% to 59.7%, vs. 61.1% in February 2020.
  • The Labor Force Participation Rate declined -0.2% to 62.4%, vs. 63.4% in February 2020.


SUMMARY

Although the headline numbers were positive to neutral, this was about as poor a report as could be during an expansion. 

To begin with, the only reason the unemployment and underemployment rates did not go up was that the labor force participation declined significantly. The employment/population ratio also declined. Further out on the spectrum, those not in the labor force but who want a job increased to over a 3 year high. And the number of those laid off for fewer than 5 weeks also increased.

Additionally, most leading sectors declined, including manufacturing, trucking, temporary help, and even goods-producing jobs as a whole. Professional and business employment also declined, as did government employment. The pattern of downward revisions to previous months also continued.

Aside from the headline jobs number, the only bright spots were the slight increase in the manufacturing work week, and the continued rise in construction, and specifically residential construction jobs. Average and aggregate earnings for nonsupervisory workers also held up well.

It continues to be very surprising how well construction employment is holding up. If those turn down in sync with manufacturing, and real aggregate payrolls stall, almost all the ducks would be lined up to signal a recession is likely in the next few months.

Thursday, June 5, 2025

YoY jobless claims still rangebound, but continuing claims at 3.5 year high


 - by New Deal democrat


Let’s take our weekly look at jobless claims, particularly since it is one of two “quick and dirty” elements that will indicate whether the “recession watch” I inaugurated yesterday will need to be upgraded to a “warning.”


Initial claims rose 8,000 last week to 247,000, while the four week moving average increased 4,500 to 235,000. Meanwhile continuing claims, with the typical one week delay, declined -3,000 to 1. 904 million:


Both initial claims metrics are at 7 month highs, while continuing claims are just below 3.5 year highs. Since there appears to be unresolved post-covid seasonality at work especially with initial claims - which for the last several years have risen into the summer months and then declined into the winter months - I am taking those numbers with several grains of salt. But the continued elevation in continuing claims strongly suggests that laid off workers are having a harder time finding new employment.

As usual, the YoY% changes are more important for forecasting purposes, and there the trend of the last 8 months remains intact, as all three metrics hover in the +5% YoY range:


Initial claims are up 7.9% YoY, the four week average up 5.9%, and continuing claims up 5.2%. These won’t even raise a yellow flag for a recession watch unless and until they are up at minimum 10%. 

In other words, jobless claims continue to indicate a slowly growing economy in the immediate future.

Finally, since jobless claims lead the unemployment rate, let’s take our last look before tomorrow’s jobs report - and here, this week’s new data makes a difference:


With the additional data, it now appears that there is some upward pressure on the unemployment rate going forward for the next few months, as initial + continuing claims together were at new highs. While a decline in the unemployment rate to 4.1% cannot be ruled out, an increase to 4.3% this or next month is very possible as well.

Wednesday, June 4, 2025

Economically weighted ISM services + manufacturing warrant Recession Watch


 - by New Deal democrat


Last month I concluded my report on the economically weighted ISM manufacturing and services indexes by writing “new orders for the entire economy are tight on the cusp of tipping into contraction.”

This month, they did, warranting a “Recession Watch.”

To recap, because manufacturing is much less important to the economy than in the decades before the Millennium, the economically weighted average of the ISM services index (75%) as well as manufacturing (25%), especially over a three month period, has been much more accurate since 2000.

On Monday the ISM manufacturing index came in at 48.5, and its three month average was 48.7. The new orders subindex came in at 47.6, and its three month average was 46.7. I wrote then that “ Thus, to signal economic contraction, this month’s numbers in the non-manufacturing report, which will be reported on Wednesday, must be 49.8 and 49.5, respectively.”

This morning the non-manufacturing index was reported at 49.9, just 0.1 above that threshold. But the new orders index was reported at 46.4, well below the tipping point.

Here the three months in the headline numbers (first line) and the three month average for services, plus the same as to the new orders services subindex (second line):
50.8, 51.6, 49.9 —> 50.8
50.4, 52.3, 46.4 —> 49.7  

Below are comparisons of the headline manufacturing and services indexes:


And for the manufacturing and services new orders indexes:


While we came close last summer, at no point did either of the three month economically weighted averages tip into contraction. In May the three month economically weighted average of the headline indexes was 50.3. But the three month economically weighted average of the more leading new orders subindexes was 49.0. This raises a red flag.

In short, new orders for the economy as a whole contracted in May. This is enough to warrant a “recession watch.” Should the headline numbers follow, that would warrant a “recession warning.”

As I’ve said in the past, treat the terms “watch” and “warning” the way you would for weather. A “watch” means that conditions are right, and the economy is at significantly heightened risk of a recession starting in the next few months. A “warning” would mean that a recession is likely, and almost imminently.

In the meantime, watch to see if the remaining short leading indicators to fall into place, most notably new jobless claims, consumer retail spending, employment in the goods-producing sectors, at very least a stalling in aggregate real payroll growth, and a new decline in the stock market.

Tuesday, June 3, 2025

April job openings, hires, quits, and layoffs: possibly the last month before the effects of Tariff-palooza! are felt


 - by New Deal democrat


The JOLTS survey, which decomposes the employment market into openings, hires, quits, and layoffs, was reported this morning for April. In 2024 the data were most consistent with a “soft landing,” but the actions of the new Administration, especially on trade, have exacerbated the fear that this might transform into a “hard” landing, a/k/a a recession.

In April the news was mixed.

Let’s start with job openings, hires, and quits all normed to 100 as of just before the pandemic:


Openings, which are “soft” data and have generally uptrended going all the way back to the turn of the Millennium, have remained above their pre-pandemic levels, and this month improved by 391,000 to 7.391 million. Hires also increased by 169,000 to 5.573 million, but remain below their pre-pandemic levels. Meanwhile quits declined another -150,000 to 3.194 million, significantly below their pre-pandemic levels, but above their level through much of last year. 

Focusing on the past 12 months of data continues to show stabilization - a plus sign for the continuation of the “soft landing” scenario:


Several components are slight leading indicators for jobless claims, unemployment and wage growth.

Recently one item of concern has been layoffs and discharges, which generally have averaged higher since last July. This weakness continued in April, as they increased by 196,000 to 1.796 million, their highest level in two years except for last September and October:


This is consistent with the increase in the unemployment rate (red, right scale) to new levels in the past year, as well as the recent trends in new and continuing jobless claims (not shown), both of which typically follow with a short lag.

Additionally, the quits rate (left scale) typically leads the YoY% change in average hourly wages for nonsupervisory workers (red, right scale):


In April the quits rate fell back -0.1% to 2.0%. Although in the past few months the trend has been a slight improvement, this is still below any post-pandemic reading before last September. This downshift has not yet been reflected in average hourly wages, which tend to follow with a lag. Thus the likelihood remains that wage growth will decelerate further on a YoY basis over the next few months.

The message of this morning’s JOLTS report, like last month’s is that the “soft landing” was intact through April, although future wage gains are likely to be further attenuated. Unfortunately, of course, this was almost certainly one of the last reports - if not *the* last report - not to be affected by Tariff-palooza.

Monday, June 2, 2025

April construction spending continues slightly declining trend


 - by New Deal democrat


Let’s take a look now at construction spending for April. To cut to the chase, in all respects there was a continued decline.


In nominal terms, total construction spending declined -0.4%, while the more leading residential construction spending declined -0.9%, the third straight month for declines in both measures:


Total nominal construction spending is down -1.9% since January, while residential spending is down -3.9%. But as the below graph shows, over the past 25 years there have been other, steeper declines without a recession occurring. In 2007, the respective declines were -8.5% and -28.1% before the Great Recession actually started (graph is in log scale better to show the magnitude of declines):


Because the cost of construction materials rose 0.7% in April, real total construction spending declined -1.1% for the month, while real residential construction spending declined -1.6%. Again, as you can see in the below graph also set to log scale, there have been several steeper declines in the past 10 years without a recession occurring:


Of note, both total and manufacturing industrial production are down slightly from their last peaks in January and February, respectively:


Putting this report together with this morning’s other report on manufacturing from ISM, it appears the goods-producing part of the economy as a whole is very slightly contracting. It will be interesting to see if this is reflected in a decline in goods-producing jobs in Friday’s report. But as I indicated in my earlier note this morning, the US economy is so heavily weighted towards services that I would need to see those turn down as well, at least slightly, to warrant a recession watch.

May ISM manufacturing report shows continuing sectoral contraction, but still signals slow economic growth


 - by New Deal democrat


As usual, we started out the month with reports on both manufacturing and construction. I am posting separately on the two this month. So let’s start with the ISM manufacturing report, a recognized leading indicator for the past 60+ years, although of diminished importance since the turn of the Millennium (it was in deep contraction both in 2015-16 and again in 2022 without a recession occurring).

To recap briefly, any number below 50 indicates contraction. The ISM itself indicates that the number must be 42.5 or less to signal recession. For forecasting purposes, I use an economically weighted three month average of the manufacturing and non-manufacturing indexes, with a 25% and 75% weighting, respectively.

In this morning’s report, the headline number for May declined -0.2 to 48.5, the third straight month of contraction, while the more leading new orders subindex rose +0.4 to 47.6. As per the above, both indicate continued contraction.

Here is a look at both the total index (gray) and new orders subindex (blue) for the past ten years:


Note that both remain better than they were in 2022-23.

Hare the last six months of both the headline (left column) and new orders (right) numbers:

DEC 49.2. 52.1
JAN 50.9  55.1
FEB  50.3  48.6
MAR 49.0. 45.2
APR 48.7. 47.2
MAY 48.5. 47.6

The current three month average for the total index is 48.7, and for the new orders subindex 46.7. 

As I indicated above, for the economy as a whole the weighted index of manufacturing (25%) and non-manufacturing (75%) indexes is more important. In the non-manufacturing report, the average of the last two months for the headline and new orders numbers has been 51.2 and 51.4, respectively. Thus, to signal economic contraction, this month’s numbers in the non-manufacturing report, which will be reported on Wednesday, must be 49.8 and 49.5, respectively. Or, more generally, if the non-manufacturing numbers on Wednesday show continued growth, the economy as a whole is not in recession now nor will be in the next several months.

In any event, as of today, the forecast signal remains a very slowly growing economy.

Saturday, May 31, 2025

Weekly Indicators for May 26 - 30 at Seeking Alpha


 - by New Deal democrat


My “Weekly Indicators” post is up at Seeking Alpha.

As I wrote about here this week, the supply chain effects of the tariffs have finally bled through to rail shipments, and probably trucking as well.

Meanwhile, despite all the uncretainty, as we saw yesterday with the personal income and spending report, consumers keep on powering the economy forward by spending.

How long can it be until the weak long leading and short leading indicators bleed through into the coincident data? That is the question.

In the meantime, clicking through and reading will bring you thoroughly up to date on all of the relevant information, and bring me a penny or two for my efforts.

Friday, May 30, 2025

April personal income and spending: the last positive front-running report?


 - by New Deal democrat


We finish the month of May with the very important personal income and spending for April, which gives us a thorough look at the consumer. In this case it is particularly complicated by the fact that “Liberation Day” tariffs and various further retaliatory increases were imposed at various times during the month. So I would expect to see lots of evidence of consumers front-running those increases, but which may well have tailed off by the end of the month.


The news on income was particularly good, as it increased nominally by 0.8%. Spending increased 0.2%. Since the deflator increased by 0.1%, real income rose 0.7% and real spending increased 0.1%. Here is real personal income and spending normed to 100 since the onset of the pandemic (as are all other graphs below except for the personal saving rate), showing the former up 13.5%, and the latter up 15.7%:


A closer examination of the release tables indicates that the portion of personal income attributable to wages and salaries increased 0.5%. The big drivers of the outsized increase in income in April were an increase in Social Security benefits, up 2.8%, and also proprietors’ incomes, up 1.3%.

An important forecasting issue is that typically real spending on goods declines before recessions, while real spending on services can increase throughout all but the most severe of them. In April the former declined by -0.2%, while the latter increased 0.3%:


Let’s break down real spending on goods further, into durable vs. non-durable goods. At least one important historical recession model indicates that durable goods purchases turn down before non-durables. I would expect to see front-running by consumers much more evident in the former than the latter. And here there was a major divergence, as real spending on durable goods declined -0.8%, while real spending on non-durables rose 0.1%:


This is particularly hard to interpret, but still, real spending on durable goods was at a level below only March and last December, so my interpretation is that front-running continued in April, but probably abated sharply by the end of the month.

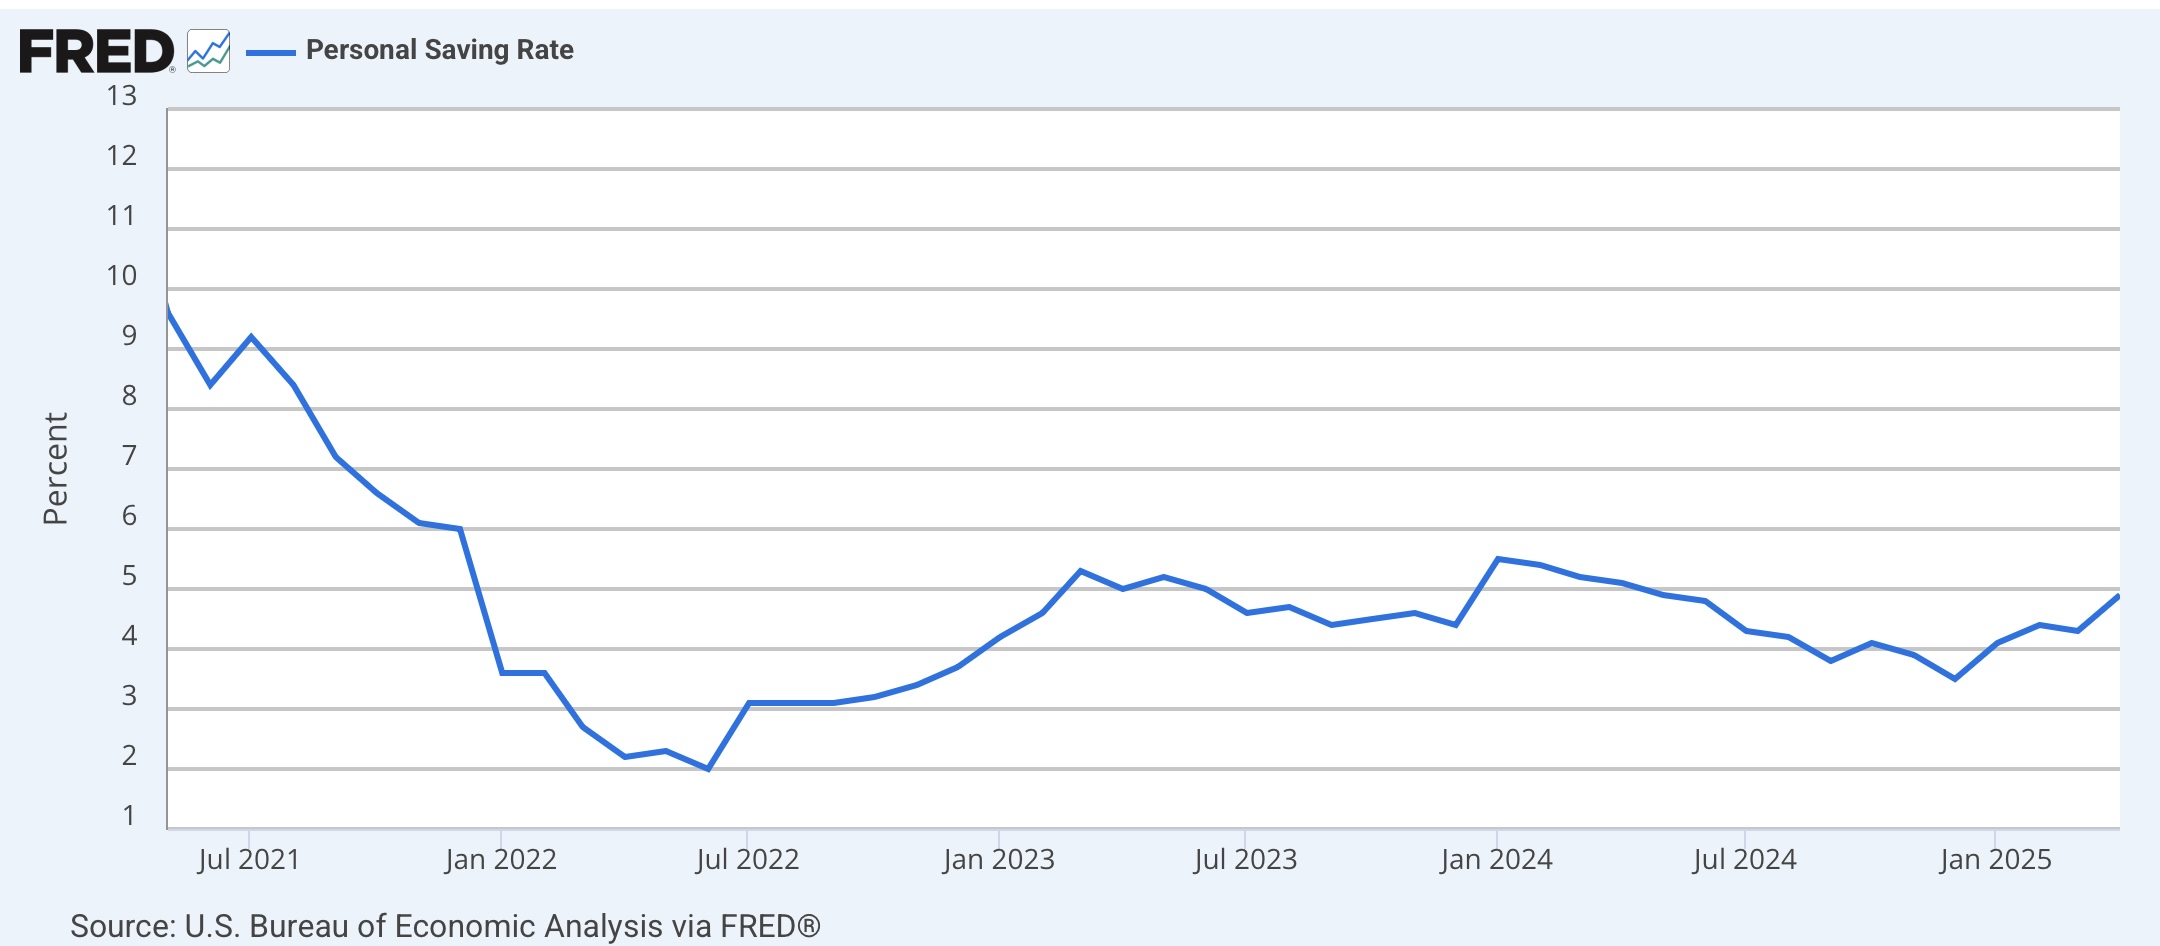
Another important indicator is the personal saving rate. Generally, as expansions continue, consumers become more aggressive with their purchasing, and then more cautious immediately in advance of (and partially the cause of) recessions. In April this increased to 4.9%, the highest level in 11 months, and well above its low of 3.5% in December, indicating that consumers have indeed become more cautious since the end of last year:


It is important to note that such a rate remains below any reading below 1999, and the average between 2000 and 2019 was 5%:


Finally, there are several important coincident indicators used by the NBER in recession dating in this report.

The first is real personal income less government transfer payments. This increased 0.3% in April to another record:


This shows a healthy consumer in the present.

The second is real manufacturing and trade sales, which are calculated with a one month delay. In March they increased 1.4% to a new all-time high as


The surge in real sales - remember, for March, not April - looks very much like further evidence of front-running tariffs, in this case by producers and wholesalers.
 
Because of the tariff situation, forecasting based on this report is particularly fraught. What we can say is that the consumer portion of the US economy remained in expansion through April, given the increases in almost all of the income and spending series. The only points of caution are the increase in the personal saving rate, and the pulling back on durable goods purchases - but it will be important to see if that trend continued or was amplified in May or not when we get next month’s report.

Thursday, May 29, 2025

Tariff-palooza! Implodes - for now; but is it already too late?


 - by New Deal democrat


Let me start this post by picking up where I left off yesterday.


In yesterday’s post I suggested that an absolute YoY decline in intermodal rail freight might well show up in this morning’s report from the AAR. And as the below chart shows, that’s exactly what happened, with intermodal traffic being down YoY for the first time this year at -1.8%:


This is after a very small 0.3% YoY increase last week.

But of course the other big thing that has happened since yesterday morning is that the US Court of International Trade, as special US District Court specializing in these issues, declared that (as far as I have been able to determine) *ALL* of the tariffs T—-p has imposed since he took office were Unconsitutional and invalid, and ordered that they be permanently stopped.

So what happens next? I expect both the legal and the financial/economic communities will be gaming out how this is likely to unfold further in the coming months.

One thing that has already happened as of last night is that the Administration filed an appeal with the Federal Circuit Court of Appeals.

In order of confidence, here is how I expect developments to happen from here:

 - the Administration will ask that the Court of Trade’s decision be stayed during appeal
 - this will wind up with the Supreme Court, perhaps within a matter of weeks.
 - the Supreme Court will expedite the appeal and decision process, because of the huge impact on the economy from a decision either way. They will want to provide certainty.

I am somewhat less certain of the following:

 - the Administration’s request for a stay will be granted, because continuing the status quo of tariffs is less destabilizing than their sudden disappearance.
 - the appeals court and Supreme Court will uphold the opinion of the Court of Trade on the basis of the “major questions doctrine” and possibly for other reasons. In other words, if Biden couldn’t waive student loan payments in the face of a statute that said that he could “waive or alter” such payments, without more explicit Congressional authorization, then the wholesale upending of the US tariff regime in the face of explicit Constitutional text saying that tariffs are a Congressional responsibility, certainly qualifies as such a “major question” as well.
 - regardless of what the courts do, the Administration will drag the process out with as many interim appeals as possible.
 - the Administration will try to evade the Court of Trade’s ruling, and indeed any adverse ruling by the Supreme Court by invoking other laws allowing for the imposition of tariffs.

Now let’s turn to what companies will do. I am almost 100% sure that the kind of gaming out I engaged in above is being done by many businesses today as well.

In view of the above, if I were a company that imported some or all of what I sell, would I go ahead now and reinstate new foreign orders? Or would I hold back, waiting for the smoke to clear?

I think the second course of action is far more likely. If I order now, or during the pendency of any appeals, I am subject to being whipsawed by any stay that might be entered by the Appellate or Supreme Court, as well as by any adverse ruling upholding the tariffs by either court, and further by the likely continuing efforts of the Administration to evade the ruling. And even if the Supreme Court ultimately agrees with the Court of Claims, T—-p is notorious for stiffing counterparties, so I would expect to go through months if not years of dilatorious litigation just to get my improperly paid tariffs back. Thus the safer course is to wait until I have certainty.

We live in interesting times. In any event, my suspicion is that the downstream effects of Tariff-palooza! will continue.

Jobless claims: unresolved post-pandemic seasonality appears once again


 - by New Deal democrat


One of the main reasons I include the last two years when I write about initial and continued jobless claims is that a distinct unresolved post-pandemic seasonality has developed. Even after seasonal adjustment, claims have tended to rise in the late spring towards the summer, and then decline beginning in late summer towards the winter.


That was manifested in this week’s numbers. Initial claims rose 14,000 to 240,000, one of the highest readings in the past six months. The four week moving average declined -250 to 231,750, also at the high end of the pat six months’ readings. Continued claims, with the usual one week delay, rose 26,000 to 1.919 million, after a -10,000 revision to last week’s number:


As usual, the YoY% change is more important for forecasting purposes. And as has been the case almost universally for the past six-eight months, the comparisons are higher by single digits. Initial claims were higher by 8.6% YoY, the four week average higher by 3.9%, and continuing cliams higher by 6.7%:


This continues the pattern of forecasting continued growth in the immediate future, albeit weak.

Finally, with the jobs report coming out next week, let’s update the forecast for the unemployment rate. Below I show the YoY% comparisons of intiai claims, total jobless claims, and the unemployment rate (red). In gray I also show the absolute unemployment rate (right scale):


The YoY% changes in initial and total jobless claims have been amazingly consistent in the past eight months, centered on a 5% increase, plus/minus 5%. One year ago the unemployment rate was 4.0%. This suggests the unemployment rate is most likely to hold steady at 4.2%  (i.e., 4.0 * 1.05) +/-0.1% in the next few months.

Wednesday, May 28, 2025

Updating the status of tariff-palooza!


 - by New Deal democrat


There’s no significant new economic data today, so let’s take an updated look at the downstream effects on the supply chain and retail sales so far from T—-p’s tariffs.


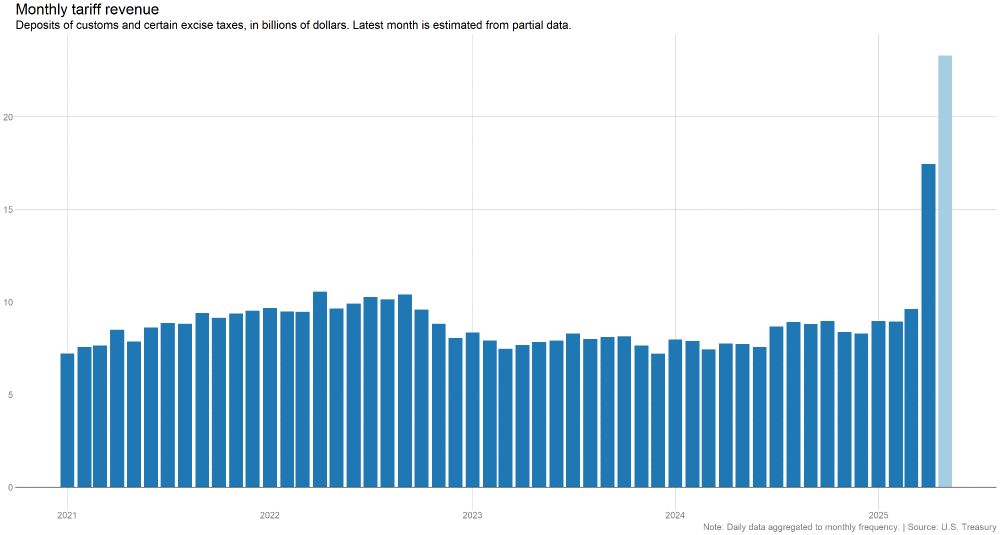
To begin with, at least some of the tariffs are indeed in effect. Here is a graph from Ben Casselman of The NY Times:


Not only was there a sharp increase in April, but in May so far he reports that the government is on track to collect $23 Billion in tariffs, which he says is about 3x the revenues compared with May last year.

That revenue is coming out of corporate profits and/or consumers’ pockets, depending on how much companies are able to pass on vs. eat.

Let’s start looking at the supply chain with this graph from Torsten Slok of Apollo Investments via Carl Quintanilla showing trans-Pacific ships sailing from China to the US:


For the last three weeks, this shipping has been at or very close to 12 month lows, despite the “pause” in the trade war. As one wag said, “it’s almost as if companies cannot make any near-term plans” because the situation might change at any moment.

Downstream of that are arrivals at US ports. The port of LA updates its inbound container count every week, including scheduled arrivals over the next three weeks. Here is its latest, through June 14:


Since the week of April 26, with one exception - that corresponds with the brief revival of trans-Pacific shipping in early May - every week has shown a decrease from the corresponding week in 2024. Cumulatively so far in the seven weeks since, scheduled arrivals have totaled 611,000 TEU’s, vs. 679,000 in 2024, an exact -10.0% decline.

Once containers arrive at US ports, the next step is shipping via rail (usually) or truck (typically for shorter hauls). While I am not aware of any weekly or similar data for truck volumes, the AAR does update intermodal traffic every week. Here is its YoY data for intermodal rail traffic through the week of May 3:


Note that rail traffic typically bottoms at about the end of March, and begins rising all the way towards the Holiday Season beginning in April. By contrast, this year intermodal traffic continued to trend downwards in April.

And although it isn’t shown in the graph above, in the two weeks since that trend has continued. For the week of May 10 there were 273,000 intermodal containers, a YoY increase of 5.7%. For the week of May 17 it was 262,000, a mere 0.3% increase YoY.

In May and June of last year, weekly rail intermodal loads averaged about 285,000. If we extrapolate from the -10% YoY decline in port traffic, that brings us down to about 255,000 loads. The AAR will report traffic for the week of May 24 tomorrow, and it could very well show the first outright YoY decline.

What about producers of goods and services in the US? For that we can turn to the regional Fed manufacturing and non-manufacturing indexes. So far in May All 5 regional manufacturing surveys have been reported, and all but the Texas services survey. Both types of surveys showed improvements from April, by an average of +2 (for new manufacturing orders) and +4 (for services conditions) respectively, but the actual conditions of both showed continued contraction, by -6 and -9 respectively. In other words, both sectors were contracting, but at a slower pace.

I am also unaware of any high frequency data on store inventories. But Redbook does publish weekly retail sales updates, and updated for the week of May 24, showing a 6.1% YoY increase:


This continues the trend of comparatively strong YoY increases that began in April. Undoubtedly some of this was front-running by customers who decided to make anticipated purchases in advance of tariffs. But by now some of this increase is probably consumers’ paying the increased costs due to price hikes.

It’s possible that Redbook’s universe is mainly non-durable purchases. I mention this because I had a conversation over the weekend with a neighbor who is in charge of the service department at a local Honda dealership. He reported that after a strong early April, bookings for repairs fell sharply in the past few weeks, which he attributed to customers being unwilling to incur major expenses in view of impending general tariff-related  price hikes. If that is true, it *may* show up in Friday’s personal spending report, but since that will be for April more likely it will not show up yet.

Finally, let me close with an update of my “quick and dirty” economic forecasting indicator. This consists of (1) whether the stock market is down YoY; AND (2) whether the four week average of initial jobless claims is higher by 10% or more YoY. If both of those obtain for more than a couple of weeks, it is very likely that a recession is about to start. Here it is:


No sign of a tariff-palooza! recession is indicated. At least, not yet.

Tuesday, May 27, 2025

Repeat home sales through March confirm continued deceleration of price increases


 - by New Deal democrat


Last week the existing home sales report showed continued deceleration in YoY price increases to 1.8%, indicative of the ongoing rebalancing of the housing market. This morning’s repeat home sales reports from the FHFA and S&P Case Shiller confirmed that deceleration and ongoing rebalancing.

On a seasonally adjusted basis, in the three month average through March, the Case-Shiller national index (light blue in the graphs below), showed a declne of -0.3%, and the somewhat more leading FHFA purchase only index (dark blue) declined -0.1%. These monthly changes were the lowest since late 2022 [Note: FRED hasn’t updated the FHFA data yet]:


On a YoY basis, price gains in both indexes also showed continued deceleration, as the Case Shiller index declined -0.5% YoY to a 3.4% gain, and the FHFA index declined by -0.4% YoY to a 3.5% YoY increase:


Because house prices lead the measure of shelter inflation in the CPI, specifically Owners Equivalent Rent by 12-18 months, the above graph also shows that measure of shelter inflation (red, *2.5 for scale). The FHFA and Case Shiller reports this month adds to the evidence that OER will trend gradually towards roughly a 3.5% - or even 3.0% - YoY increase in the months ahead. Indeed, the last time the Case-Shiller and FHFA Indexes were in this range YoY (2019) (not shown), Owners Equivalent rent gradually declined in the 12-24 months thereafter to the +2% YoY level (5% in 2021 as shown in graph)

Last month I noted that the most leading rent index, the Fed’s experimental all new rental index (not shown), showed a median YoY *decrease* in new apartment rents of -2.2% YoY, with all rents including existing rentals increasing at a rate of +3.3% YoY in Q1. So this morning’s repeat home sales price reports were in line with that good report as well.

The only bad news is that as a result Tariff-palooza!!, interest rates including mortgage rates have moved higher:


In fact on Friday, the daily update showed mortgage rates back slightly over 7%. Which suggests that part of the ongoing deceleration in home price increases is likely to be demand destruction.

Monday, May 26, 2025

Memorial Day 2025: “that these dead shall not have died in vain”


 - by New Deal democrat


From Lincoln’s Gettysburg Address:

“… [O]ur fathers brought forth on this continent, a new nation, conceived in Liberty, and dedicated to the proposition that all men are created equal.

“Now we are engaged in a great civil war, testing whether that nation, or any nation so conceived and so dedicated, can long endure…. We have come to dedicate … a final resting place for those who [ ] gave their lives that that nation might live. It is altogether fitting and proper that we should do this.

“But, in a larger sense, we can not dedicate-we can not consecrate-we can not hallow-this ground. The brave men, living and dead, who struggled here, have consecrated it, far above our poor power to add or detract. The world … can never forget what they did here. It is for us the living to be here dedicated to the great task remaining before us-that from these honored dead we take increased devotion to that cause for which they gave the last full measure of devotion-that we here highly resolve that these dead shall not have died in vain-… that government of the people, by the people, for the people shall not perish from the earth.”


[Above photo: Gettysburg National Cemetery]