Saturday, May 6, 2023

Weekly Indicators for May 1 - 5 at Seeking Alpha


 - by New Deal democrat


My “Weekly Indicators” post is up at Seeking Alpha.

Stock prices had been in an uptrend since last October, but on a three month basis that trend has now been broken. Meanwhile several measures of income and consumption have softened even further, without quite rolling over.

As usual, clicking over and reading will bring you up to the virtual moment as to all of the important economic trends, and reward me a tiny little bit for collating and organizing the information for you.

Friday, May 5, 2023

April jobs report: deceleration continues, with sharp downward revisions to previous months’ gains


 - by New Deal democrat


My focus for this report continued to be whether the leading sectors and other indicators  continued to decline, and whether the pace of growth continued to decelerate.

While the deceleration in growth did occur - and substantially so - the leading sectors were decidedly mixed, with some - notably the unemployment and underemployment rates - actually improving.

Here’s my in depth synopsis.


HEADLINES:
  • 253,000 jobs added. Private sector jobs increased 230,000. Government jobs increased by 23,000. 
  • BUT, February was revised down by -78,000, and March by -71,000, for a total of -149,000. At +165,000, March is now the lowest reading since December 2020, and the three month moving average of growth declined by over -100,000 from 345,000 before revisions to 222,000, again the lowest since the end of 2020.
  • The alternate, and more volatile measure in the household report rose by 139,000 jobs.
  • Despite this, the U3 unemployment rate declined -0.1% to 3.4%. This is because the civilian labor force, the denominator in the figure, declined by -43,000
  • U6 underemployment rate also declined -0.1% to 6.6%.

Leading employment indicators of a slowdown or recession

These are leading sectors for the economy overall, and help us gauge how much the post-pandemic employment boom is shading towards a downturn.  These were decidedly mixed:
  • the average manufacturing workweek, one of the 10 components of the Index of Leading Indicators, was unchanged at 40.6, down -1.0 hours from February peak last year of 41.6 hours.
  • Manufacturing jobs increased by 11,000.
  • Construction jobs increased by 15,000.
  • Residential construction jobs, which are even more leading, declilned by 1,800. It appears likely that January was the peak for this sector.
  • Temporary jobs, which have generally been declining late last year, declined further, and sharply, by -23,500.
  • the number of people unemployed for 5 weeks or less declined -436,000 to 1,866,000.

Wages of non-managerial workers
  • Average Hourly Earnings for Production and Nonsupervisory Personnel increased $.11, or +0.5%, to $28.62, a YoY gain of 5.0%, the lowest YoY gain since June of 2021.

Aggregate hours and wages: 
  • the index of aggregate hours worked for non-managerial workers declined -0.2%.
  •  the index of aggregate payrolls for non-managerial workers rose 0.3%, but continued its deceleration to 6.7% YoY, the lowest since March 2021, although still 1.7% higher YoY than inflation as of the last reading.

Other significant data:
  • Leisure and hospitality jobs, which were the most hard-hit during the pandemic, rose 31,000, -402,000, or -2.4% below their pre-pandemic peak.
  • Within the leisure and hospitality sector, food and drink establishments added 26,800 jobs, and are now only -87,100, or -0.7% below their pre-pandemic peak. 
  • Professional and business employment rose 43,000. This series has also been decelerating, and is now up 2.3% YoY.
  • The Labor Force Participation Rate was unchanged at 62.6%, vs. 63.4% in February 2020.
  • The number of job holders who were part time for economic reasons declined -199,000.
  • Those not in the labor force at all, but who want a job now, increased 346,000 to 5.271 million vs. its best level of 4.761 shortly before the pandemic.


SUMMARY

This was a very mixed report. The biggest positives were the increases in manufacturing and construction jobs. Nominal wage growth, while decelerating, continues to be strong. And both the unemployment and underemployment rates tied their multi-decade lows.

The negatives included the reasons *why* the unemployment and underemployment rates were so low: the labor force itself declined, while those who weren’t in the labor force but want a job increased. Temporary jobs and residential construction jobs continued to decline, the former sharply. And perhaps most important of all: for the second month in a row, we have had sharp downward revisions to the previous two months’ numbers. This is something that tends to happen as a recession is about to start, or has already started.

The theme remains deceleration, but no downturn yet.

Thursday, May 4, 2023

Jobless claims hoist yellow flag again; employment and unemployment likely to show further deceleration tomorrow


 - by New Deal democrat


Initial jobless claims rose 13,000 to 242,000 last week, while the 4 week average rose 3,500 to 239,250. Continuing claims, with a one week lag, declined -38,000 to 1.805 million:


This is right in the range of the past 2 months.

YoY initial claims are up 11.0%, the 4 week average is up 10.8%, and continuing claims are up 20.5%:


This is enough to reinstate the “yellow flag” caution, but not across the 12.5% boundary where I would begin to hoist the “red flag” recession warning.

Tomorrow morning we will get the April jobs report, and since initial claims are a leading indicator for the unemployment rate (red in the graph below), here’s what that looks like for the past 18 months:


Initial claims are clearly forecasting an increase in the unemployment rate by 0.2%-0.3% over the next few months, but whether or not there will be an increase tomorrow is impossible to know. But they do certainly suggest there will be no *decrease* in the unemployment rate.

Meanwhile, since real retail sales (showing consumption; blue in the graph below) are a leading indicator for employment (red), here’s the latest update on that comparison:


The gold line represents the quarterly change (*4 to estimate the annualized rate) in job growth.

Real retail sales are plainly forecasting continued deceleration in jobs growth. Deceleration in the YoY rate, as well as deceleration in q/q growth suggests a gain of less than 325,000 tomorrow. A negative outlier would be anything less than 200,000.

Additionally, tomorrow I’ll be looking for continued deterioration in the leading sectors of manufacturing, construction, and temporary employment, along with the manufacturing workweek and an increase in short term unemployment. 

Wednesday, May 3, 2023

The un(der)employment rate leads wage growth: 2023 update


 - by New Deal democrat


I had already planned on taking an updated look at wage growth today, but there was a little flutter on twitter about job openings and last week’s Q1 wage and benefits data, so that sealed the deal.


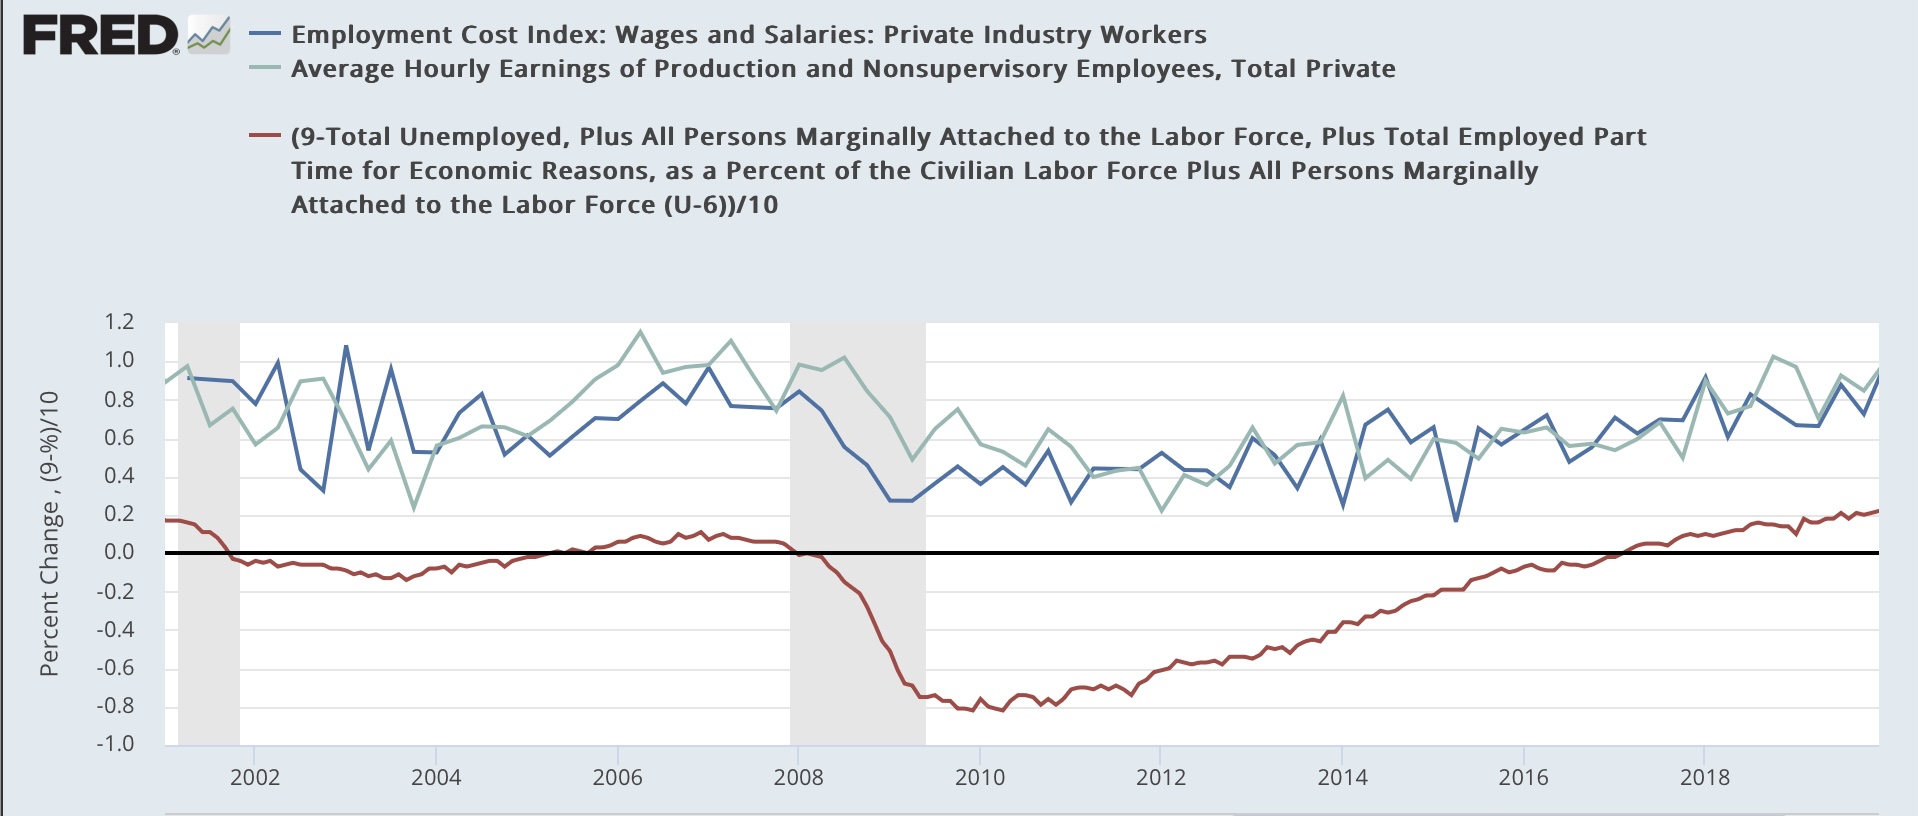
To wit: as I used to write many times during the last expansion, wage growth is a long lagging indicator. It tends to increase only after unemployment (or even better, underemployment) falls to a level where labor begins to have some bargaining power. For the underemployment rate, this was about 9%. It took over half a decade after the Great Recession for the U6 rate to hit that marker:


So the below graph subtracts the U6 rate from 9% (red), so that any rate lower than 9% shows as a positive, compared with the YoY% change in  average nonsupervisory wages (light blue) and wages measured by the quarterly employment cost index (dark blue):


Because the underemployment rate went to over 20% in the first few months of the pandemic, the below continuation graph eliminates those months and picks up in the last quarter of 2020:


As the labor market got tighter, wages growth continued to accelerate.

Economist Jason Furman made a similar point several days ago comparing the job openings rate with wage growth. Here’s his graph:


A graph of the quarterly % changes in wage growth in nonsupervisory wages and the employment cost index does not particularly correlate with the quarterly % change in job openings:


But the YoY% change in wages do correlate with the absolute level of job openings:


As the level of employment continues to reach post-pandemic equilibrium, the level of job openings will continue to decline, and the underemployment rate will likely increase. This will cause wage growth to decelerate as well.

Tuesday, May 2, 2023

March JOLTS report shows labor market about halfway to pre-pandemic normalization


 - by New Deal democrat


The title of this piece is an important to clue the relative nature of this morning’s Job Openings and Labor Turnover report for March.


For the last several years, the jobs market has been a game of “reverse musical chairs,” where there are always more chairs than participants. Those employers whose chairs weren’t filled had to increase their wage and/or benefits offerings, or go without. This was good for labor, but certainly put pressure on prices as well.

Because the jobs market has remained so strong, it has been unlikely that a recession would start unless the situation with job openings returned to at least close to its pre-pandemic levels. Only then could there be enough layoffs to actually be consistent with a negative monthly jobs number.

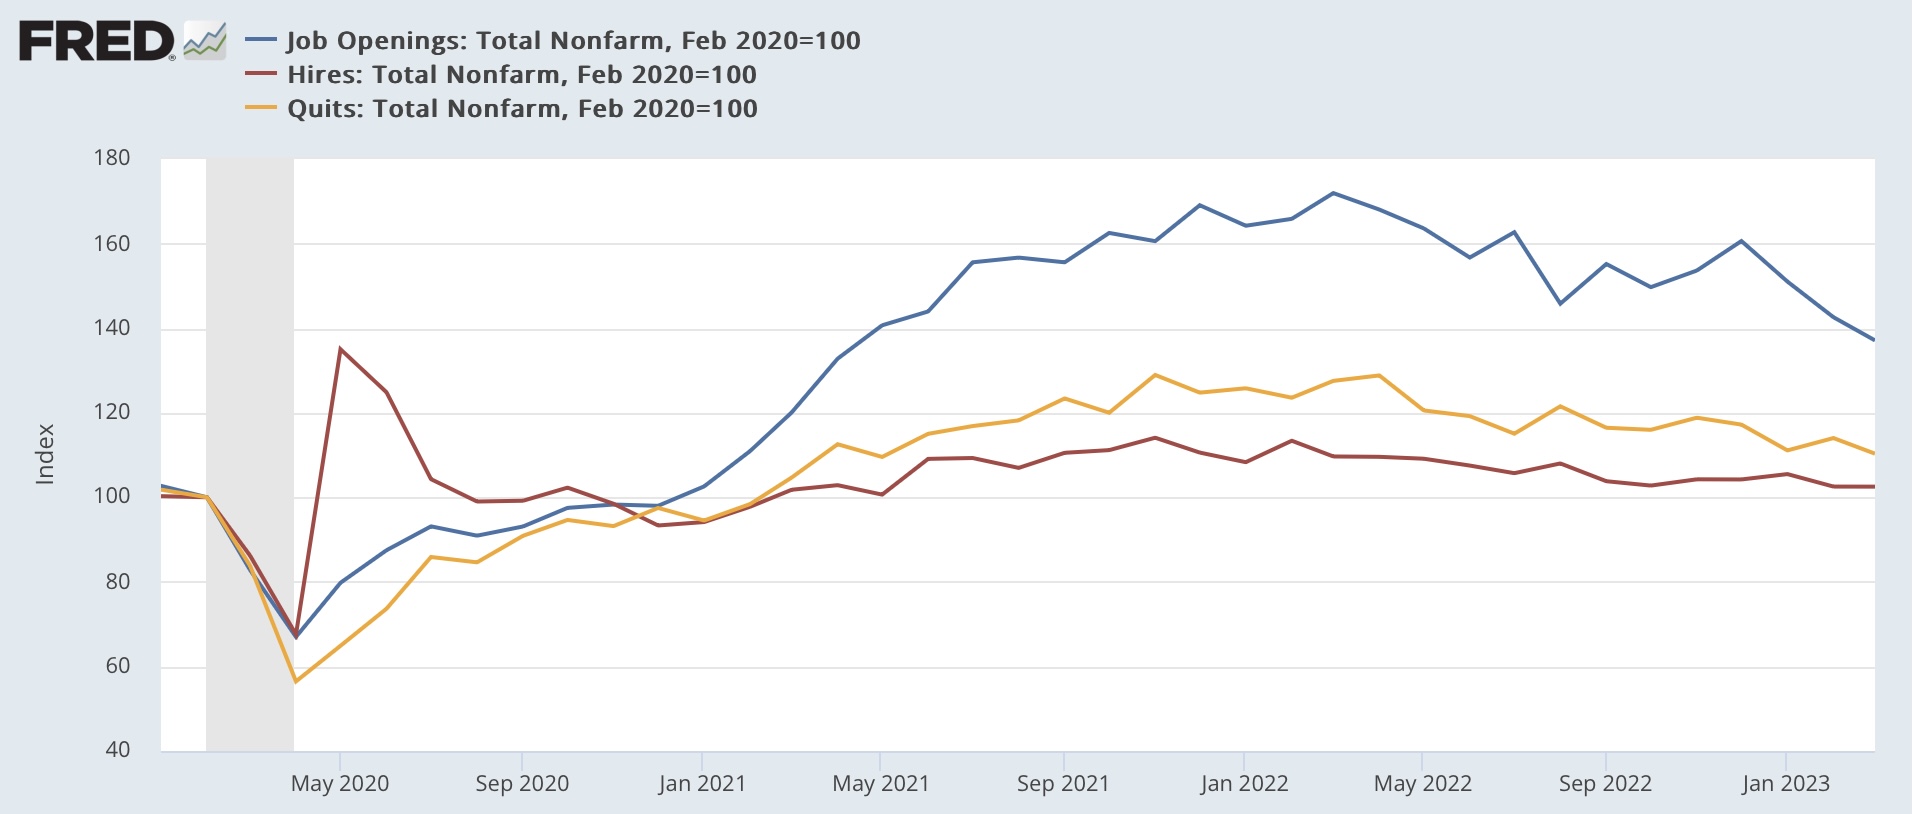
This morning’s report, as indicated in the title, indicates we are about half the way there. Job openings (blue in the graphs below) declined -384,000 to 9.590 million annualized (from a peak of 12.027 million 12 months ago, vs. 7 million just before the pandemic), while actual hires (red) declined a whopping -1,000 to 6.149 million (vs. a peak of 6.843 million in November 2021 and 6 million just before the pandemic), and voluntary quits (gold) declined -129,000 to 3.851 million (vs. a peak of 4.501 million in November 2021 and 3.5 million just before the pandemic:


All of the above are at roughly 2 year lows. 

Here is the longer term view of all 3 metrics from the series inception, better to show the current situation with the historical one before the pandemic hit:


All three remain at levels higher than at any time before the pandemic hit.

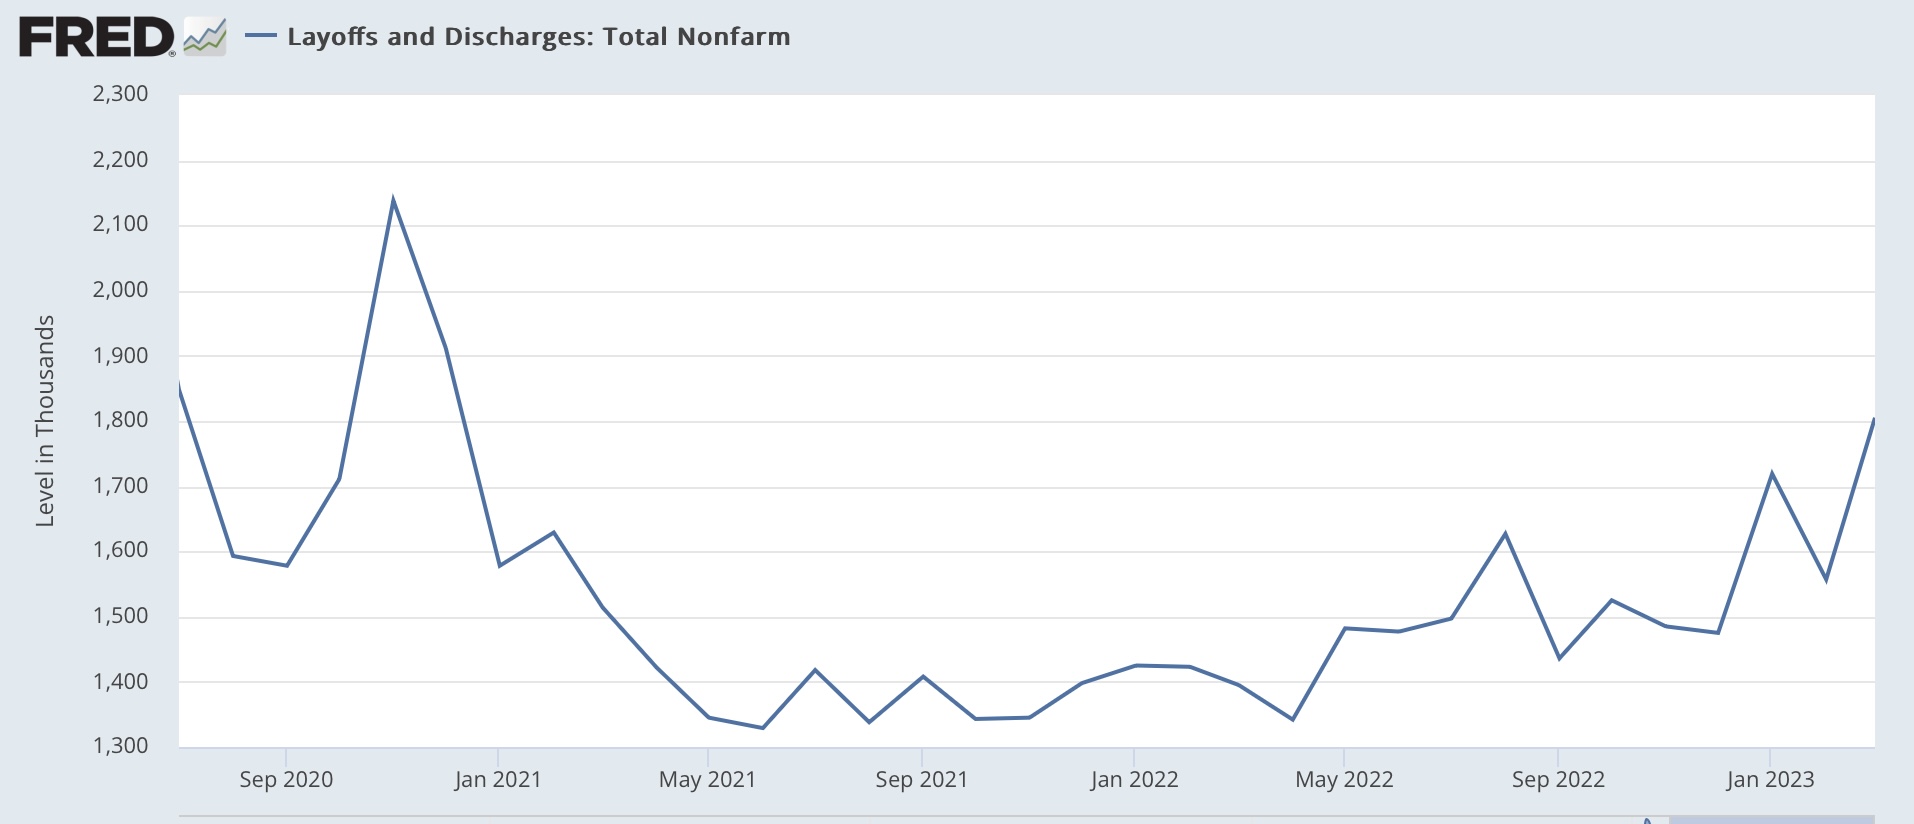
Additionally, layoffs and discharges increased 248,000 to 1.805 million annualized, also roughly a 2 year high):


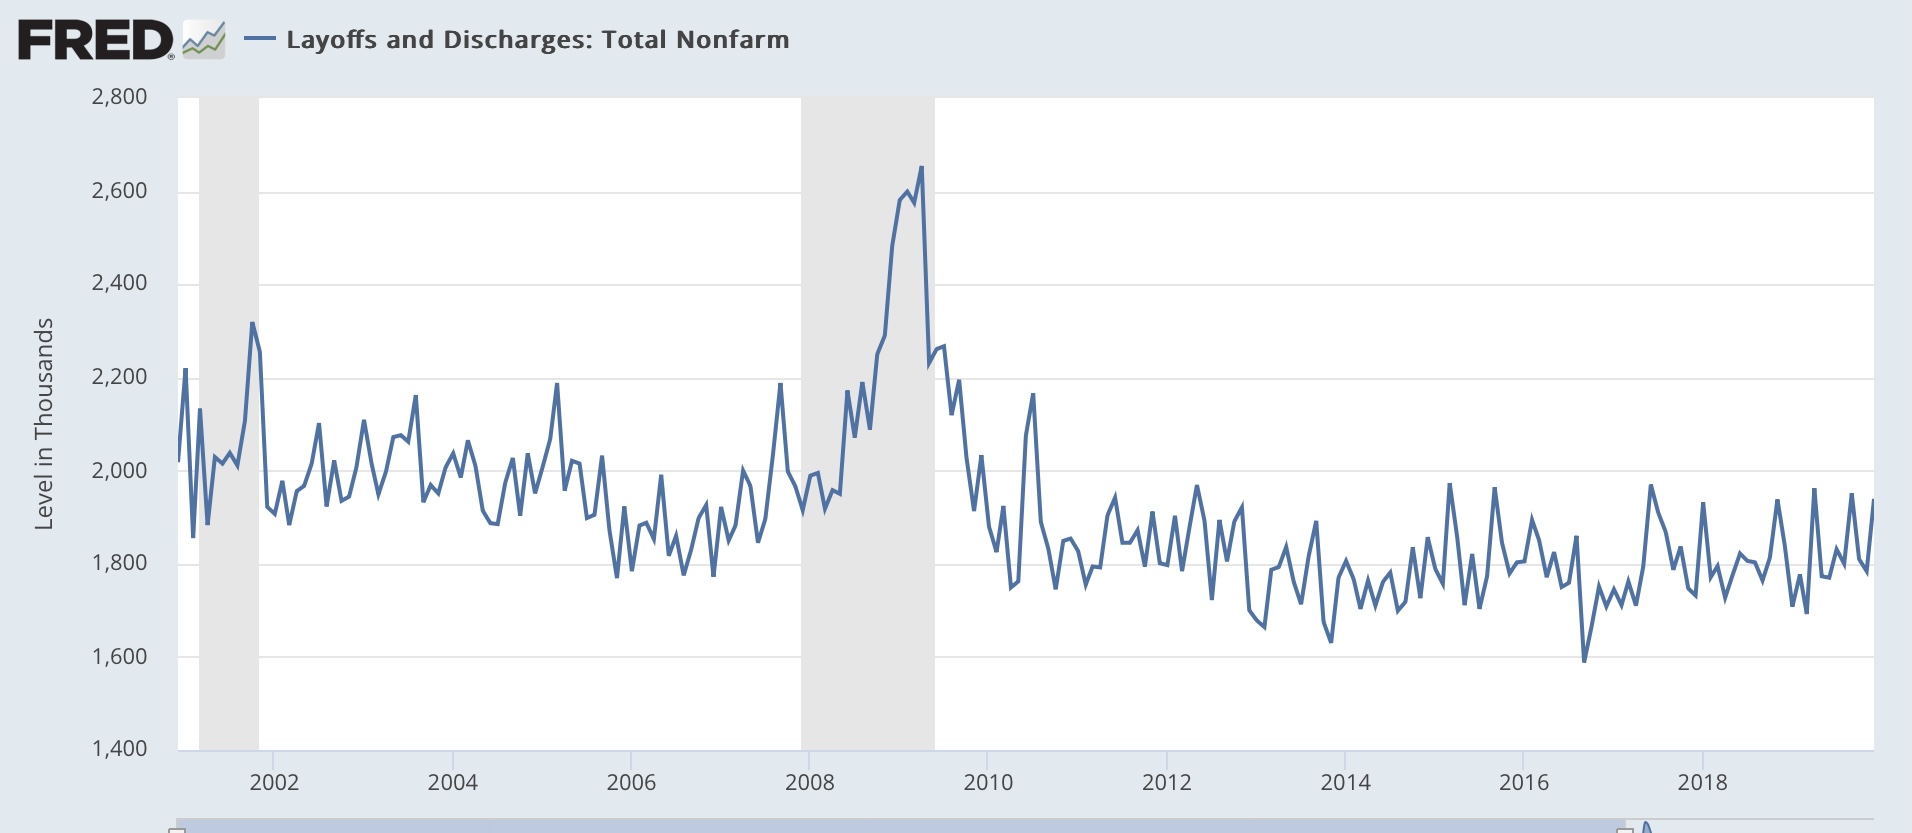
Here is the longer term historical record for layoffs. Note that before the pandemic, the current level would be quite low:


It would be wrong to simply project this month’s declines forward, but the overall trend is very clear.

All of the above remains consistent with a positive, even strong jobs report this coming Friday by historical standards. But, together with the increase in initial jobless claims (which are a leading indicator for the unemployment rate), it is likely that the report will be weak by the standards of the past 12 months, and the unemployment rate is more likely than not to increase.


Monday, May 1, 2023

Manufacturing and construction start out the month’s data to the negative side


 - by New Deal democrat


As usual, we start the month with reports on last month’s manufacturing, and construction from two months ago.

The ISM manufacturing index has a 75 year record of being a very reliable leading indicator. According to the ISM, readings below 48 are consistent with an oncoming recession. And there, the news is not good. Not only has the index been below 50 for the past 6 months, it has been below 48 for the past 5, even though in April it rose from 46.3 to 47.1. Just as bad, the new orders subindex, which is the most accurately leading component, has been in contraction since last summer, although it too rose in April from 44.3 to 45.7:


Needless to say, this indicator has been forecasting and continues to forecast recesion.

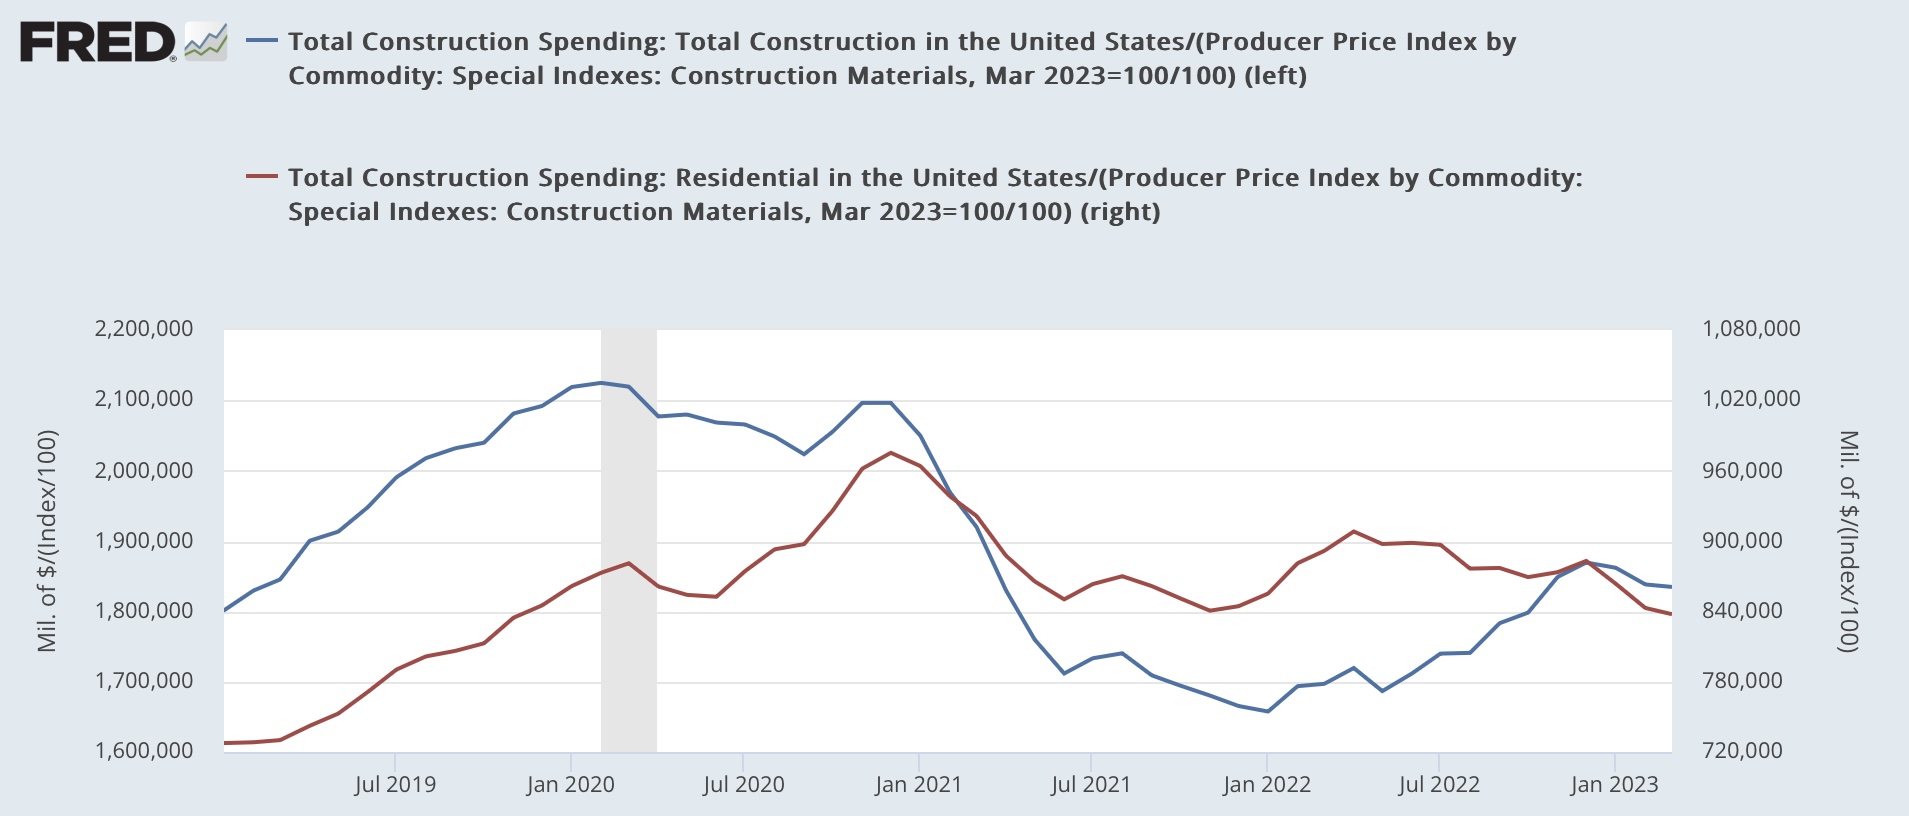
Construction was mixed, but the most leading component continued to contract as well. Total construction rose 0.3% nominally in March, but only after February was revised significantly downward. But residential construction spending declined -0.2%:


For the past several years, I have been adjusting the nominal numbers by the PPI for construction materials. This had been declining, but rose 0.5% in March, which means that the deflated number for total construction declined, and that for residential construction declined even more:


Not an auspicious start to the month; with the significant caveat that these two sectors make up less of the economy than they used to several decades ago, and as we saw last Friday, consumer spending on services, while decelerating, remained historically strong.


Saturday, April 29, 2023

Weekly Indicators for April 24 - 28 at Seeking Alpha


 - by New Deal democrat


My Weekly Indicators post is up at Seeking Alpha.

Several important short leading indicators rallied this week. In particular, the stock market seems to think the worst is over (for the moment!).

At the same time, several important coincident indicators of taxation and employment are on the cusp of rolling over again.

As usual, clicking over and reading will bring you up to the virtual moment on all of the crosscurrents in the economy, and reward me a little bit for collecting and organizing all of the metrics.

Friday, April 28, 2023

A mixed picture on real personal income, savings, and spending in March, and real total sales in February


 - by New Deal democrat


As I’ve indicated a number of times recently, right now I consider the report on personal income and spending co-equal to the employment report as the most important monthly data. For March, it was a mixed bag.


Nominally, personal income rose 0.3%, and personal spending was unchanged. Because the applicable deflator rose 0.1%, real personal income rose 0.2%, and real personal spending declined less than -0.1% (also rounding to unchanged) for the month.


Since the pandemic began, real income is up 4.0%, and real spending is up 7.6%. Because much of this was distorted by several rounds of stimulus, here’s the view normed to 100 as of July 2021:


Real personal spending has risen fairly consistently, while real personal income fell and then rose again with the rise and fall of gas prices last year:


Additionally, the pesonal savings rate rose slightly again to 5.1%, which is good for individuals, but due to the “paradox of saving,” bad for the economy as a whole.

Digging in to some further details, there was much dancing around the maypole yesterday that real spending in the Q1 GDP report was up 3.4%, a very healthy number. But I noticed that the quarterly increase was well below both the January and February monthly increases, so I suspected we would see either a big decline or some significant downward revisions today - and we did, especially for February, as shown below:


Basically, extra seasonal distortions around the post-pandemic Holidays gave us a big downdraft in November and December, and a big updraft in January. Compared with September and October, February and March were only up +0.6%.


Further decomposing real personal spending by types of purchase, we see that real spending on non-durable goods since July 2021 has actually declined, while total spending on goods is only up 1%. The big increases since July 2021 have been on services, and on durable goods (mainly cars), which declined sharply in November and December and then rose sharply in January:


In other words, the lion’s share of the big quarterly jump in consumer spending in yesterday’s GDP report was a spending spree on cars in January, driven by seasonal distortions.

Finally, let’s turn to the indicators that the NBER uses to determine the onset of and end of recessions, two of which were updated this morning.

The good news is that real personal income less government transfers (red in the graph below) rose 0.3% in March to a new high. The bad news is that real manufacturing and trade sales (blue) for February declined -0.4% from their recent high in January:


Note that industrial production, perhaps the most important coincident indicator, remains down about -0.5% from its September peak. On a YoY basis, real personal income less government transfers is up 2.1%, real manufacturing and trade sales are up 0.1%, and industrial production is up 0.5%:


The historical record going back over half a century shows that when all three of these coincident indicators have been at the YoY levels they are now, with one exception we have already started a recession:


The sole exception was 1989, when we were 6 months away.

To sum up: there was good news on real personal spending on services, and on real personal income less government transfers. Depending on further revisions, it is unlikely that the NBER will ignore growing nonfarm payrolls and declare that there was a cyclical peak in January.

But the news of real personal spending on goods was negative, as were real manufacturing and trade sales for February. Personal savings increased, consistent with consumers becoming more cautious in advance of a recession. And yesterday’s good Q1 GDP news on consumer spending turns out mainly to have been a car-buying spree in January.

Thursday, April 27, 2023

Leading components of Q1 GDP paint a mixed picture


 - by New Deal democrat


As you probably already know, real GDP increased 1.1% at a seasonally adjusted annualized rate in Q1. This doesn’t necessarily mean that the economy improved throughout the period. The median GDP for the quarter where post WW2 recessions have begun was +2.4%, and there are reasons to believe that the reason for the positive number in Q1 was big January gains. We’ll find out tomorrow with personal income and spending, and real business sales, whether these were reversed in the following two months.

While GDP by and large is a look in the rear view mirror, there are two leading components. First, private residential investment as a share of GDP is a long leading indicator popularized over 15 years ago by Prof. Edward Leamer. It tends to turn down 6-7 quarters before a recession hits. It is even slightly more leading when calculated in real inflation-adjusted terms. Unsurprisingly, in Q1 of this year this declined again, although less so than in the last several quarters, whether measured nominally or in real terms:


Secondly, proprietors’ income (light and dark blue in the graph below), a proxy for corporate profits (light and dark red), which won’t be reported for another month, were up +0.2% nominally, and +3.9% without inventory valuation:


But the “official” leading metric uses unit labor costs as a deflator, which we also don’t know yet, so I’ve substituted the implicit GDP deflator as a temporary fix: 


So adjusted, proprietors’ income declined -0.7% for the quarter with the inventory adjustment, but increased 3.2% without it.

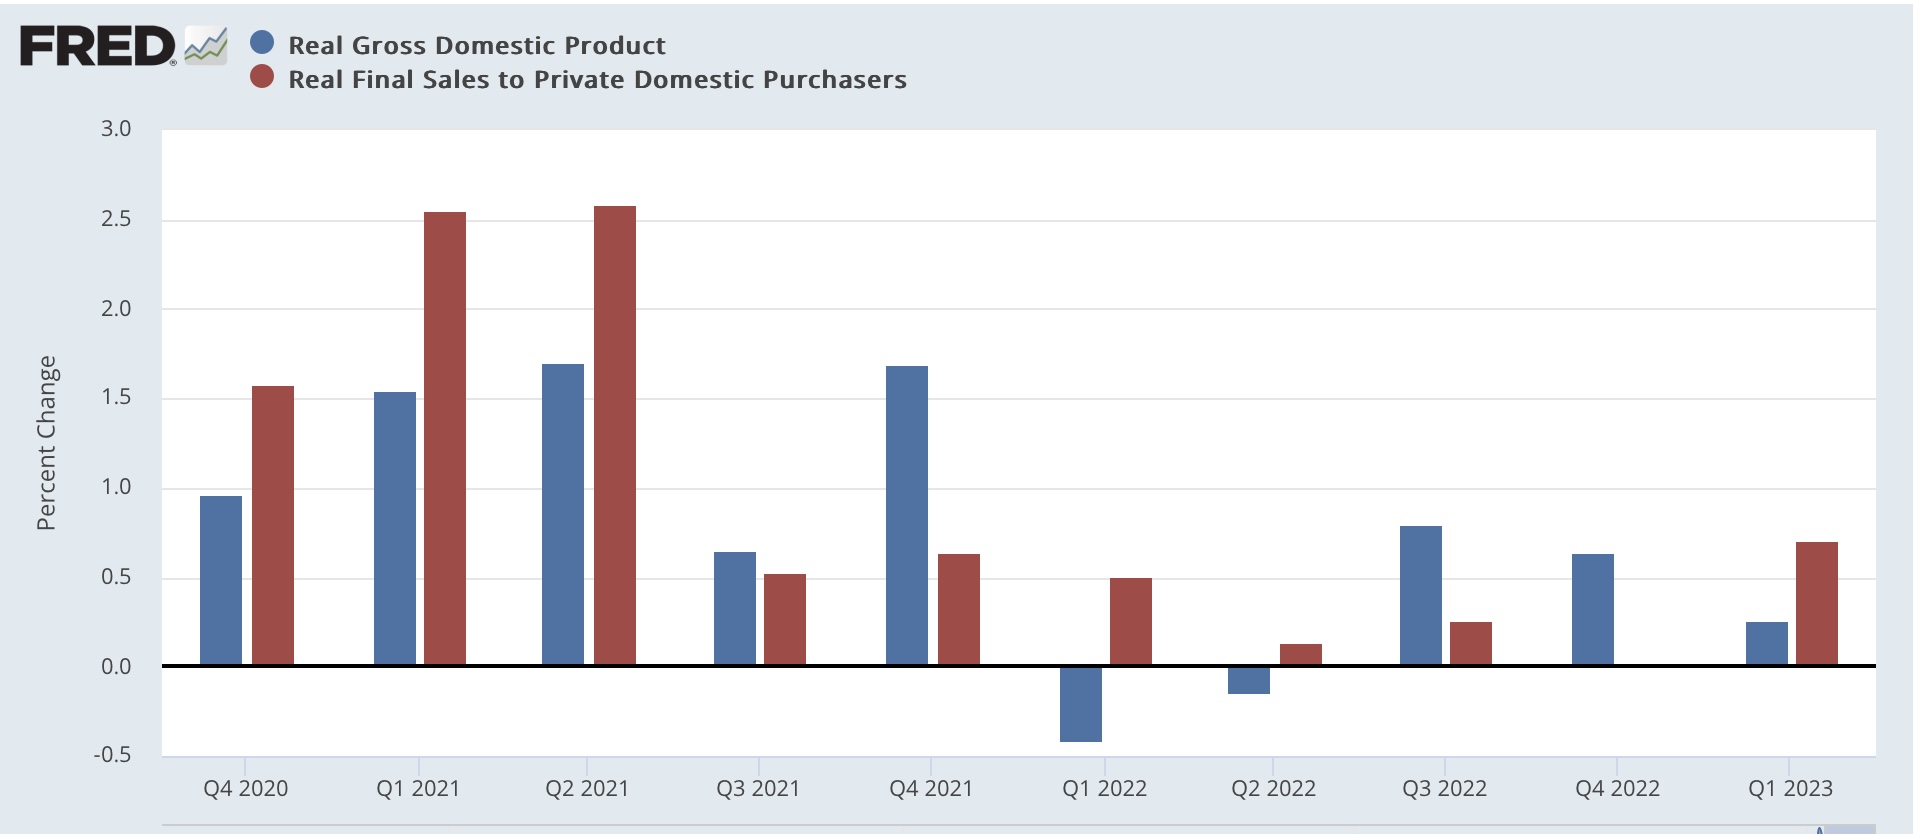
Finally, last month I noted that real final sales at levels as low as it had been in Q4 were typically seen within 3 quarters of the onset of a recession. These did improve in Q1, but don’t undo the negative inference going forward:


Overall, this is a mixed picture, but still tending to the negative in terms of implications for the near future.


Four week average of initial claims drops below “yellow flag” level, for now


 - by New Deal democrat


While GDP will get the lion’s share of attention today (and I’ll post on it later on), by and large it is a look in the rear view mirror. The more forward-looking data is weekly jobless claims.

This week initial claims declined -16,000 last week to 230,000. The more important 4 week average declined -4,000 to 236,000. Continuing claims, with a one week lag, declined -3,000 to 1.858 million:


More importantly for forecasting purposes, YoY initial claims were up 11.1%, the 4 week average up 9.8%, and continuing claims up 22.1%:


That the 4 week average declined below 10% removes the “yellow flag” recession caution for the moment, although the increase in continuing claims is consistent with a recession in the immediate future.


Wednesday, April 26, 2023


 - by New Deal democrat


Aside from the monthly jobs report, at this time imo the most important economic data will be issued this Friday: namely, real personal income and spending, the deflators of which also figure in the calculation of real manufacturing and trade sales.  That’s because, while real *consumer* spending of goods has been flat to declining for a year, and manufacturing production has been flagging, real personal consumption of *services* has been running historically hot, while producer price deflation has helped buoy *producer* sales.

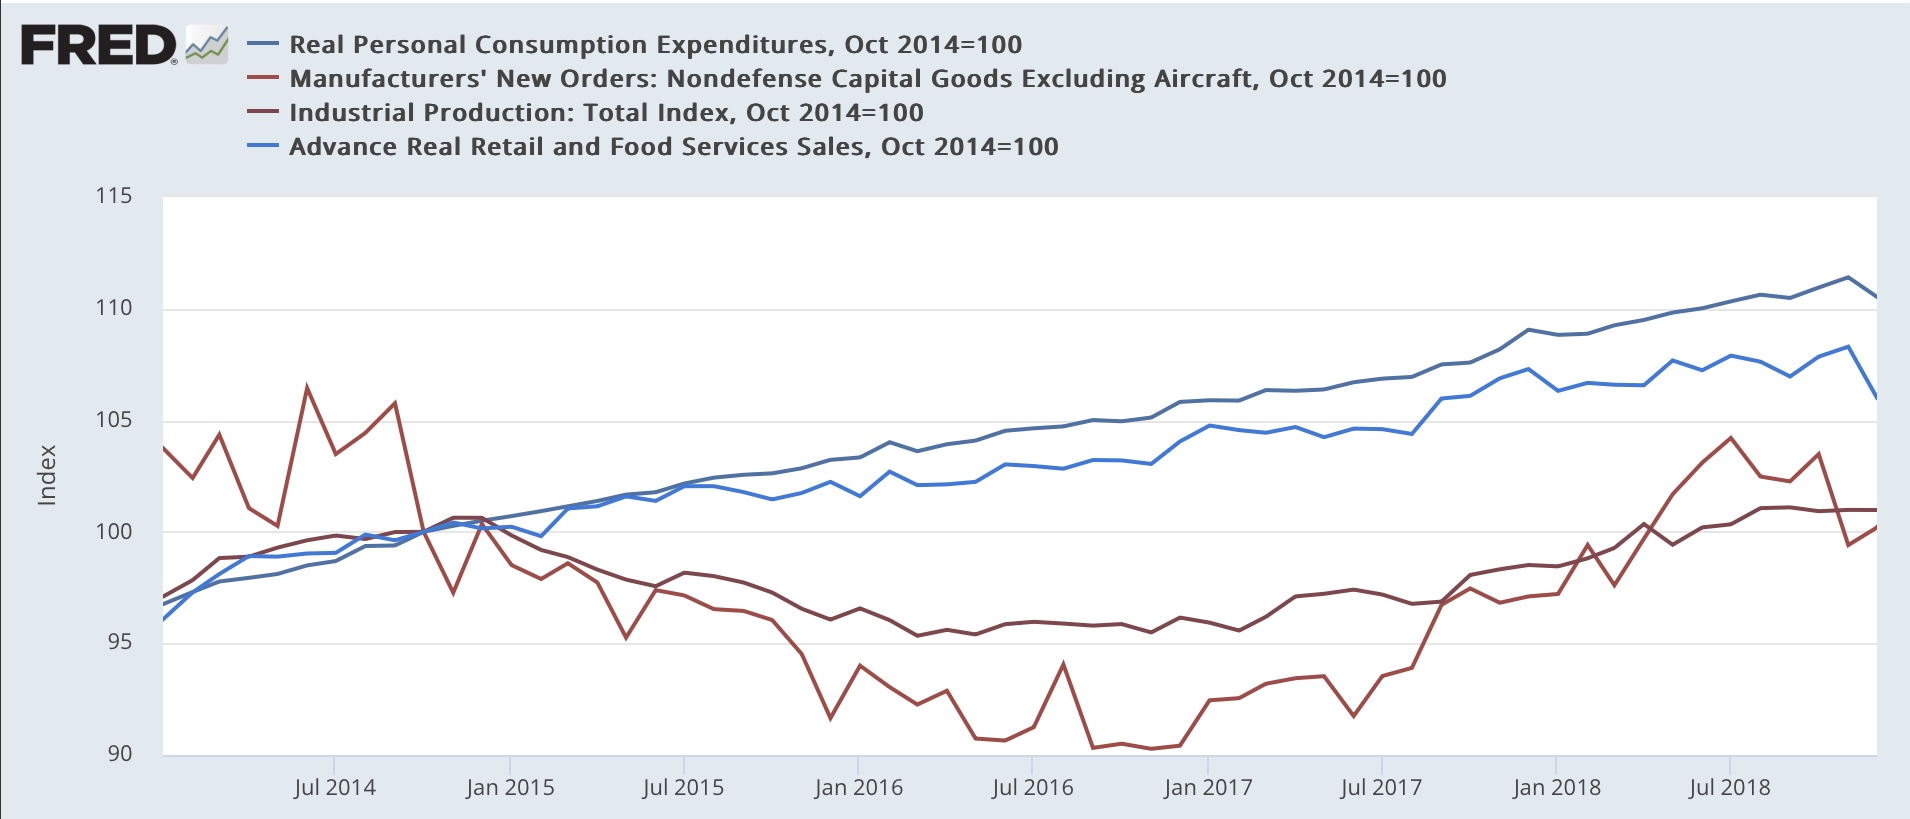
Let’s start with a follow-up on my note this morning on durable goods orders. I pointed out that in 2015-16 there was a “shallow industrial recession” which never brought down the economy as a whole. That’s because, while durable goods orders (bright red) and industrial production (dark red) both declined 10% or more during that period, consumer spending as measured by both real retail sales (light blue) and real personal consumption expenditures (dark blue) sailed right along:


Let’s compare that to our post-pandemic period. For roughly the past 18 months, both real retail sales have been flat or even slightly declining, both industrial production and durable goods spending have only in the past six months done the same. Meanwhile real personal consumption expenditures have continued to improve:


 Further dissection of personal consumption expenditures shows that *nominal* expenditures for goods has historically tracked very closely with *nominal* retail sales:


But the deflators for the two series are different, as a result of which *real* retail sales have not performed nearly as well as *real* personal consumption expenditures for goods:


Further, historically both real retail sales and real personal consumption expenditures for goods have turned down YoY both earlier and more deeply than real personal consumption expenditures for services (gold):


The same graph since the pandemic recession shows that YoY spending on goods is flat to declining in both series, while YoY real spending on services is still a historically robust 3%:


Finally, it’s worth pointing out again that personal saving tends to increase just before recessions, as consumers grow more cautious:


Note that this has already occurred in the past 6 months:

To return to my main theme, what has been so important about the reports on real personal spending and real manufacturing and trade sales is that (1) the deflators are more favorable to growth than in other “real” series; and (2) in particular, real spending on services has barely flagged at all.

On Friday I will be paying particular attention to whether or not this pattern continues, or whether real sales and real consumption at last turn down, and whether real consumption on services in particular decelerates significantly or not.

Transportation orders increase, but core capital goods orders decline further in March


 - by New Deal democrat


Durable goods orders increased in March by 3.2%, which sounds great, except that it was primarily transportation orders (Boeing). Core durable goods excluding transportation and defense declined -0.4%:


While both core and total durable goods orders are down from their peaks last year, joining the recent decline in residential construction among the leading sectors, neither are off nearly as much as their 10%+ declines in 2015-16 that at the time I labeled the “shallow industrial recession,” or their declines before the 2001 recession:


By contrast, the 2008-09 recession started off as a consumer-led downturn, where durable goods orders gave no advance warning.

This is important, because as the US in the past 40 years offshored most of its base manufacturing, that sector has had increasingly less impact on an economy that is now 70% consumer-driven.

The best foretaste of consumption is real retail sales. But the broadest measure is real private consumption expenditures, particularly for services, which will be reported in two days. I intend to post a heads-up on what to look for in that report later today.

Tuesday, April 25, 2023


 - by New Deal democrat


For the past few months I have speculated that home sales were bottoming. This morning’s report on March new home sales put an exclamation mark on that idea.

New home sales increased 57,000 in March (from a February level downwardly revised by -17,000) to 683,000 annualized (blue in the graph below). The increasing trend in sales from the bottom of 543,000 last July at this point seems crystal clear. As I have said many times, new home sales are very noisy, and very heavily revised, but frequently turn first. For confirmation, I use single family permits, which have very little noise and usually clear trends (red). And they are almost certainly confirming the trend from new home sales:


Since mortgage interest rates peaked last October, this is not surprising.

Meanwhile, just as we saw with the house price indexes earlier this morning, the median price of new homes increased slightly YoY for the second month in a row, now up +3.2% (gold, compared with the YoY% changes in new home sales, blue):


As is usual, prices have followed sales with a significant lag.


This is good news for the economy in 2024, as it tends to put a floor under any downturn later this year, suggesting that if there is a recession, it will be relatively brief and shallow (Fed permitting).


House prices on track to go negative YoY by summer, despite monthly increase in February


 - by New Deal democrat


House prices through February as measured by both the FHFA (gold in the graphs below) and Case Shiller (red) Indexes rose, the former by 0.5% (after a downwardly revised 0.1% in January), and the latter by 0.2% (after a -0.2% decline in January). Here’s what the monthly changes look like for each, as compared with Owners’ Equivalent Rent in the CPI (blue):


[Note that both house prices indexes are /2.5 for scale]. Since a year ago, both house price indexes were rising at almost 2% a month, the YoY% changes have continued to decelerate sharply:


The FHFA index is only up 4.0% YoY through February, while the Case Shiller is only up 2.1% YoY. At the rate of decline since last summer, the FHFA Index will be negative YoY by about June, and the Case Shiller Index could go negative YoY by next month’s report for March.

The implications for CPI is that the Owners’s Equivalent Rent component is likely to stabilize at current YoY levels for several more months before declinining, and CPI ex-shelter, which actually was slightly in *deflation* since last June as of the March report, will continue to be flat or lower.

Finally, while the increases in house prices have been quite small compared with the recent past, I was expecting a bigger decline from both indexes once the tide turned last summer. Undoubtedly the reason has a lot to do with the below graph, showing that while the active listing count of houses for sale has increased by over 50% since one year ago (teal), in absolute terms it is much lower than before the pandemic (blue); and indeed the new listing count has continued its almost relentless decline beginning 2 years ago, now down about -20% from a year ago:


The very low number of houses for sale puts a low ceiling on supply, meaning even normal demand can still create bidding wars.

That increasing interest rates is causing fewer houses to be put on the market, as potential move-up buyers do not want to trade 3% and 4% mortgages for 6% and 7% mortgages, creates quite a conundrum for the Fed.

Monday, April 24, 2023

Income tax withholding payments stumble again


 - by New Deal democrat


The important data this week will include new home sales tomorrow, Q1 GDP and initial jobless claims on Thursday, and most importantly of all (imo) real personal income and spending, along with real manufacturing and trade sales on Friday.

In the meantime, today let me take another look at a significant coincident indicator, income tax withholding payments, because the situation has changed in the past week.

Tax withholding payments have for years been employed as a proxy for jobs. Unfortunately, there’s no monthly or quarterly data published on FRED. The best representation is annual data from 1947 to 2020. Below I show the YoY% change in that annual data, adjusted for inflation, compared with the YoY% change (*3 for scale) in monthly nonfarm payrolls:


Because of a quirk in FRED graphing, it appears that jobs lag tax payments, but that’s just a byproduct of comparing monthly vs. annual data. Had I used annual payroll averages, the peaks and troughs would match exactly (but the jobs data would be less fine-grained). The bottom line is that, while the two haven’t matched exactly, especially in the 1980s, typically the increases and decreases move in tandem.

Turning to the present, last week I cited to the California Department of Revenue, showing that tax payments in that State had declined steeply compared with the prior fiscal year during the last four months of 2022, before stabilizing during the first three months of this year.

For the nation as a whole Matt Trivisonno has the YoY data, measuring the entire 365 day total of tax withholding vs. the entire previous 365 days, and has a public graph with a 3 month delay. Here’s his latest:


Like the California graph, it shows a steep deceleration during 2022, which had been as high as +21% YoY in March, down to only about +6% by the end of December. Thereafter through January, the YoY data stabilizes.

Indeed, by my own calculations, for the first three months of fiscal 2023 ending December 31, withholding tax payments were only up +1.2% YoY. But for Q2 they rebounded sharply, up +5.4% YoY. 

But in the last 10 days they have stumbled. For the first 14 withholding days in April, payments are down -3.4%, $189.7 Billion vs. $196.3 Billion one year ago. For the last 4 weeks as a whole, withholding payments are down -5.0%, $270.2 Billion vs. $284.5 Billion.

What is notable about that, in addition to including the April 18 deadline for payment of taxes this year, is that the CA Department of Revenue had suggested that the late 2022 stumble was due to stock market declines meaning that stock options hadn’t vested.

Well, since last October the stock market has rallied, and last week was very close to an 8 month high:


Only a short term shortfall at this point, and of course it could reverse by the end of the month, but if stock options are vesting and withholding payments are still down, even before accounting for inflation, that suggests renewed trouble in the jobs market.


Sunday, April 23, 2023

The last dissent of Thurgood Marshall: the Rule of Law vs. the transitory Edicts of 5-4 Court majorities


 - by New Deal democrat


Daniel Kiel at the TPM Cafe, on the supreme differences between Clarence Thomas and his predecessor, Thurgood Marshall, writes:

“Thurgood Marshall, … in his final opinion before retiring after a quarter century on the court, [ ]warned that his fellow justices’ growing appetite to revisit – and reverse – prior decisions would ultimately ‘squander the authority and legitimacy of this Court….’”

This criticism has never seemed more on point than in the aftermath of Dobbs, as Red State Legislatures and Trumpy lower court judges swing for the fences to invite the obliteration of existing precedents.

Marshall’s final dissent occurred in the case of Payne v. Tennessee, a case that involved the scope of victim impact statements and testimony in the sentencing portion of capital murder trials. A badly splintered Court in that case overruled two previous 5 to 4 rulings that were less than 10 years old to hold expansively in favor of the prosecution. The various plurality, concurring, and dissenting opinions all dealt extensively with the doctrine of stare decisis, which simply means that decisions that have already been made should be left in place.

Stare decisis was important to Hamilton’s rebuttal to Brutus in Federalist #78, the essay that famously claimed that the judiciary would be “the least dangerous branch.” He wrote that:

“To avoid an arbitrary discretion in the courts, it is indispensable that they should be bound down by strict rules and precedents, which serve to define and point out their duty in every particular case that comes before them; and it will readily be conceived from the variety of controversies which grow out of the folly and wickedness of mankind, that the records of those precedents must unavoidably swell to a very considerable bulk”

This was central to Hamilton’s argument. He believed that as time went on, the Supreme Court would be increasingly hemmed in by precedents, and thus unable to enact their ideological whims or prejudices. 

Well, we know how that has worked out, don’t we?

But back to Marshall’s last dissent. The crux of his argument is:

“the majority declares itself free to discard any principle of constitutional liberty which was recognized or reaffirmed over the dissenting votes of four Justices and with which five or more Justices now disagree. The implications of this radical new exception to the doctrine of stare decisis are staggering. The majority today sends a clear signal that scores of established constitutional liberties are now ripe for reconsideration, thereby inviting the very type of open defiance of our precedents that the majority rewards in this case….

“The overruling of one of this Court's precedents ought to be a matter of great moment and consequence. Although the doctrine of stare decisis is not an ‘inexorable command,’ [citation omitted] this Court has repeatedly stressed that fidelity to precedent is fundamental to ‘a society governed by the rule of law,’ [citations omitted] ‘[I]t is indisputable that stare decisis is a basic self-governing principle within the Judicial Branch ….’

“…. By limiting full protection of the doctrine of stare decisis to ‘cases involving property and contract rights,’ [ ] the majority sends a clear signal that essentially alldecisions implementing the personal liberties protected by the Bill of Rights and the Fourteenth Amendment are open to reexamination. Taking into account the majority's additional criterion for overruling -- that a case either was decided or reaffirmed by a 5-4 margin ’over spirited dissen[t],’ [ ] -- the continued vitality of literally scores of decisions must be understood to depend on nothing more than the proclivities of the individuals who now comprise a majority of this Court.”

To be fair, where the 5 to 4 rulings are less than a decade old, Scalia’s response in his concurrence seems a much more accurate point:

quite to the contrary, what would enshrine power as the governing principle of this Court is the notion that an important constitutional decision with plainly inadequate rational support must be left in place for the sole reason that it once attracted five votes.”

Point well taken. But then, Scalia goes completely off the rails:

“[S]tare decisis[ ], to the extent it rests upon anything more than administrative convenience, is merely the application to judicial precedents of a more general principle that the settled practices and expectations of a democratic society should generally not be disturbed by the courts.”

It strikes me that the expectations of a democratic society are a helluva lot bigger principle in play than mere “administrative convenience.”

But even worse, Marshall was exactly on point in his criticism of the plurality opinion by Rehnquist, for they did indeed say:

“Stare decisis is not an inexorable command; rather, it ’is a principle of policy and not a mechanical formula of adherence to the latest decision.’ [citation omitted] This is particularly true in constitutional cases, because in such cases ’correction through legislative action is practically impossible.’ [citation omitted]. Considerations in favor of stare decisis are at their acme in cases involving property and contract rights, where reliance interests are involved,”

Up until the last sentence, the majority is exactly correct. Constitutional decisions by the Supreme Court are almost impossible to reverse by democratic means. And as we have seen with the Fifteenth Amendment, even when those Herculean hurdles are cleared, a majority of the Court might simply elide them away, as Roberts did in Shelby County.

But seriously, the reliance of a democratic society on settled precedents of the Court is at its peak in *property or contract cases*??? How one drafts a contract or a title deed is more important than who one can marry, who one can be romantic with, what one can do with their own body??? This is simply breathtaking in its fundamental ignorance.

To wit: the American public should not have to draft new Constitutional Amendments and get them passed by 2/3’s of both Houses of Congress and 3/4’s of all States, in order to protect civil rights that have been upheld by Supreme Court decisions and been in effect for decades.

Simply put, the rule by an ever-shifting 5 to 4 majority on the Supreme Court is not by any means the Rule of Law. Marshall was spot on in his last dissent that Edicts by shifting majorities on the Supreme Court have indeed “squandered its authority and legitimacy.”