Saturday, December 17, 2022

Weekly Indicators for December 12 - 16 at Seeking Alpha


 - by New Deal democrat

My Weekly Indicators post is up at Seeking Alpha.

The coincident indicators, especially employment, are hanging on by the proverbial skin of their teeth.

I don’t think they roll over until gas prices stop declining.

In any event, clicking over and reading will bring you up to the moment on the status of the carnage, and bring me a little reward for the effort I put in.

Friday, December 16, 2022

The status of the coincident indicators


 - by New Deal democrat

In addition to real GDP, which is only updated quarterly and with a lag, the NBER has indicated that it relies upon four other datapoints in determining the onset month of a recession: payrolls, industrial production, real income less transfer payments, and real manufacturing, wholesale, and retail sales.

The below shows all four, with the exception that, because real manufacturing and trade sales lag the publication of real retail sales by two months, I show the latter. Since real retail sales are the largest component of manufacturing and trade sales, and usually turn before the manufacturing and wholesale components, this is a little more leading anyway:


Real income peaked last November, real retail sales in April, and industrial production may have peaked in September. With the decline in gas prices, real sales and income have rebounded somewhat since June, but are still below their peaks. Only payrolls have continued to increase throughout the time period, and their growth continues to decelerate.

I suspect the actual recession will not begin until gas prices make a bottom; and we probably won’t know about payrolls until at least the yearly revisions kick in next March. But with the Fed hiking interest rates another 0.50% on Wednesday, my best guess is that there is a 95% chance we will be in a recession by the middle of 2023. 

Thursday, December 15, 2022

November real retail sales turn down, return to negative YoY


 - by New Deal democrat

Real retail sales is one of my favorite indicators for both the current economy and the jobs situation 3 to 6 months ahead.

This morning nominal retail sales for November were reported down -0.6%, which only takes back about 1/2 of October’s strong +1.3% increase. Since consumer inflation rose +0.1% for the month, real retail sales decreased by -0.5%. Here are the absolute values for real retail sales since the beginning of 2021:


Note sales remain -1.1% below their recent peak in April.

As I’ve noted many times, YoY real retail sales turning negative YoY for 75 years has been an excellent harbinger of a recession. With this morning’s data, they one again have turned negative. Below is the last 25 years of data:


I am willing to discount the negative numbers in the first half of 2022 because they are compared with the strong stimulus-induced spending spree of 2021. But the numbers since June are much more cautionary. In particular, it has been noted that consumer spending has shifted from goods to services this year. While that point has lots of merit, as pandemic related spending fades further into the background, I think the historical relationship will assert itself more and more.

As I’ve also noted many times, real retail sales /2 are a good albeit noisy leading indicator for jobs reports 3-6 months in the future. Here is the historical record since the beginning of the modern retail sales series until just before the pandemic:


And here’s what they look like since June 2021:


That they have continued to be near zero or even negative YoY for many months strongly implies continued deceleration in the monthly jobs numbers over the next few months.

November Industrial production: has the King of Coincident Indicators peaked?


 - by New Deal democrat


Industrial production declined -0.2% in November, and manufacturing production declined -0.6%, essentially returning both indicators to their levels of July:


I call industrial production the King of Coincident Indicators, because its peak most often coincides with the month of the onset of a recession as determined by the NBER. So the fact that total production has been close to flat for 4 months, and down -0.3% from 2 months ago is an important caution sign; especially since real retail sales, the primary component of total manufacturing and trade sales which is also relied upon by the NBER, also turned down significantly in November.

On a YoY basis, total production remains higher by 2.5% and manufacturing production up 1.4%. The below graph shows the past 50 years of this metric with both values normed to 0:


Back when the US was the world’s manufacturing powerhouse, these YoY values were recessionary. But in the past 30 years, as the US economy became more dominated by services, YoY readings like these also equated to slowdowns during expansions.

In any event, if the King of Coincident Indicators has truly peaked, then the report on personal income next week, which minus transfer payments is another important metric used by the NBER, assumes added significance.

Jobless claims: still weakly positive


- by New Deal democrat

My focus on jobless claims has shifted to when and whether they will turn negative, flashing a short leading warning for recession. A reminder that my criteria are a 10% increase from their low point (already in place) and an increase YoY for a yellow flag, and a 15% increase from their low point (also in place) and a 10% increase YoY for a red flag.

Initial jobless claims declined -20,000 to 211,000 last week. The 4 week average declined -3,000 to 227,250. Finally, continued claims, which lag by one week, rose 1,000 to 1.671 million:


All three still remain lower YoY, although the comparisons are getting much less positive:


Also the data is much more subject to seasonal distortions from Thanksgiving through early January, so extra caution is warranted.

Bottom line: for now, jobless claims remain a positive.

Wednesday, December 14, 2022

Real average and aggregate non-managerial wages for November


 - by New Deal democrat


With November’s consumer inflation report in the books, let’s update two of my favorite measures of how the working/middle class is doing - real average non-supervisory wages, and real aggregate payrolls.


Nominal average wages for non-supervisory workers rose a strong 0.7% in November. Inflation fell sharply to 0.1%. So real average wages rose 0.6% last month. Still, they are down -1.2% YoY, and down -2.2% since December 2020; but 1.9% higher than they were in January 2020 just before the onset of the pandemic:


The recent inflection point, as I pointed out yesterday, was in June; and the below graph of gas prices tells you just about everything you need to know:


With gas prices down almost $2/gallon from 6 months ago, putting 15 gallons of gas in your vehicle costs you almost $30 less than it did then, which can improve a heckuva lot of statistics.

Next, real aggregate payrolls for non-managerial workers measure how much wealth the middle/working class is earning as a whole. In the past 60 years, when that has outright declined on a YoY basis, it has almost always coincided, give a month or two, with the onset of recessions, so it is an excellent coincident indicator as well:


In November, aggregate payrolls increased 0.6%, so real aggregate payrolls increased 0.5%. YoY they were up 1.6%:


To signal an imminent recession, nominal payroll growth would have to decelerate significantly more than inflation. So long as gas prices keep declining, it is very unlikely that will happen. Good news for now.

Tuesday, December 13, 2022

November CPI: Thank you, gas prices! No thank you, owners’ equivalent rent


 - by New Deal democrat

Just like producer prices as reported last Friday, consumer prices for November confirm the inflection point of last June. Thank you, lower gas prices! Here’s what total and core (ex-food and energy) inflation look like, normed to 100 in June:


Since June, overall consumer inflation has increased 1.0%, so is increasing at a 2.2% annual rate. Core inflation has increased 1.9%, or a 4.7% annual rate. 

To cut to the sectorial chase, here is the breakdown of all the important categories, first m/m and second YoY:

Total: +0.1%, +7.1%
Core +0.2%, +6.0%
Shelter +0.6%, +7.1%
Food +0.5%, +10.6%
Energy -1.6%, +13.1%
New vehicles -0-, +7.2%
Used vehicles -2.9%, -3.3%

As you can see, there remain only two sources of major inflation: shelter and food. In particular, take shelter out of total inflation, and consumer prices since June are *deflating* by -0.3% at an annual rate, and core prices since June are increasing at a 2.2% annual rate.

Further, as I’ve been pounding on for more than a year, “owners’ equivalent rent,” which is how house prices are measured for the CPI, lags badly, i.e., by a year or more. Here’s this morning’s update on what YoY house prices as measured by the FHFA (/2 for scale) look like compared with YoY owners’ equivalent rent:


As I anticipated, YoY OER has continued to increase, and is now up 7.1%. Meanwhile the FHFA house price index, through its latest reading for September, was up 11.0%.

The YoY increase in the FHFA price index has decreased by 33% in the past 4 months. At that rate actual house prices will be unchanged YoY by next April. Meanwhile I expect OER to continue to increase to 7.5% or so through winter.

I also want to comment briefly about new and used vehicle prices. Nominally they have both increased sharply since the start of the pandemic, up over 20% and 40% respectively. However, since average hourly wages are up 17% since then, in real terms new vehicle prices are only up about 3%, while used vehicle prices are still up about 25%, despite their decline this year:


In shot, the big decline in gas prices is having a huge impact on consumer prices overall. Food and used vehicle prices in particular remain problems. But inflation remains distorted to the upside due to the way CPI measures house prices.

As I’ve said for the past several months, at this point the Fed, via interest rate increases, is chasing a phantom menace, needlessly causing a recession, or at least a deeper one than would be otherwise necessary to achieve its objectives.


Monday, December 12, 2022

A brief overview of the current state of the economy


 - by New Deal democrat

This week we get the final most important data of 2022, with consumer prices tomorrow and industrial production and retail sales Thursday. The Fed will also be making its final rate hike decision of the year. Next week and the week after, the only data will be housing construction and prices, plus personal income and spending.


So let’s take a look at few salient datapoints explaining where the economy is. Remember that my primary purpose in discussing expansions vs. recessions is their effect on jobs and income for middle and working class Americans.

To begin with, gas prices are now at their lowest level in the entire last year - even lower than last winter:


Just as sharply rising gas prices put a damper on the economy in the first half of this year, they are putting a floor under it now. Q4 GDP is expected to be good, and I it is very unlikely that the economy will roll over so long as gas prices continue to fall. But at some point they will bottom out, and that is when I would expect Trouble.

One good reason to expect Trouble is the much-discussed yield curve in Treasury bonds. The below graph shows nearly a complete inversion, with the shortest term yields paying the most:


The graph does not show the 6 month and 1 year Treasuries. If it did you would see that the 6 month Treasury is now the highest-paying, followed by the 1 year, with both paying more than the 2 year. In other words, only the Fed funds rate and 3 month Treasuries are not inverted.

This is a historic leading indicator of recession. At this point the inversions are so deep that it would be unprecedented *not* to have a recession soon.

Which brings us to the 4 monthly coincident indicators used to date recessions. Below all 4 - industrial production (blue), real retail sales* (red), real income less transfer payments (gold), and payrolls (gray) -  are normed to 100 as of June (*the NBER uses total real manufacturing and trade sales, but those don’t get reported timely, and real retail sales are their most leading component):


Industrial production, the King of Coincident Indicators, has gone nowhere. Both real sales and real income have increased (thank you, lower gas prices!), but are still lower than they were one year ago, and payrolls have continued to increase but at a decelerating rate.

As indicated above, we’ll get updates on two of those four coincident indicators later this week. If industrial production has started to decline, then the remaining shoes will probably drop once gas prices stop dropping. 

Sunday, December 11, 2022

Weekly Indicators for December 5 - 9 at Seeking Alpha


 - by New Deal democrat

My Weekly Indicators post is up at Seeking Alpha.

The most noteworthy trend over the past several months has been the almost relentless deterioration in the YoY measures of consumer spending and employment. That trend continued last week.

As usual, clicking over and reading will bring you up to the virtual moment as to the state of the economy, and reward me a little bit for my efforts.

Friday, December 9, 2022

November producer prices: YoY measures mask recent sharp deceleration to mainly tolerable levels


 - by New Deal democrat

Consumer prices for November won’t be reported until next Tuesday, but this morning we got the upstream producer prices. The news was mainly good, although not good enough to likely dissuade the Fed from its current course of interest rate hikes.


This is one of those cases where YoY measures give a false picture in comparison with seasonally adjusted monthly data.

YoY producer price growth decelerated, but is still very high: final demand prices increased 7.4%, “core” final demand less food and energy increased 8.1%, and commodity prices are up 8.2%:


That’s down from their respective peaks, but still very high compared with the last 40 years pre-pandemic.

But now let’s look at the seasonally adjusted monthly changes:


Since June there’s been a marked deceleration in final demand prices, and an outright decline in commodity prices.

So let’s norm June to 100, and see what we get:


Final demand prices are only up 0.4% in 5 months; less food and energy up 1.4%; and commodities are down -6.1%. Onan annualized basis, the first measure is trending at 1.0% rate, while the “core” second measure is slightly problematic, increasing at a 3.4% annualized rate.

A similar pattern appears when we break final demand down into goods vs. services. While YoY goods prices are up 9.6% and services prices up 5.9%:


Final good services prices are up 1.5% in the past 5 months, while final demand goods prices are actually down -1.3%:


In short, most of the upstream inflation problem in producer prices has been abating rapidly. Only “core” services prices remain elevated above levels tolerated without alarm before the pandemic.

Thursday, December 8, 2022

Jobless claims: troublesome trend continues, but no yellow flag yet


 - by New Deal democrat

Initial jobless claims is one of the few remaining positive short leading indicators. But as I’ve noted for the past several weeks, the trend is troublesome.

This week initial claims rose 4,000 to 230,000, and the 4 week moving average rose 1,000, also to 230,000. Continuing claims one week previous rose 62,000 to 1.671 million:


Initial claims aren’t even as high as they were in August, but the less volatile (and less leading) continuing claims rose to the highest level since February.

If their current trend continues, all 3 could be higher YoY within two weeks.


Back in 2019, surveying the entire history of claims, I wrote that

“Initial jobless claims are an important short leading indicator, typically turning up 3-9 months before a recession. A problem is the necessity of filtering out signal from noise.There are two ways I measure claims in order to do so: (1) how much has the less noisy four week average risen from its low? And (2) have initial claims, averaged monthly, turned higher YoY?

“Let’s start with the first measure. A 10% increase off of an interim low in claims is not unusual, and has happened every year or two for the entire 50+ year period that records have been kept. By the time they are up 15% from their bottom, not only is it almost always a signal of recession, but frequently the recession is imminent.
“….
“ In any given expansion, there is usually at least one month where claims are higher YoY. But if that happens for two months in a row, more often than not it has signaled that a recession is approaching.”

Last week I wrote something similar:

“In the past, if the 4 week average has been more than 5% higher YoY for any significant period of time, and less reliably, if the slightly lagging continuing claims were higher YoY, a recession was almost always close at hand.”

Here’s what the YoY% change in both the 4 week average and continuing claims look like historically:


At 230,000, the. 4 week average of initial claims is 35% higher than its low of 170,500 set in April. But they are still -5.8% lower YoY, and continuing claims are -20.4% lower YoY:


As I wrote above, if the current trend continues, that could change before the end of this month, warranting a yellow caution flag. But because the series is sufficiently noisy, even then I would want to see several months of ongoing weakness before hoisting any red flag, and even the note the false positives at least once during each decade between 1970 and 2010.

Wednesday, December 7, 2022

Coronavirus dashboard for December 7: the first winter wave of endemicity begins


 - by New Deal democrat


COVID is well on its way to becoming endemic, with a significant background level similar to what we have experienced in the last 8 months, and a surge during the winter months when people spend more time socializing together indoors.

In that vein, it is apparent that, as expected, Thanksgiving get-togethers have triggered a new wave of COVID infections.

Wastewater measures from Biobot show an apparent start to an exponential rise:


This is true not just nationally but in every Census region, especially the Northeast (yellow in the graph below) but the West (green), where the increase is slower:


The data is consistent with close to 400,000 “real” daily cases.

Confirmed cases have also increased from about 37,000 before Thanksgiving to 55,800 (although some of that is a data dump from New Jersey). Deaths still remain very low at 322:


And hospitalizations have increased from 24,000 in mid-November to 34,600, 6,000 of which is just in the past 7 days:


More holiday get-togethers will only make this incipient winter wave worse.

Unfortunately, part of this is the very poor uptake of the new bivalent booster shot. Per Dr. Eric Topol, “Only 1 in 3 American seniors have been boosted in [the past] 6 months.”

Hospitalizations for seniors, at least in some States, are higher than they have been since the original Omicron wave one year ago:


This is particularly exasperating, since the CDC just updated their data showing that being fully boosted lowers seniors’ risk of hospitalization by 80%:


Although mitigation efforts like masking have all but evaporated, my template is that this wave will likely be similar to the BA.1.12.1 and BA.5 waves earlier this year, both of which peaked at roughly 125,000 confirmed cases and 500 deaths per day. This peak will probably be in about mid-January.


Tuesday, December 6, 2022

Scenes from the November employment report: the short leading jobs indicators


 - by New Deal democrat

Every month as part of my post on the jobs report, I run through the changes in those measures which are short leading indicators for the economy.


There were some significant developments in the past several months, so let’s take a closer look here.

Here’s a historical look at temporary help services, residential construction jobs, and total construction:


The first two typically turn down months before employment as a whole, and the last one at least turns flat.

Now here’s the close-up:


Temporary help didn’t just turn down in November, but several previous months were revised down as well (h/t Bob Dieli). Residential construction jobs turned down, and have been generally flat for half a year. Only total construction jobs are still increasing.

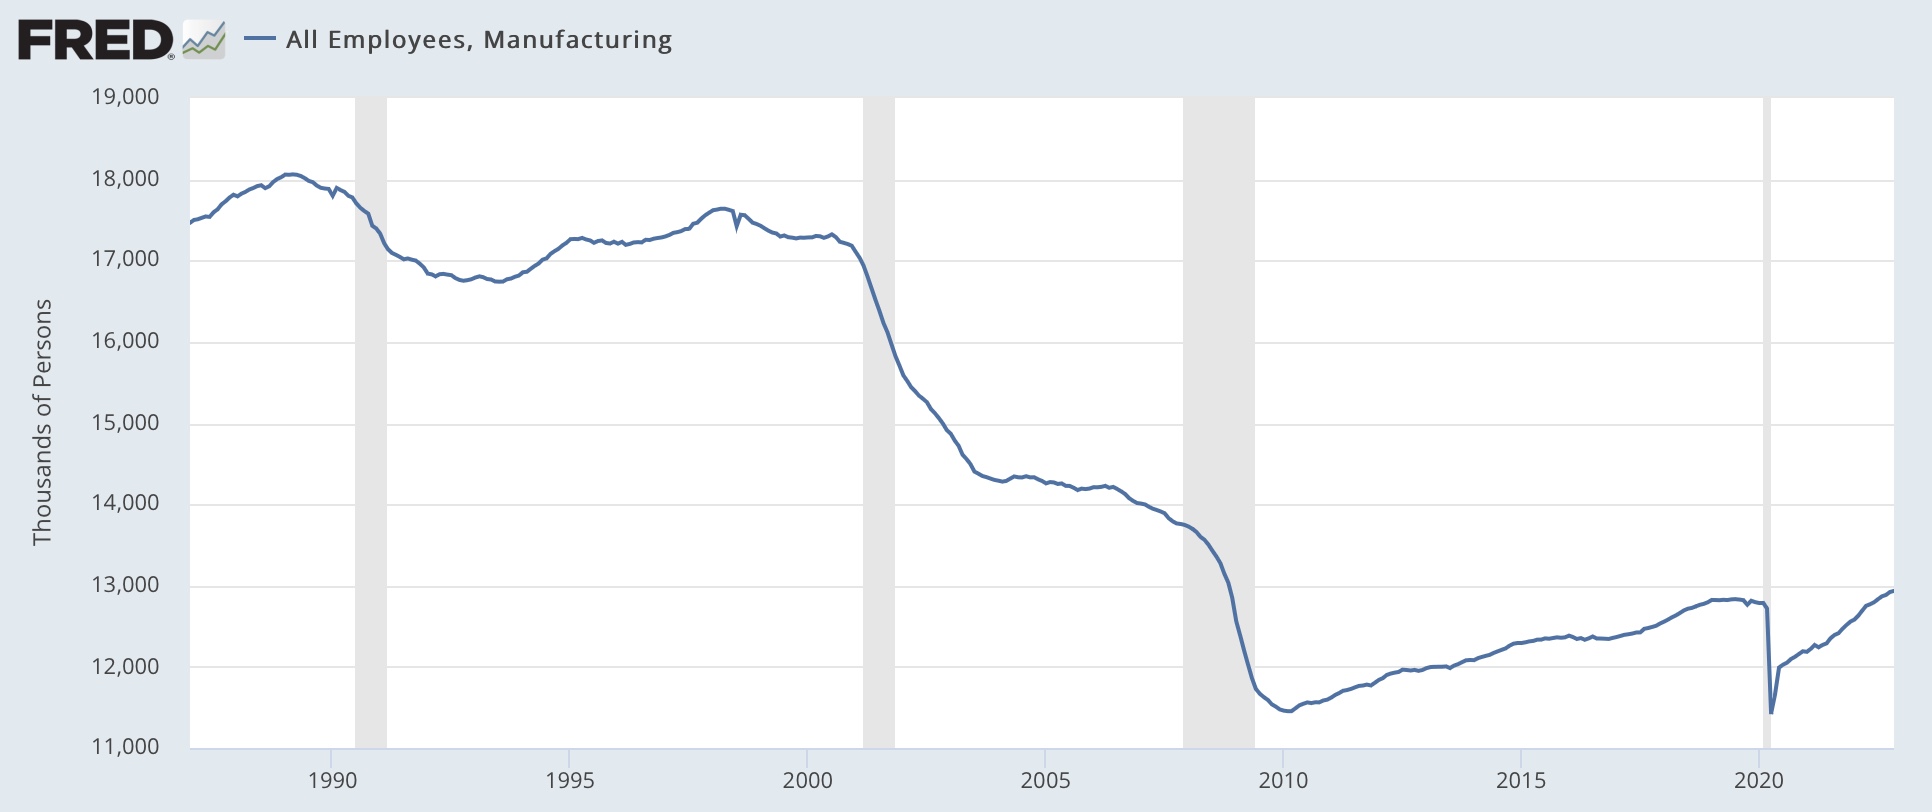
Manufacturing jobs also typically turn down before a recession:


These have continued to increase through November (pretty surprising given the weak Fed new orders and ISM manufacturing reports).

But manufacturing *hours* are much a more sensitive indicator than manufacturing jobs (shown YoY for better comparative purposes):


And manufacturing hours YoY are down by a % typically associated with previous recessions.

In the past, a decline of -0.6 hours from the expansion peak has been the average consistent with the onset of a recession, and that is what we have now:


Finally, in a manner similar to initial jobless claims, the number of those unemployed for less than 5 weeks has typically risen before the onset of a recession (very noisy, but true even for the smoother 3 month rolling average):


Here is the close-up of that metric for the past year:


In short, most of the leading indicators of a jobs recession are either signaling an oncoming recession now (temporary jobs, manufacturing hours, short term unemployment) or at very least are close (residential construction). Only total manufacturing and construction jobs are still increasing.

I expect both manufacturing and construction jobs to turn down in the next few months as well, given the poor ISM manufacturing index, and the likelihood that housing units under construction will turn down significantly.

Monday, December 5, 2022

New factory orders remain an economic bright spot


 - by New Deal democrat

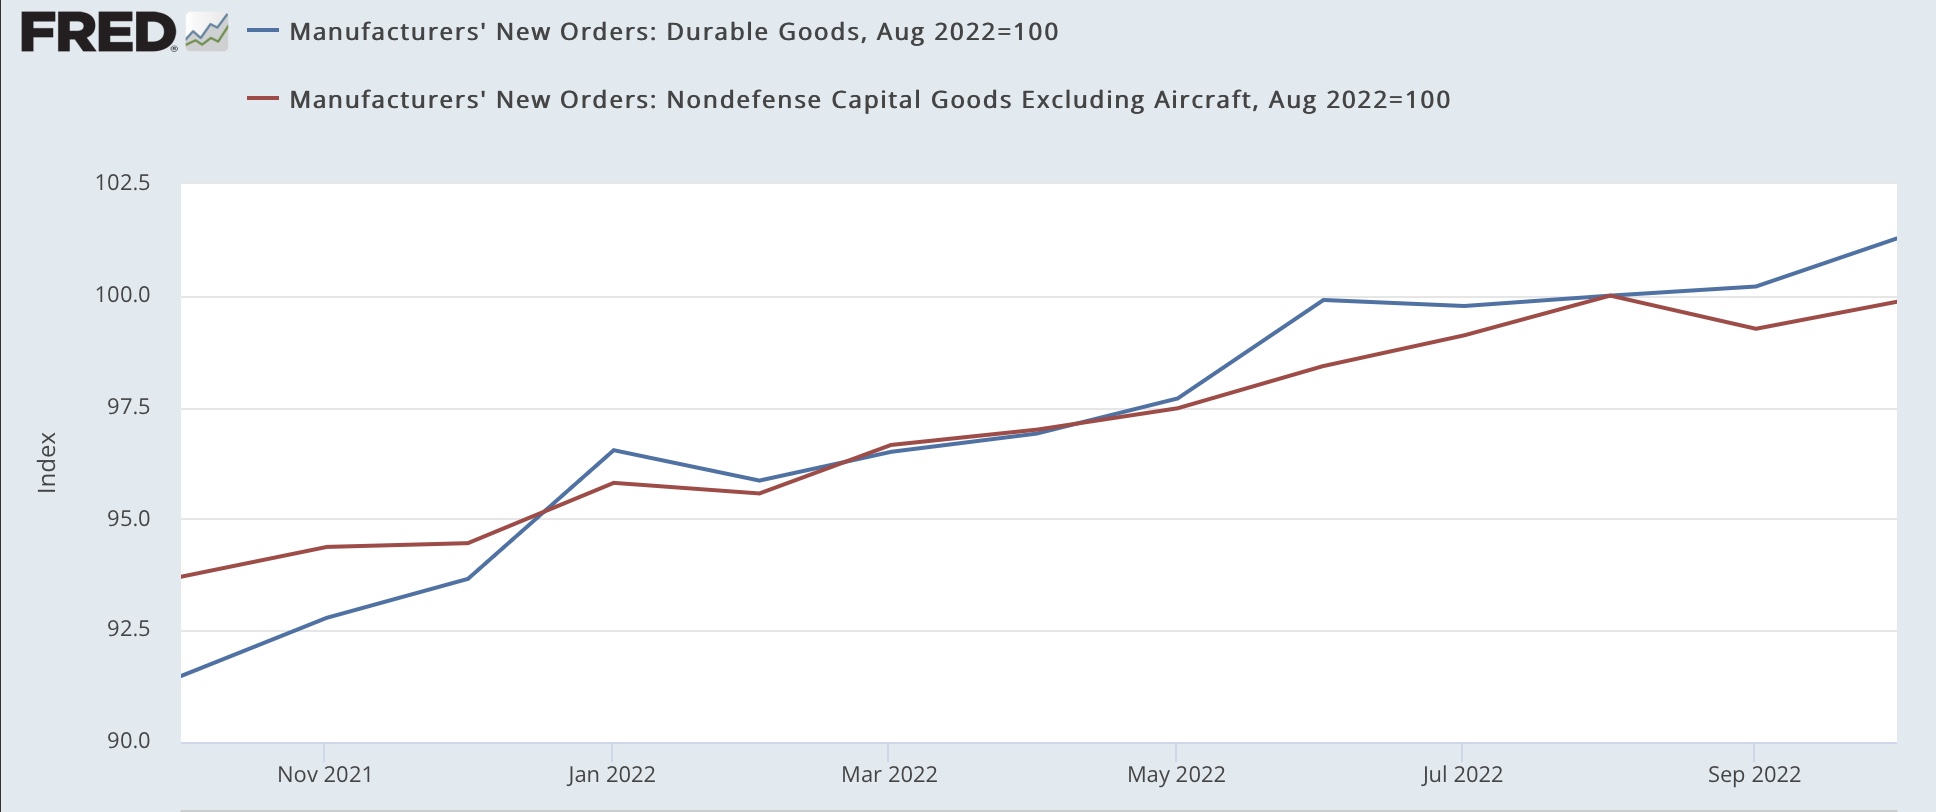
New factory orders for October were reported this morning. I normally don’t write about them, because they are very noisy, but since at the moment they are one of the few bright spots among the short leading indicators, let’s take a look.

Total new factory orders rose 1.0%. “Core” orders excluding defense and aircraft rose 0.6%:


“Core” orders have been flat for 2 months, which may or may not portend a turning, but as you can see from the below longer term view, typically factory orders turn down or at least flatten in the months before a recession - although it’s frequently only apparent in retrospect:


Consumer durable goods orders are also a short leading indicator. They were unchanged for the month:


With other measures of manufacturing from the regional Feds and ISM showing pronounced weakness, it’s a little surprising that it hasn’t shown up here.

Anyway, in the interest of balance, there are still some bright spots.


Saturday, December 3, 2022

Weekly Indicators for November 28 - December 2 at Seeking Alpha


 - by New Deal democrat

My Weekly Indicators post is up at Seeking Alpha.

First the long leading indicators turned. Then the short leading indicators turned. Now the coincident indicators are weakening to new expansion lows almost every week.

The silver lining is: the first long leading indicator may already have hit its worst levels.

As usual, clicking over and reading will bring you up to the virtual moment as to the economy, and reward me a little bit for my efforts.

Friday, December 2, 2022

November jobs report: decidedly mixed signals, most consistent with a still-growing but decidedly weakening economy


 - by New Deal democrat


Since early this year I have expected employment to follow the halt in consumption growth, decelerating over time to a stall. This has only intensified given the major decline in growth in payroll withholding tax payments, which are near recessionary. 

This expectation was partially met today in that the three month average in employment gains since February, which had decelerated from over 500,000 to 289,000 through October, decelerated further to 272,000 through November.

Aggregate payroll growth also declined YoY from 9.1% to 8.7%, but is still probably above the inflation rate.

Here’s my in depth synopsis.

HEADLINES:
  • 263,000 jobs added. Private sector jobs increased 221,000. Government jobs increased by 42,000. 
  • The alternate, and more volatile measure in the household report *delined* for the second month in a row, by -133,000 jobs. In the past 8 months, according to this report, only 12,000 jobs have been added! The above household number factors into the unemployment and underemployment rates below.
  • U3 unemployment rate was unchanged at 3.7%.
  • U6 underemployment rate fell -0.1% to 6.7%.
  • Those not in the labor force at all, but who want a job now, rose 167,000 to 5.550 million, compared with 4.996 million in February 2020.
  • Those on temporary layoff declined -44,000 to 803,000.
  • Permanent job losers rose 127,000 to 1,368,000.
  • September was revised downward by -46,000, while October was revised upward by 23,000, for a net decrease of 23,000 jobs compared with previous reports.
Leading employment indicators of a slowdown or recession

These are leading sectors for the economy overall, and will help us gauge whether the strong rebound from the pandemic will continue.  These tilted to the negative:
  • the average manufacturing workweek, one of the 10 components of the Index of Leading Indicators, was declined -0.1 hour to 40.9, and is down -0.7 hours from its recent February peak of 41.6 hours. This is consistent with the onset of a recession.
  • Manufacturing jobs increased 14,000, and are at a level higher than before the pandemic.
  • Construction jobs increased 20,000, also at a level higher than before the pandemic. 
  • Residential construction jobs, which are even more leading, declined by -2,600.
  • Temporary jobs, which had been rising sharply, declined  by 17,200. Since the beginning of the pandemic, about 300,000 such jobs have been gained.
  • the number of people unemployed for 5 weeks or less increased by 32,000 to 2,243,000, about 125,000 above its pre-pandemic level.

Wages of non-managerial workers
  • Average Hourly Earnings for Production and Nonsupervisory Personnel rose $0.19 to $28.10, which is a 5.8% YoY gain, an increase of 0.3% from last month, vs. its 6.7% peak at the beginning of this year.

Aggregate hours and wages: 
  • the index of aggregate hours worked for non-managerial workers declined -0.2% which is still above its level just before the pandemic.
  •  the index of aggregate payrolls for non-managerial workers rose by 0.6%, and is up 8.7% YoY. This metric has been decelerating nominally almost consistently for the past 16 months.  Compared with inflation through October, it is up only 0.9% YoY (recessions typically start when it crosses zero).

Other significant data:
  • Leisure and hospitality jobs, which were the most hard-hit during the pandemic, rose 88,000, but are still about -6% below their pre-pandemic peak.
  • Within the leisure and hospitality sector, food and drink establishments added 62,100 jobs, but are still about -4% below their pre-pandemic peak. 
  • Professional and business employment increased by only 1,000, over 1,000,000 above its pre-pandemic peak.
  • Full time jobs increased 92,,000 in the household report.
  • Part time jobs decreased -302,000 in the household report.
  • The number of job holders who were part time for economic reasons rose 25,000 to 3,685,000.
  • The Labor Force Participation Rate declined -0.1% to 62.1%, vs. 63.4% in February 2020.

SUMMARY

This report was mixed, with both strong and decidedly weak points. On the strong side, wages increased sharply, improving the YoY gains as well. The underemployment rate fell. Construction and manufacturing jobs increased. YoY aggregate payrolls decelerated further, but probably improved vs. YoY inflation. While the 3 month average gain in payrolls continued to decline, in absolute terms it remains good.

On the negative side, the manufacturing workweek has declined enough to be consistent with the onset of recession. Temporary and residential construction jobs declined. The number of short-term newly unemployed rose. All of these are leading indicators, and suggest further weakness to come. Aggregate hours worked declined, and are only up 1.3% in the past 9 months. Perhaps worse, employment as measured by the household report is only up 12,000 in total for the entire last 8 months, which is very much in line with the weak tax withholding data. In other words, I increasingly expect significant downward revisions to the recent establishment reports when they are revised next year.

This mixed report, taken all together, is most consistent with a still-growing economy, but one which is weakening, the theme for the entire last 6 months or more.


Thursday, December 1, 2022

November manufacturing and October construction both decline, the former almost at recessionary levels


 - by New Deal democrat

As usual, we begin the new month’s data with the ISM manufacturing index. This index has a very long and reliable history. Going back almost 75 years, the new orders index has always fallen below 50 within 6 months before a recession. Recessions have typically started once the overall index falls below 50, and usually below 48.


Which means that today’s report for November comes very close to meeting all of the above criteria. The overall index declined below 50 for the first time since May 2020, at 49.0. The new orders subindex declined -2 to 47.2, the 5th time in the past 6 months that it has been below 50, and only 0.1 above its September low of 47.1:


This is a reading on the very cusp of recession.

Construction spending for October was also reported, and also showed declines of -0.3% for both total and residential spending:


Total construction spending is -1.3% below its July peak, while the more leading residential construction spending is -7.1% below its early May peak.

Since construction spending is a series with only a 30 year history, there is no reliable recession marker, except that residential spending turns down in advance.

Finally, below is a comparison of total residential construction spending vs. housing units under construction from the permits and starts report:


While there is a general concordance, there is no set pattern as to which turns first or simultaneously. I continue to expect housing units under construction to follow permits and starts and turn down shortly.

In sum, our two final reports of the day show declines in both leading sectors of manufacturing and construction, the former more seriously than the latter.