Saturday, February 12, 2022

Weekly Indicators for February 7 - 11 at Seeking Alpha


 - by New Deal democrat

My Weekly Indicators post is up at Seeking Alpha. 

Last year my task was easy, because the issue was whether to describe the economic Boom as “red hot” or “white hot.” With interest rates having risen between 1/2% or 1%, depending on which type being measured, and inflation having eaten up wage increases, the task this year is more challenging.

But the end of a Boom does not mean the onset of a recession. The DOOOMers are already out and baying; as usual they will be wrong.

To see where we are at now, and where we are headed over the near term, click on over and read. It will inform you and invest me with a couple of $$$.

Friday, February 11, 2022

Real wages continued to stall in January, portending a consumer slowdown, but don’t reverse


 - by New Deal democrat

Let me follow up on yesterday’s post about the January CPI by talking about “real” wages.

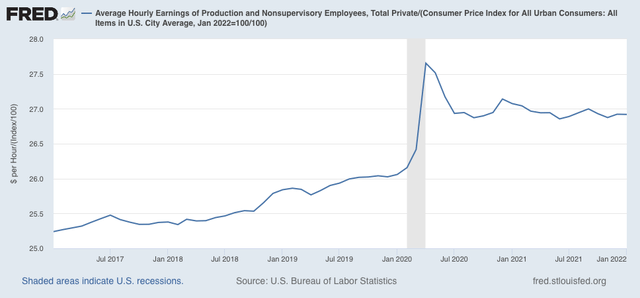
Since both average real hourly wages and consumer inflation increased in January by 0.6%, real hourly wages for non-supervisory workers were flat month over month:


Real wages have been essentially flat since June 2020, with the exception of last winter and September. That isn’t good, but it isn’t recessionary either.

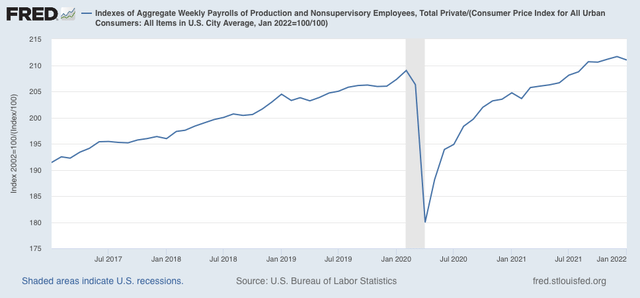
Now let’s turn to real aggregate payrolls, which are an overall measure of consumer health. These declined by -0.3% for the month. But, due to the annual revisions in the household survey from which they are derived, December 2021 was their new all-time high:


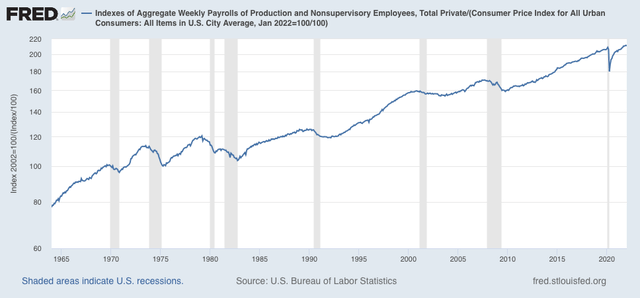
For the past 50+ years, only when aggregate real wages have retreated from peak for 3 to 9 months, has recession typically followed:

So, a blip, but not bad news.

The conclusion I have written for the previous 2 months continues to be true now, with only slight modifications: while real wage growth has halted, depending on which measure we use, it has not gone into reverse. This is consistent with taking a near term recession off the table for now. On the other hand, we certainly are at a point where a deceleration beginning with the consumer sector of the economy is more likely than not.


Thursday, February 10, 2022

Jump in January consumer prices seals the deal on Fed interest rate hikes


 - by New Deal democrat

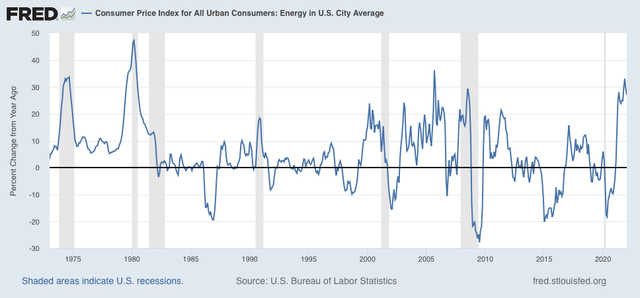
Consumer prices increased 0.6% in January, the third time in four months that it has come in over 0.5%. Energy increased 0.9%, which isn’t a horrible monthly rate, but YoY energy prices for consumers are up 27%, just below their YoY peaks in 1974, 1979, 2005, and 2008 - not coincidentally 3 out of 4 of which coincided with deep recessions: 

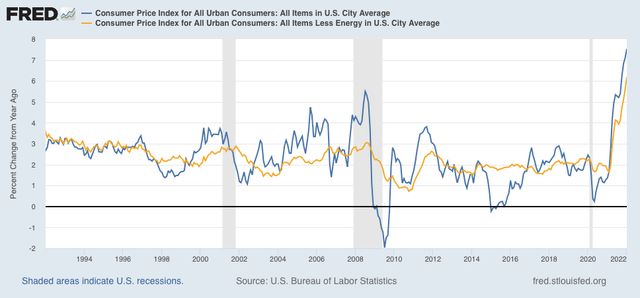
YoY inflation is now 7.5%, the highest rate since 1982. My favorite measure, CPI ex energy, is also up 5.6% YoY, and tied for the worst since the 1981-82 recession as well:


My rationale for tracking CPI ex-energy is that, unless energy costs filter through into the broader economy, there is no cause for alarm. But if the wider economy shows a sharp increase, then there is likely to be aggressive action by the Fed to bring the rate of inflation down, and that means slowing the economy, or even putting it into reverse.

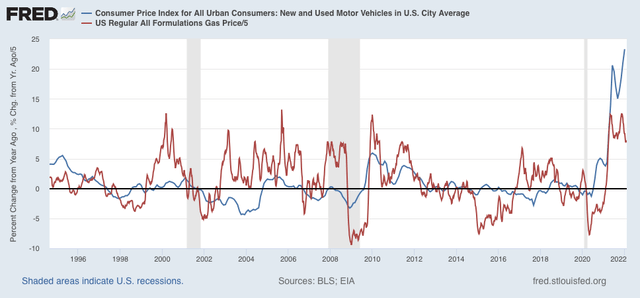
Inflation in new and used vehicle prices rose 0.9% in January, and 23.3% YoY, an all-time high (compared with gas prices, red):


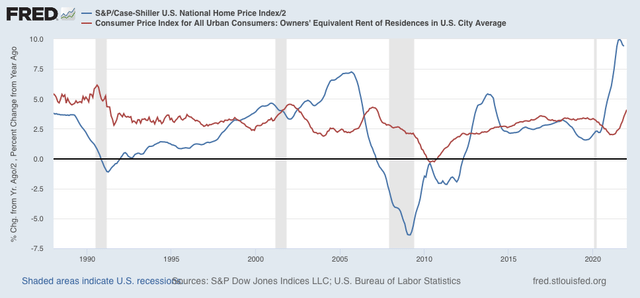
As I have forecast for months, house price increases (blue, /2 for scale) have continued to feed through into rents and “owners equivalent rent”(red), which constitutes 1/3rd of the entire inflation index, and in turn has also continued to increase, and is now up 4.1% YoY:


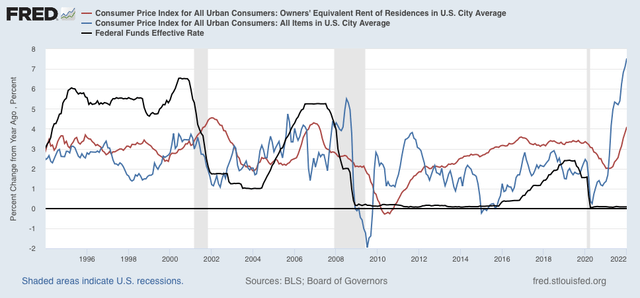
What happened in the case of both prior cases where owners equivalent rent surged after house prices did - 2000 and 2006 - the Fed stepped in and raised rates aggressively, in both cases resulting in recessions, which in turn caused the rate of overall inflation to decline:


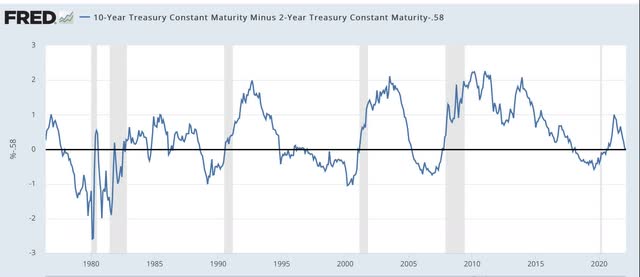
This report all but seals the deal on the Fed raising interest rates in March. It increases the odds of a more aggressive .50% increase rather than a baby-steps .25% increase. I hasten to point out that, so long as the yield curve does not invert, the Fed can still achieve its desired result of a decline in inflation, without causing a recession - and the current spread between the 10 year and 2 year bond is consistent with an economy 2 or 3 years before a recession hits:


Unfortunately, hindsight being 20/20, the Fed allowed itself to fall behind the curve. When house prices increased over 10% YoY consistently in early 2021, it should have realized that this was going to filter through into the broader measure this year, and begun laying the groundwork for tightening then, and probably begun to tighten slowly by the end of last summer.  Now it is probably too late. But the Fed, like me, probably assumed that the US population would be fully or nearly fully vaccinated by last autumn, bringing the pandemic to an effective end, thus bringing labor and supply shortages to an end as well. 
 
I’ll discuss the effect of this report on wages tomorrow.

Jobless claims bounce along near their bottom


 - by New Deal democrat

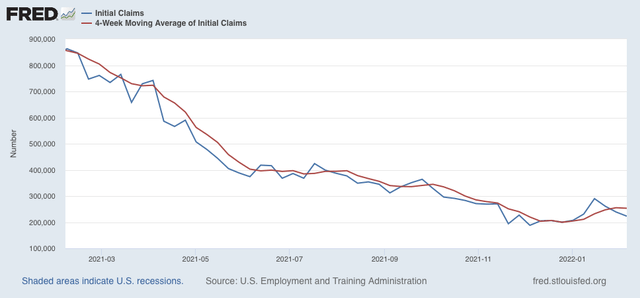
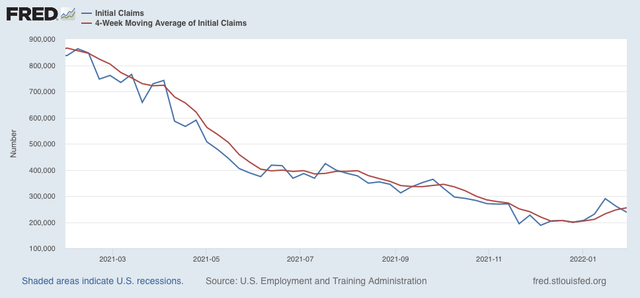
New jobless claims declined 16,000 to 223,000 last week. This is still 35,000 higher than the low of 188,000 set on December 4; but on the other hand is remains among the lowest weekly figures for the past 50 years. The 4 week average declined 2,000 to 253,250, which is 53,500 above its 199,750 low set on December 25:


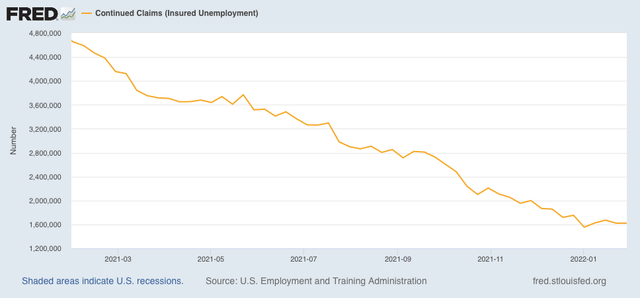
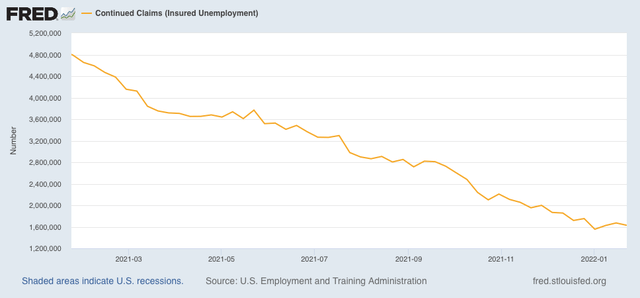
Continuing claims were unchanged at 1,621,000, 66,000 above their low of 1,555,000 set on January 1:


I suspect we have set the lows for this economic cycle. On the other hand, I don’t see any particular reason for jobless claims to rise out of their recent range below 250,000 anytime soon, pandemic permitting.

Programming note: I’ll report on the January consumer inflation number later this morning.

Wednesday, February 9, 2022

Gas prices sound a consumer warning


 - by New Deal democrat

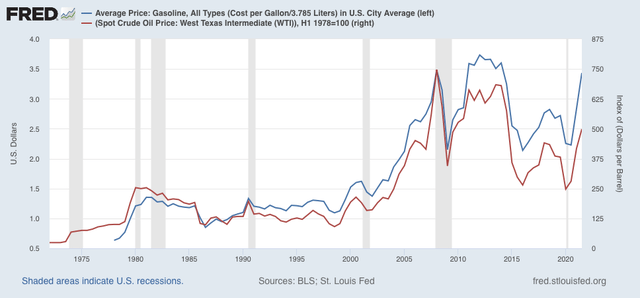
I got a note yesterday from a fellow forecaster pointing out that crude oil prices have once again made new 7 year highs. This is something I also highlighted in my “Weekly Indicators” column on Saturday. As I write this on Wednesday morning, West Texas Intermediate Crude trades at slightly under $90/barrel, yet another new 7+ year high. 


How much trouble does this portend for the economy? Potentially, a lot.

Prof. James Hamilton (of Econbrowser) pointed out over a decade ago that big increases in gas prices had preceded 10 of the 11 recessions in the US since the end of World War 2. Although I can’t find the article right now, my recollection is that Hamilton’s model is calibrated to gas prices to spiking to a new all-time high. Obviously, at about $3.40/gallon right now, we’re nowhere near 2008’s $4.25/gallon, when average hourly wages were 33% lower than they are now.

But it strikes me that the model shouldn’t *require* new all-time highs. Suppose prices had been $2/gallon for 20 years, and then rose to $3/gallon suddenly? That obviously would be nowhere near a new all-time high, but many consumers would long ago have come to accept $2 as the “normal” price, and probably would react almost as strongly as if prices had made a new high.

So I went back and calculated current gas prices now, and in the half-year coinciding with past recessions vs. the 5 year previous average of prices. Before I show you how that came out, let’s look at a historical graph.

Gas prices have been published only since 1978. In order to include the oil shocks of 1974 and 1979, we need to use oil prices, the records of which go back to World War 2 and before. Here’s what the semiannual prices of each look like:


When we compare gas prices in the 6 months just before past recessions vs. their 5 year previous average, here’s what we get:

1990: $1.33 vs. $1.01, up 32%
2000: $1.48 vs. $1.13, up 31%
2008: $3.45 vs. $2.21, up 52%

We don’t have 5 full years of gas prices before 1980, but using the data from its beginning in January 1878, we get:

1980: $1.27 vs. $0.74, up 71%

Since we can see from oil prices that gas prices were on par or even lower than 1978 during the 3 previous years, the shock in 1980 would be higher than 71% (from personal recollection, gas prices doubled or more after the 1979 oil shock started, which is also what they did in 1974).

Now let’s look at the current comparison:

2021: $3.25 vs. $2.53, up 28%
January 2022 vs. previous 5 years: $3.32 vs. $2.58, up 28%

The current increase of 28% compared with the previous 5 years is very close to the 30%+ that coincided with the onset of previous recessions. It’s important to point out in that regard that the 1990 recession just barely coincided with a new all-time high, since at $1.33, they were only $.04 higher than 1980’s $1.27.

Generally, the way we would expect gas prices to trigger a consumer recession is by consumer’s cutting back on non-gas purchases, perhaps even to a greater amount than the added $$ spent on gas. The below two graphs show that two ways.

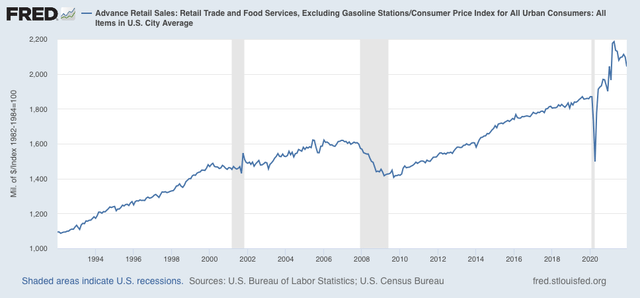
First, here are retail sales ex-gasoline adjusted for the overall consumer price index (note this series only begins in 1994):


Non-gas purchases turned flat in the year just before both the 2001 and 2008 recessions. They didn’t do that for the sui generis pandemic recession.

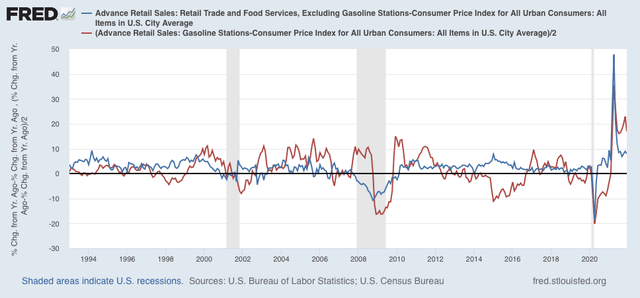
Next, here is the YoY% change comparison between non-gas (blue) and gas (red, /2 for scale) purchases:


Before both the 2001 and 2008 recessions, YoY non-gas purchases, adjusted for inflation, were down, while gas purchases YoY were still higher.

At the moment, both are still significantly higher YoY. But that is going to change drastically starting in March, with the comparisons against last spring’s stimulus-fueled spending.

Just one indicator, and none of my indicator arrays are forecasting recession this spring. But they are forecasting a slowdown by summer, so at very least if gas prices remain at these *relatively* high levels, or increase further, I expect significant consumer distress to show up.

Tuesday, February 8, 2022

Coronavirus Dashboard for February 8: Omicron declines sharply; did Delta provide protection against the worst outcomes?


 - by New Deal democrat

As I mentioned yesterday, I haven’t posted a Coronavirus dashboard in awhile, and with Omicron in rapid retreat, it’s time for an update.


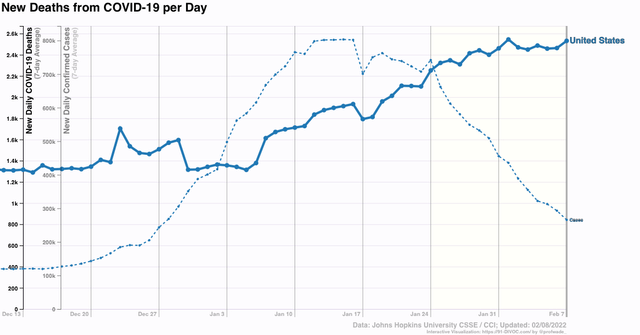
To begin with, deaths are presently peaking at roughly 2450 a day, while nationwide cases are down almost 2/3’s:


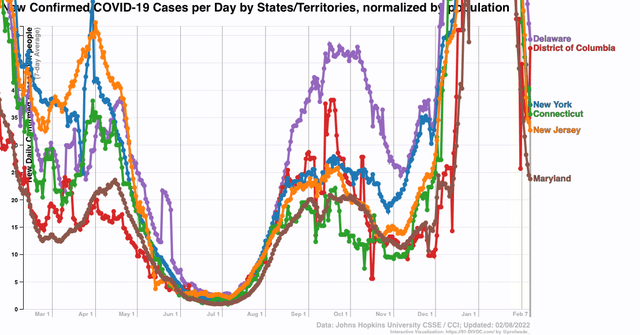
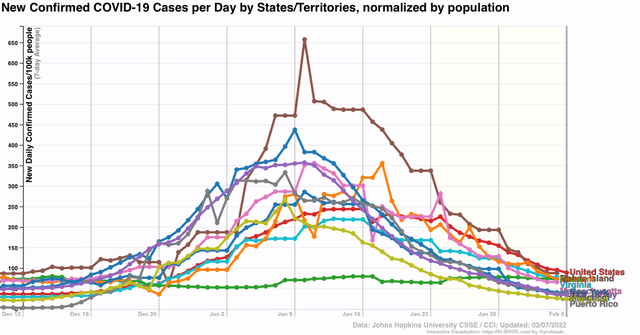
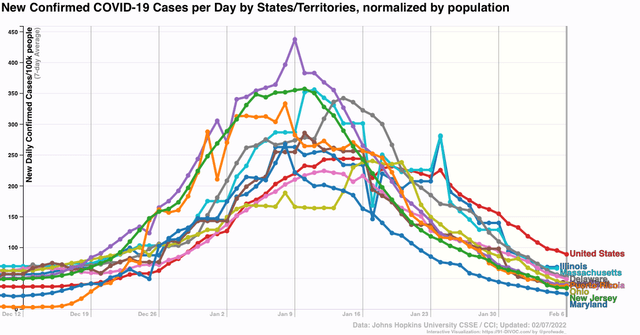
There are over a dozen States where numbers are now down close to, at, or even below their pre-Omicron outbreak levels. In particular, the Northeast region and Puerto Rico down over 85%. NY, NJ, CT, DC, DE, and MD  are at the same level as they were last April, well below their winter 2020-21 peaks, and as of yesterday were still declining with no signs of stopping. *If* the current rate of decline of 50% per week is maintained, they will be at last June’s lows in about 4 weeks:


One thing that is somewhat surprising is that the relative rates of cases from Omicron does not correlate that strongly with previous vaccination rates. To cut to the chase, a previous bad Delta outbreak may have provided some protection against Omicron.

Here are the last 8 weeks (basically the time since Omicron hit) for the 10 most vaccinated (with 2 or more doses) jurisdictions, compared with the nationwide level (in red):


Note that many of them had substantially worse Omicron outbreaks than the average.

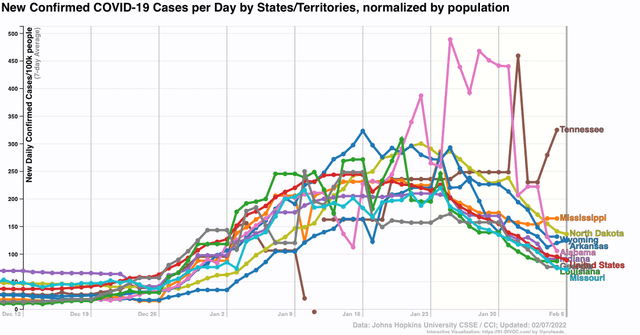
And here are the 10 least vaccinated jurisdictions:


Many of these had *lower* numbers than the national average.

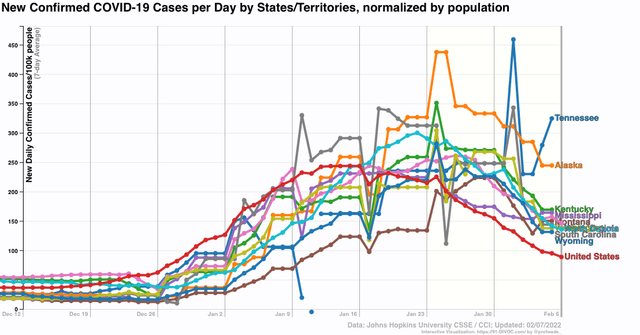
It appears that the heavily vaccinated jurisdictions, being urban travel hubs, were exposed to Omicron first, and are further along in their declines, while the least vaccinated jurisdictions tend to be more rural, were hit later, and are declining less so far (and Tennessee is still increasing!). This pattern is more evident when we compare the jurisdictions with the lowest current rates of infection:


With those having the highest current rates of infection:


Again, urban areas were hit earlier, and have declined from peak more sharply than more rural areas.

The pattern is similar when we turn to deaths. For the US as a whole, total deaths in the past 8 weeks average 31.3 per 100,000.

Here’s the death rates for the 10 most vaccinated jurisdictions (including PR, but not DC):

PR (80% vaxxed) (20.9 deaths per 100,000)*
VT 80% 19.4*
RI 79% 37.5
ME 78% 31.0
MA 77% 39.5**
CT 77% 33.3
HI 76% 11.9*
NY 75% 39.0
NJ 73% 38.2 
MD 73% 40.8**

And here is the same for the 10 least vaccinated jurisdictions:

AL 49% 22.6
WY 50% 30.8
MS 50% 31.0
LA 52% 22.1 
AR 53% 32.6
TN 53% 47.8**
GA 53% 24.3
IN 53% 54.9**
ND 54% 24.7
MO 55% 35.1

*among 10 best rates
** among 10 worst rates

Other States included in the 10 best rates of deaths are:
CA 14.7 
UT 16.7
WA 18.5 
OR 19.7
MT 19.7 
FL 19.8
NC 20.3

Other States included in the 10 worst rates of deaths are:

MI 59.7
PA 54.1
NM 50.7
AZ 49.3
WV 42.6
OH 41.4

While some highly vaccinated States - CA, OR, WA - have among the best records, others - PA - do not. And while some of the least vaccinated States - WV, MI - have terrible records, several others - FL, MT, UT - have among the best records.

To sum up, Omicron seems to have hit highly urbanized areas first and hardest, and more rural areas later on. In the urban areas, cases are declining sharply, while in rural areas deaths are still at or nearer their peaks. Vaccination status seems to be only weakly correlated with Omicron outcomes. This probably doesn’t have anything to do with any shortcomings in the vaccines, but rather the effect of recent bad Delta outbreaks (concentrated in the poorly vaccinated States) providing some protection against the worst outcomes from Omicron.

Monday, February 7, 2022

Programming note: not playing hooky!


 - by New Deal democrat

The economic calendar is *really* sparse this week: initial jobless claims and CPI on Thursday are the only releases of note.

But I am not playing hooky! I haven’t posted a Coronavirus Dashboard in awhile, and with cases coming down, usually sharply, almost everywhere, I thought it was worth a look to see where Omicron hit hardest and where it was not so hard, in particular depending on vaccination status.

So far, the results are not necessarily what you would expect. I’m still working to complete the update, which is pretty extensive, and which should be posted tomorrow morning.

See you then!

Saturday, February 5, 2022

Weekly Indicators for January 31 - February 4 at Seeking Alpha


 - by New Deal democrat

My Weekly Indicators post is up at Seeking Alpha.

There is an old market saying that “the cure for high prices is, high prices.” Well, commodity prices, and in particular industrial commodities and oil, are at new multi-year highs. The latter is going to feed right through into higher gas prices that will be very much noticed by consumers.

And if there is one thing the Fed knows how to do, it is how to bring down (with lots of attendant discomfort) high consumer prices.

For the details on where we are in all of the relevant timeframes, click on through. Which will also reward me a little bit for bringing you all the detailed information.

Friday, February 4, 2022

January jobs report: huge gain in wages, huge upward revisions to past few months, limited Omicron impact


 - by New Deal democrat

Here are the three issues I was looking to see addressed in this jobs report: 
1. Would last month’s “poor” 199,000 number of new jobs be revised higher? 
2. Is wage growth holding up? Is it accelerating?
3. In December, big decreases in the number of initial jobless claims were not reflected in a better jobs number. Would the big increase in initial jobless claims in the past month due to Omicron similarly not be reflected? Or would they show up as an actual decline in hiring, as indicated in ADP’s -301,000 decline reported earlier this week?

The answers were:
1. The 6 month average of monthly gains which declined significantly in December from about 600,000 to 500,000, increased to 547,000, . We still have 2.9 million jobs to go to equal the number of employees in February 2020 just before the pandemic hit. At the current average rate for the past 6 months, that’s about 5 more months.
2. Wage growth exploded even higher than before, now up 6.9% YoY! Aside from April 2020, this is the highest wage growth in *40 years.*
3. There were *huge* upward revisions (included as part of the annual revisions) to the last 2 months. November increased 398,000 to 647,000, and December increased 311,000 to 510,000. So much for those poor numbers!

Here’s my in depth synopsis of the report:

HEADLINES:
  • 467,000 jobs added. Private sector jobs increased 444,000. Government jobs increased by 23,000 jobs. The alternate, and more volatile measure in the household report indicated a gain of 1,199,000 jobs(!), which factors into the unemployment and underemployment rates below.
  • The total number of employed is still 2,875,000, or -1.9% below its pre-pandemic peak. 
  • U3 unemployment rate rose 0.1% to 4.0%, compared with the January 2020 low of 3.5%.
  • U6 underemployment rate fell -0.2% to 7.1%, compared with the January 2020 low of 6.9%.
  • Those not in the labor force at all, but who want a job now, declined -9,000 to 5.704 million, compared with 5.010 million in February 2020.
  • Those on temporary layoff increased 147,000 to 959,000.
  • Permanent job losers declined -73,000 to 1,630,000.
  • November was revised upward by 398,000, and December was also revised upward by 311,000, for a net gain of 709,000 jobs compared with previous reports.
Leading employment indicators of a slowdown or recession

These are leading sectors for the economy overall, and will help us gauge how strong the rebound from the pandemic will be.  These were mixed:
  • the average manufacturing workweek, one of the 10 components of the Index of Leading Indicators, declined -0.1 hour to 40.2 hours.
  • Manufacturing jobs increased 13,000. Since the beginning of the pandemic, manufacturing has still lost -240,000 jobs, or -1.9% of the total.
  • Construction jobs decreased -5,000. Since the beginning of the pandemic, -125,000 construction jobs have been lost, or -1.6% of the total.
  • Residential construction jobs, which are even more leading, rose by 3,600. Since the beginning of the pandemic, 43,500 jobs have been *gained* in this sector, or +5.2%.
  • temporary jobs rose by 26,300. Since the beginning of the pandemic, 156,400 jobs have been gained.
  • the number of people unemployed for 5 weeks or less increased by 440,000 to 2,888,000, which is 949,000 higher than just before the pandemic hit.
  • Professional and business employment increased by 86,000, which is 511,000 *above* its pre-pandemic peak.

Wages of non-managerial workers
  • Average Hourly Earnings for Production and Nonsupervisory Personnel: rose $0.17to $27.91, which is a 6.9% YoY gain. This continues to be excellent news, especially considering that a huge number of low-wage workers have finally been recalled to work.

Aggregate hours and wages:
  • the index of aggregate hours worked for non-managerial workers fell by -0.3%, which is a  loss of -1.9% since just before the pandemic.
  •  the index of aggregate payrolls for non-managerial workers rose by 0.3%, which is a gain of 9.9% (before inflation) since just before the pandemic.

Other significant data:
  • Leisure and hospitality jobs, which were the most hard-hit during the pandemic, gained 151,000 jobs, but are still 1,750,000, or -10.3% below their pre-pandemic peak.
  • Within the leisure and hospitality sector, food and drink establishments increased 108,000 jobs, and is still -984,700, or -8.0% below their pre-pandemic peak.
  • Full time jobs increased 973,000 in the household report.
  • Part time jobs increased 136,000 in the household report.
  • The number of job holders who were part time for economic reasons decreased by -212,000 to 3,717,000, which is a decrease of -673,000 since before the pandemic began.
  • Health care employment rose by 18,000, a YoY gain of  174,900, or 1.1%, despite being the most critical sector during the pandemic.
  • State and local education jobs, another hard hit sector by the pandemic, increased 28,500.

SUMMARY

With the exception of some short term negative numbers caused by Omicron layoffs, and a further decline in average manufacturing hours, which is getting to the level of concern, this was an excellent report, buoyed in part by annual benchmark revisions. 

Monthly gains continue at a clip in excess of 500,000. At the current rate, we will have regained all jobs lost due to the pandemic by the 4th of July. The slight increase in the unemployment rate was because so many people entered the labor force. There was also some welcome news on education jobs. Only the leisure and hospitality sector remains really hard hit by the pandemic.

Perhaps the biggest news of all was the even bigger increase in average hourly wages by non-supervisory workers. A month ago I described the JOLTS report as being analogous to a reverse game of musical chairs, with jobs being the chairs and potential employees those wanting to sit in them. With a chronic shortage of people being willing to sit in the chairs on offer due to the pandemic, jobs are going unfilled, while virtually nobody is getting laid off. As a result, wages haven’t just increased, but they *continue* to increase and that rate of increase is even accelerating. Workers haven’t had it this good in decades.

So, a few clouds on the horizon (manufacturing), but another excellent jobs report.

Thursday, February 3, 2022

Jobless claims: Omicron still rules the roost, but effects abating


 - by New Deal democrat

It is clear that Omicron has continued to result in increased layoffs, but the effect is probably abating.

New claims declined 23,000 last week to 238,000 - still well above its pandemic low of 188,000 set early in December, but also a big retreat from 290,000 two weeks ago. The 4 week average of new claims increased 7,750 to 255,000:


Continuing claims for jobless benefits declined by 44,000 from 1,672,000 to 1,628,000, an increase of 73,000 from its 50 year low of 1,555,000 three weeks ago:


As I have written for several weeks, the effects of Omicron are going to continue for at least a few more weeks. At this point it’s pretty clear that Omicron has had a significant impact, and may even result in a negative jobs number for January in tomorrow’s nonfarm payrolls report. 


But with cases nationwide down by over 50% from peak as of today, I still suspect Omicron will be mainly behind us by the end of February. So I still do not see a big reason to overreact to the recent increase in claims. After all, in comparison with the past few decades or even past 5 years, 238,000 is a darn good number.

Wednesday, February 2, 2022

December JOLTS report: with Omicron raging, the pool of potential employees refuses to fill, meaning more record wage gains


 - by New Deal democrat

The Census Bureau has started to release the JOLTS report earlier in the month. So we got December’s report yesterday as opposed to in a week or two.  

Last month I introduced the idea of a game of musical chairs, where employers added or took away chairs, and employees tried to best allocate themselves among the chairs. Because of the pandemic, there are several million fewer players trying to sit in those chairs. As a result, wages have continued to increase sharply, as employers attempt to attract potential employees to sit in the empty chairs.

This pattern continued in December.

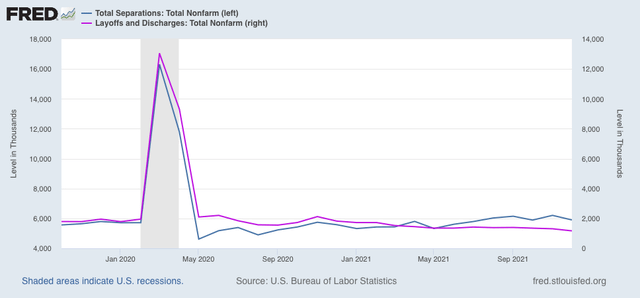
Layoffs and discharges (violet, right scale in the graph below) decreased 140,000 to 1.169 million, yet another new record low. Total separations (blue) declined 305,000 to 5.900 million:


Essentially, nobody is getting laid off.

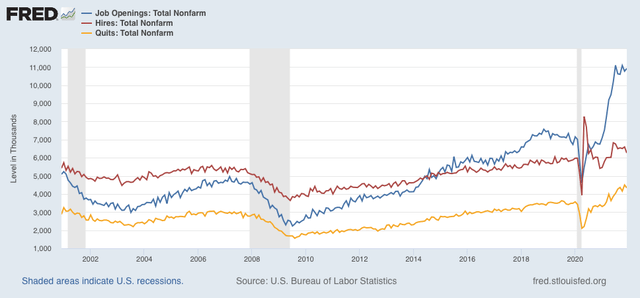
Meanwhile, job openings (blue in the graph below) increased 150,000 to 10.925 million, a little below the July peak of 11.098 million. Openings have been basically steady for the past 6 months at record high levels. Voluntary quits (the “great resignation,” gold, right scale) declined -161,000 from November’s record high, to 4.338 million. Actual hires (red) declined -333,000 to 6.263 million, significantly below the June high of 6.827 million:


Hires and quits are in line with the relatively modest employment gains in the past few months compared with earlier in the year.

In summary, we continue to have near-record high job openings and quits, record low layoffs, with still-strong total separations, and slightly fading hires. Once again, little progress is being made towards establishing a new equilibrium.

As a result, wages continue to soar. Let me debut a new graph which I think shows the dynamic better than I have before. 

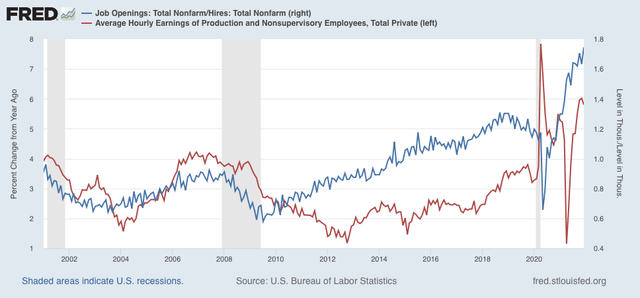
Below I show job openings divided by actual hires (blue, right scale). This gives me the rate at which openings are above or below hires, where 1.0 represents the level at which the number of openings and hires are equal. As you can see, this rate increases as expansions go on, and in the last 18 months has repeatedly made new all-time highs.

YoY wage gains for non-managerial workers (red, left scale) are a “long lagging” indicator, typically turning up well after an expansion is underway, and typically when the U-6 underemployment rate falls below about 9.0% (we’re at 7.3% now, the lowest except for the late 1990s tech boom and during 2019):

The result is that, as the rate of job openings for each hire has completely blown through prior highs almost every month in the past year, wage growth has responded by similarly spiking to the upside, to nearly 6% YoY. 

 So long as the shortfall in available workers to fill openings persists, potential employers will have to continually offer more compensation to attract applicants.In other words, wages will continue to rise until the potential employer can no longer make any profit off the potential employee for that job.

For the past several months, I have speculated that, in order for the situation to resolve, the first thing I want or expect to see is a further increase in monthly hiring. At the same time, or shortly thereafter, I would expect to see a significant decline in voluntary quits.

But this increase in hiring is only going to occur if potential employees feel safe returning to work. And that hasn’t happened with Omicron raging; and it won’t happen until more people feel the pandemic is abating. Until then, no dice.

Tuesday, February 1, 2022

Manufacturing continues strong in January; construction continued to sag in December


 - by New Deal democrat

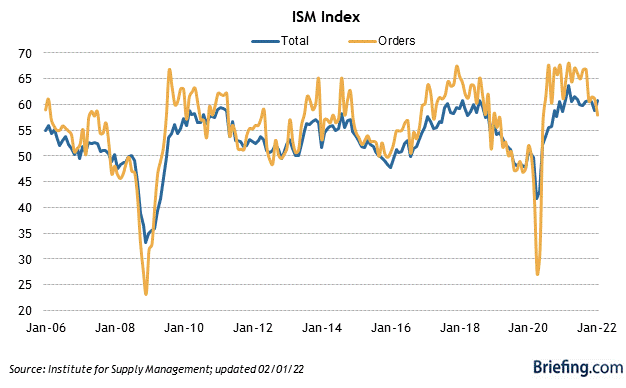
As usual, the first data for last month starts out with the ISM manufacturing report. This index, especially its new orders subindex, is an important short leading indicator for the production sector. 

In January the index declined from 58.8 to 57.6, as did the more leading new orders subindex, which declined from 61.0 to 57.9 (note the breakeven point between expansion and contraction is 50):


Both the total index and the new orders subindex ran extremely hot throughout 2021, typically with readings over 60. In the past several months these have cooled a little bit, but are still very positive. This continues to forecast a strong production side of the economy through mid year 2022, if not so ‘red hot’ as before.

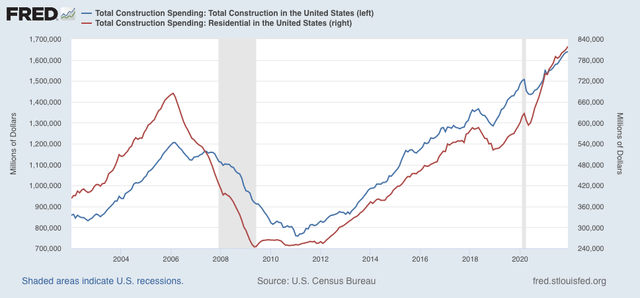
The second release that typically begins the month, construction spending for two months ago (December), rose 0.2% in nominal terms for overall spending including all types of construction, while spending on the leading residential sector rose 1.1%. Nominally, both made new all-time highs:


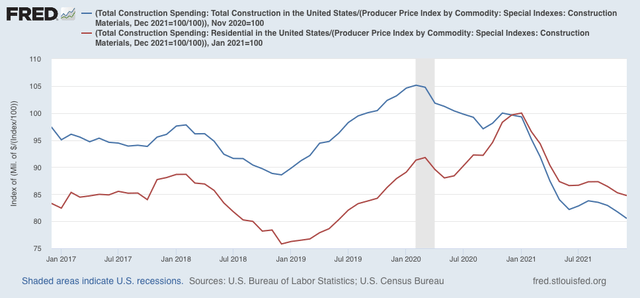
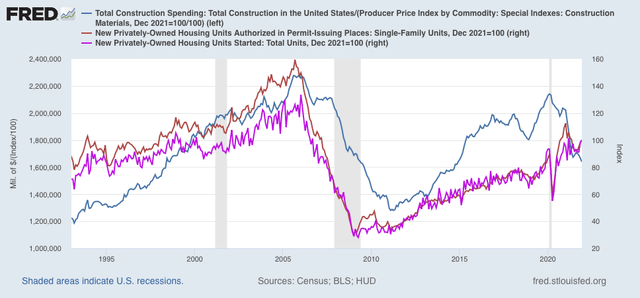
Adjusting for price changes in construction materials, which jumped another 1.7%, “real” construction spending declined -1.5% m/m, and “real” residential construction spending declined -0.6%. In absolute terms, “real” construction spending has declined sharply - by -20.5% - since its peak in November 2020,  while “real” residential construction spending has declined -15.7% since its post-recession peak in January of this year:


While total construction spending declined by more than it had before the Great Recession, the decline in residential construction spending, while increasingly substantial, remains nowhere near the big decline it suffered before the end of 2007, in this series that only dates from 1993. Comparing it with single family permits (gold), and housing starts (violet) below:


confirms that residential construction spending is not yet a recession level decline. This is important, since as my long term forecast yesterday indicated, housing is an important such indicator, and as of now is one of the negative inputs.

Monday, January 31, 2022

My long leading forecast through the end of 2022


 - by New Deal democrat

My long leading forecast that goes 12 months out is now up at Seeking Alpha.

I am as nerdy as can be, and follow the same indicators over and over, no matter what their message. And their message has been changing over the past 6 months. To find out what that means for the latter half of this year, click on over and read the article.

As usual, this will equip you to see ahead for a year to come; and it will reward me a little bit for getting you that information so early.

Sunday, January 30, 2022

On the retirement of Justice Breyer: is this any way to run a country?


- by New Deal democrat


Long long ago I remember reading that Justices William Brennan and Thurgood Marshall, both about 70 years old at the time, decided not to retire during the Presidency of Jimmy Carter, because he was not liberal enough, preferring to wait for the next, more left-wing Democratic President. Heh!  

Liberals got lucky when, upon Brennan’s retirement in 1990, David Souter was named to replace him. They weren’t lucky when Marshall retired due to badly declining health in 1991 and was replaced by Clarence Thomas. Marshall died only 4 days after Bill Clinton became President; and Thomas, the first GOP Justice selected explicitly for his young age at the time (he was only 43 years old when confirmed to the Supreme Court) still sits upon the Court over 30 years later.

Of course, that same scenario played out less than two years ago when Justice Ruth Bader Ginsburg, having refused to retire during Obama’s Presidency (allegedly even after a direct appeal from Obama in 2013 when he correctly feared losing the Senate in 2014), died and was immediately replaced by the 48 year old Justice Amy Barrett.

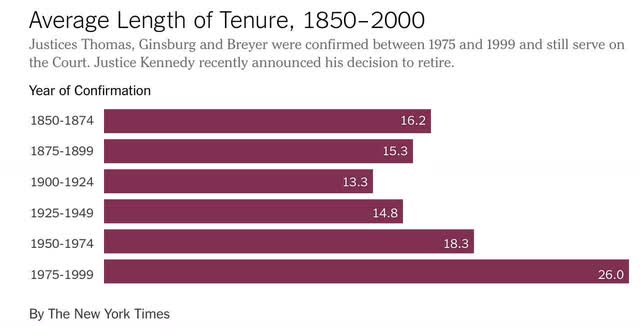
A few years ago I calculated  that, during the 19th Century, the median tenure for a Supreme Court Justice was 14 years. With immense gains in longevity during the late 20th Century, and the explicit practice of selecting young candidates in their 40s in order to maximize their partisan impact with lifetime appointments, since 1950 that median had increased to 20 years; and I calculated that by 2018, it would be 30 years.

The New York Times, writing two years after me, discussed the same phenomenon and included the following helpful graph:


Further, as I wrote several months ago, the anti-Federalist Brutus correctly predicted that Supreme Court Justices, once they realized that their power was almost completely unchecked under the Constitution, would enact their partisan preferences into Supreme Law. As we watch a radically reactionary majority on the Court systematically dismantle the 20th Century, there are deeper questions to be asked than just focusing on the current personnel. 

Namely, since the US Constitution enshrines judicial supremacy: is this any way to run a country? Why should the whims and egos of 9 individuals, deciding whether and when they want to retire, or whether they intend to serve until they drop dead, absolutely determine the rights and obligations of over 300 million people; and the fundamental structure of the government that shapes those rights and obligations?

Simply, had Brennan and Marshall retired during Jimmy Carter’s Presidency, or had Ginsburg resigned during Obama’s, the fundamental supreme law of the United States would be drastically different than it is now (and even more so than it is likely to be in a couple of years). Why on earth should that be the case? Why should the idiosyncrasies of a few philosopher kings and queens absolutely govern our lives?

Over the years my position on the Supreme Court has become more radicalized. It has changed from the need to convince elderly Justices like Breyer to retire, to the more fundamental position that we should not have to engage - sometime futilely, viz., Ginsburg - in this persuasion. 

Even if the size of the Court were expanded now, that would only cause the GOP to expand it further when they returned to power, leading to a further expansion by Democrats later, etc. For the good of the Republic, the very structure of the Court must be reformed.

First and foremost, that means term limits. With 9 Justices, one Justice’s position should expire every 2 years (essentially, an 18 year term). After serving on the Court, to fulfill a lifetime appointment, they should continue to serve as “Justices emeritus” on one of the regional Courts of Appeal.

Beyond that, there is the problem that the Court is not “overtly” a political branch. They are a bunch of lawyers who are not required to have any political sense. In other words, they can be utterly tin-eared. In 1857, believing that they were settling the slavery issue permanently, Chief Justice Roger Taney and a majority of the Court essentially ruled that slavery must be permitted everywhere. It was a decisive turning point igniting the fuse that led to the Civil War, and 700,000 deaths, less than 4 years later. When the Court overturns abortion rights a few months from now, I suspect the reaction by the clear majority of Americans who vehemently disagree will be on par with the reaction of the North to Dred Scott. Say what you will about politicians, they are sufficiently calculating that they collectively have a sense of how far they can go without provoking a violent counter-reaction. No such political sense restrains the Philosopher Kings and Queens on the Supreme Court.

When such tin-eared opinions are issued, there needs to be a mechanism to temper them without the need to have 2/3’s of both Houses of Congress and 3/4’s of all States approve first. For example, Canada’s Constitution has a “Notwithstanding” clause that permits provinces to overrule their Supreme Court. Allowing the Congress and the Presidency to stay a majority opinion of less than 2/3’s of the Court at least long enough for the next Congressional and Senate elections to determine whether or not to accept the ruling - or at least some similar check on the Court - is needed.

Saturday, January 29, 2022

Weekly Indicators for January 24 - 28 at Seeking Alpha


 - by New Deal democrat

My Weekly Indicators post is up at Seeking Alpha.

While most of the chatter this past week was about inflation and the Fed raising interest rates, commodities got hot again, with oil making another 7 year high.

This is both good and bad. It’s good because it shows that the global economy is really running hot. And it’s bad because, well, the global economy is really running hot - and the steps taken to cool it off are not going to be good for ordinary workers.

As usual, clicking over and reading will bring you up to the virtual moment on the state of the economy, and will reward me just a little bit for the effort I put in.

Friday, January 28, 2022

Real personal income and spending both decline in December; no imminent worry but evidence of softening


 - by New Deal democrat

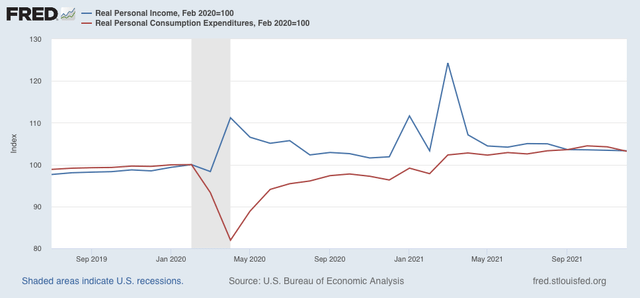
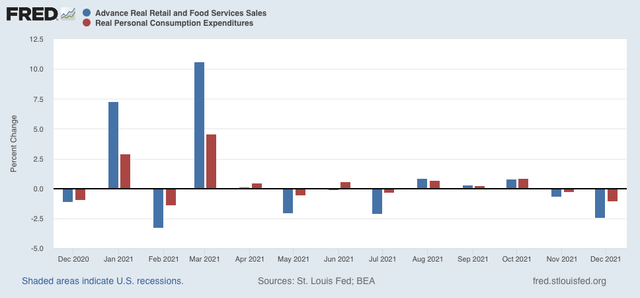
Nominal personal income rose 0.3% in December, while spending declined -0.6%. In real terms after inflation, personal income declined -0.1%, and personal consumption expenditures declined -1.0%. Nevertheless both remain well above their pre-pandemic levels: 


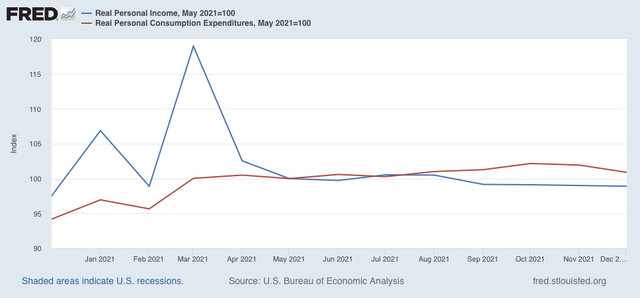
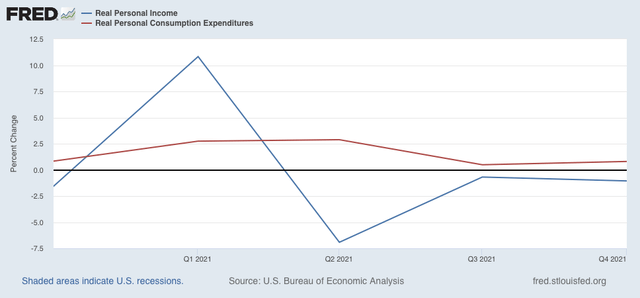
Here is what the same information looks like using May 2021 as a baseline, after all the stimulus money had been expended:


Since then spending is up 0.9%, while income has declined -1.1%.

Comparing real personal consumption expenditures with real retail sales for December (essentially, both sides of the consumption coin) reveals both faltered for the second month in a row:


Because so many people front-loaded their Christmas spending into October, the subsequent decline is not too concerning. On the other hand, the quarterly graph below shows that real personal income declined in each of the last three quarters of 2021. I think this decline (along with COVID) explains most of the decline in the approval for Joe Biden and Congressional Democrats in general:


I have been expecting the economy to soften (although no recession at least through the middle of this year), and this morning’s income and spending data adds to the evidence.

Thursday, January 27, 2022

Real Q4 GDP completes the Boom of 2021, while long leading components warn of weaker 2022 to come


 - by New Deal democrat

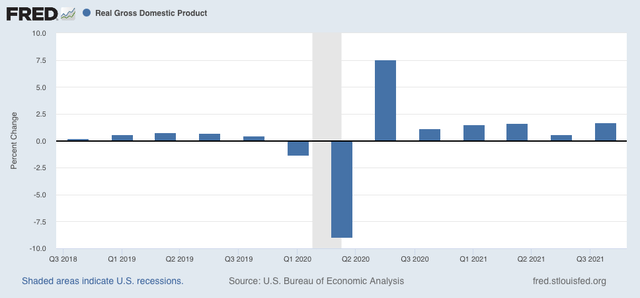
Nominal GDP increased 6.9% in the 4th Quarter of 2021. After taking into account inflation, it increased 1.7%:


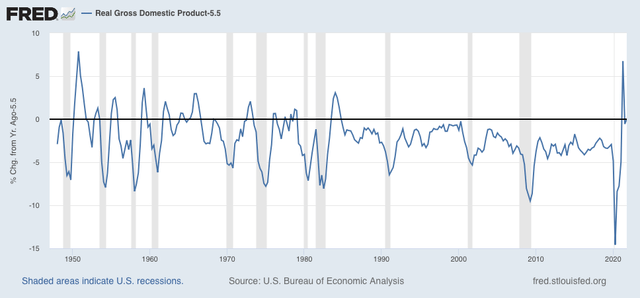
The last six economic quarters together have been the biggest economic Boom since 1983-84, as shown in the below graph showing YoY real GDP growth, minus the 5.5% of 2021, going all the way back to 1948:


That’s pretty impressive. But it is also the rear view mirror.

To see what lies ahead, there are two components of GDP which are helpful: real residential fixed investment (housing) and proprietors income (a proxy for business profits). Both of these have long and good track records as helping forecast the economy one year in advance. And here, the news is not so good.

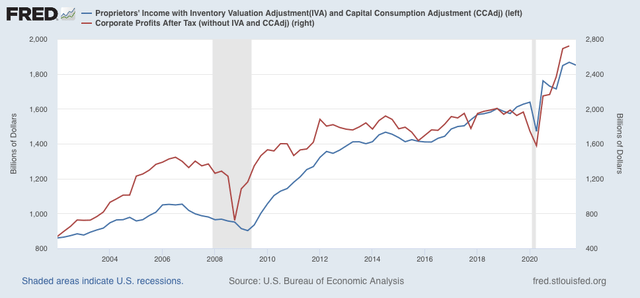
Proprietors income (blue in the graph below) declined -0.9%, even before taking into account any inflation adjustment. Note that this generally rises and falls with corporate profits (red), although it is not quite so leading. But since the latter won’t be reported for at least another month, it is a good placeholder:


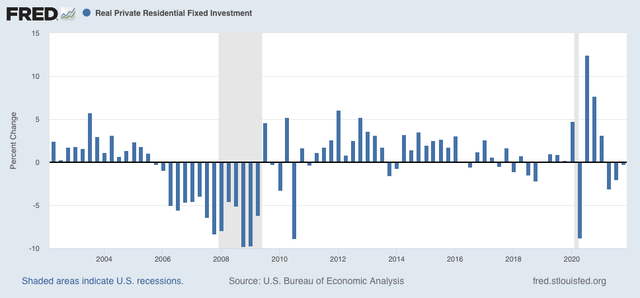
The news is also bad in housing, as real residential fixed investment declined for the 3rd quarter in a row:


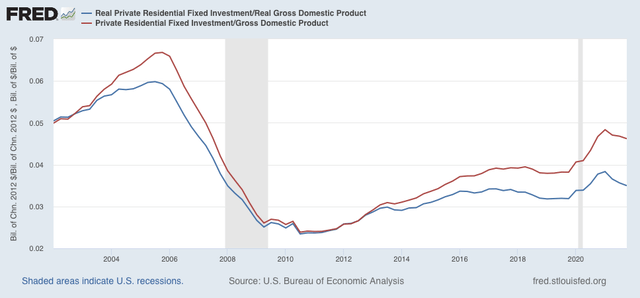
Both nominal and real residential fixed investment as a share of GDP (the actual measurement that is part of the long leading indicators) also declined:


The decline in the housing component is not surprising. Monthly data in housing permits and starts declined by recessionary margins all the way through October of 2021. That business profits may have topped out as well is not a good sign, although this is only the first quarter of decline, and obviously may be a false signal.

Both of these long leading indicators are among the array I track. I plan on posting my forecast for year end 2022 shortly at Seeking Alpha, and will reference it here.

With seasonality over, it is clear that Omicron is responsible for increased layoffs


 - by New Deal democrat

With seasonality behind us, it is apparent that Omicron has resulted in increased layoffs.

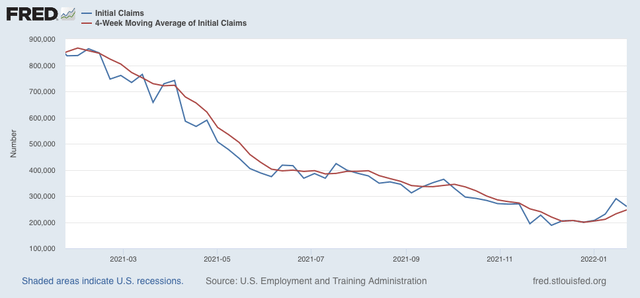
New claims declined 30,000 last week to 260,000 - still well above its pandemic low of 188,000 set early in December. The 4 week average of new claims increased 15,000 to 247,000:


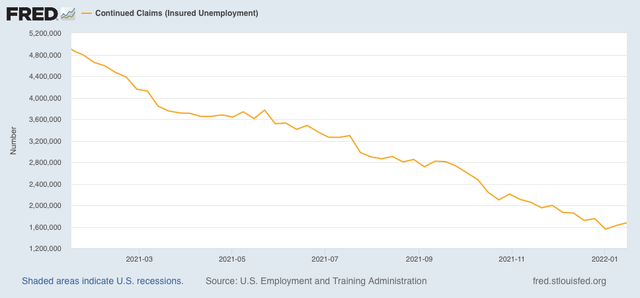
Continuing claims for jobless benefits rose for the second week in a row, by 51,000 to 1,575,000, 120,000 above its 50 year low set two weeks ago:


Last week I wrote that “The effects of Omicron are going to continue for at least a few more weeks. The quirks of seasonality should resolve after another week. Until I see more going on, I do not see any reason to overreact to the last two weeks’ big increase in claims.” At this point it seems clear that Omicron has had a significant impact. At the same time, with cases nationwide down 20% from peak as of today, I still suspect Omicron will be behind us by the end of February. So I still do not see a big reason to overreact to this increase in claims, to what is still in the long run an excellent number.
 

Wednesday, January 26, 2022

New home sales surge, while house price measures decelerate; expect deceleration or even downturns in each


 - by New Deal democrat

Since I didn’t post yesterday, let me catch up today with a note on both new home sales and prices.


New home sales (blue in the graph below) for December rose sharply to 811,000 on an annualized basis. This is the higher monthly number since March, and while it is well above the trend since the Great Recession, it is still well below its levels from late 2020:
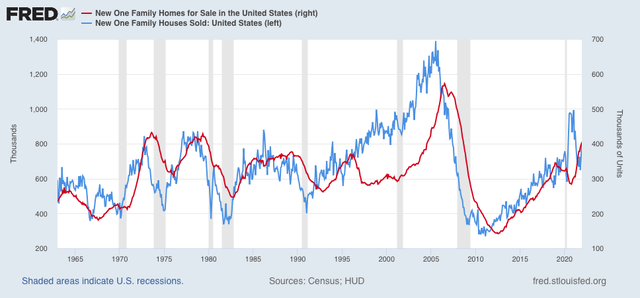

The red line is inventory. When it comes to new homes, inventory lags not only sales but also prices, so it is not surprising that inventory has increased sharply to a 10 year+ high.

While new home sales are the most leading of all housing metrics, they are very noisy and heavily revised. So in the below graph I compare them with single family permits (red), which have also increased in the last few months, but also are not at 2020 levels:
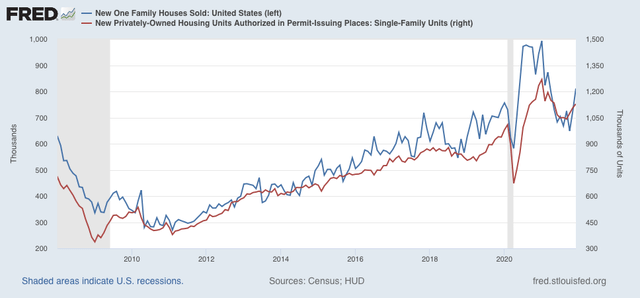

Because mortgage rates have increased significantly in the past several months, I do not expect this surge in new home buying to last much longer.

Sales lead prices, and for most of 2021 sales were down. So it should not be a surprise that on a YoY basis, price increases are at last abating, shown both monthly (blue) and quarterly (black) in the graph below:
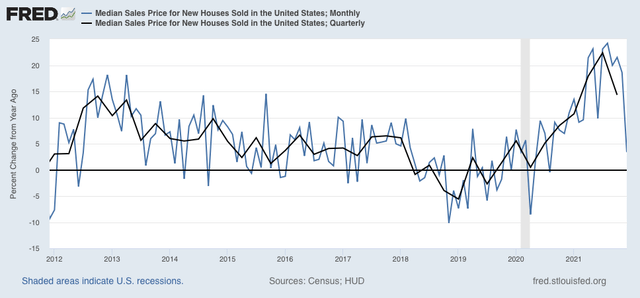

In December, prices were only up 3.4% from one year prior. Since the data is noisy on a monthly basis, the quarterly number, still high at just under 15%, but well below the sharp gains earlier in the year, is more telling.

The deceleration in YoY price gains, which nevertheless are still very high, was also the story yesterday in both the Case Shiller and FHFA house price indexes (light and dark blue in the graph below, /2 for scale). Also shown are the YoY% gains in rent of primary residence and owner’s equivalent rent (how the CPI measures housing inflation)(light and dark red):
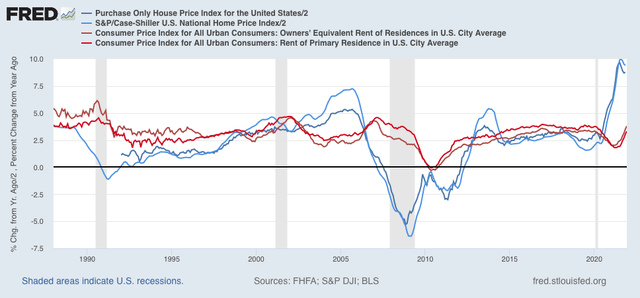

My purpose in the above graph is to show that both house price indexes track one another closely, as do both “official” measures of housing inflation. Additionally, as I’ve previously pointed out, house price increases tend to bleed over into the official inflation measures with about a 12 to 18 month lag. Thus on a YoY basis price increases bottomed in 2019, but did not bottom in the official measures of rent until the beginning of 2021. Since the YoY% increase in house prices peaked in mid year 2021, we can expect the “official” CPI housing measure to continue to increase on a YoY basis through roughly late 2022.

This doesn’t necessarily mean that the *total* inflation measure will continue to increase throughout this year. Below I again show the YoY% change in owners’ equivalent rent as above, but also the total inflation index (gold). Most importantly, note that sometimes they track in tandem, but also that generally during the entire house price boom, bubble, and bust from 1995 to 2015 they tended to move in opposite directions:
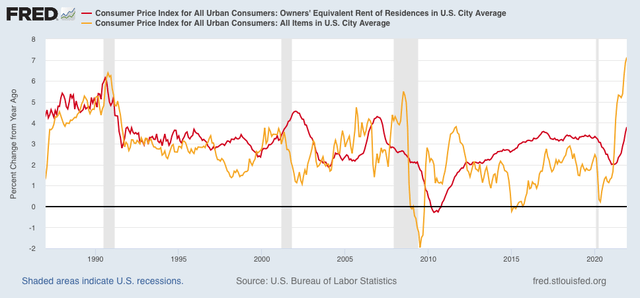

Why did this happen? Sometimes, as during 1995-2015, home ownership and apartment renting are alternative goods. When more people decide to leave apartments and move into houses, house prices increase while rents flatten. This is generally what happened during the boom and bubble. Then during the bust people were forced to abandon houses and move back into apartments. This is shown in the below graph of homeownership:
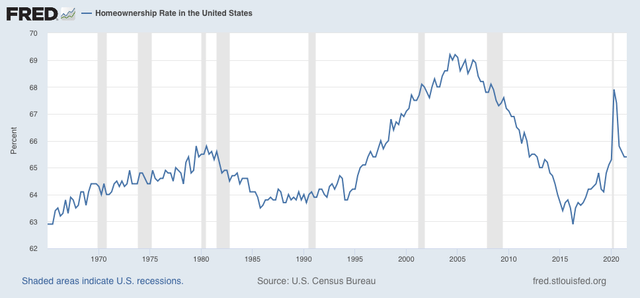

Note the huge upward surge until the housing bubble popped, followed by the equally sharp deflation.

Finally, let’s factor in interest rates set by the Fed, shown in black below:
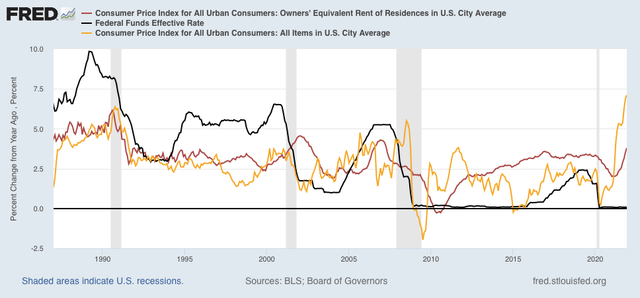

As CPI increases, the Fed typically increases interest rates. By the time the fully effect in owners’ equivalent rent is felt, Fed rate hikes have typically cooled the economy, meaning that the remaining majority of the overall consumer inflation index declines.
Bringing our discussion back to the present, we see that total inflation has been rising sharply since just after the pandemic hit. Owners’ equivalent rent started to rise about 9 months ago. Part of the delay was the big increase in the homeownership rate during that time, driving rents and house prices in opposite directions. The consensus is that the Fed will raise rates several times this year, perhaps starting as early as this spring. If they indeed do so, they will probably continue to embark on hiking rates until the economy slows or even reverses, enough so that price increases - other than rents - decelerate considerably. But while rent measures will continue to accelerate this year, house price increases themselves are likely to continue to decelerate, or even stall in the months ahead.