- by New Deal democrat
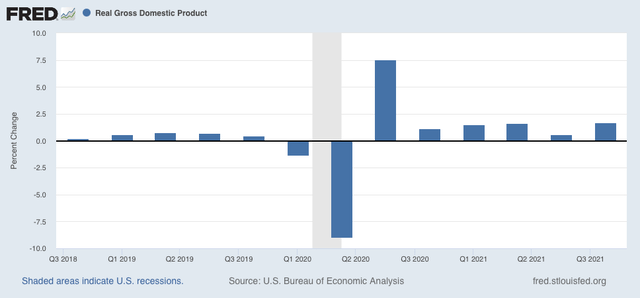
Nominal GDP increased 6.9% in the 4th Quarter of 2021. After taking into account inflation, it increased 1.7%:
The last six economic quarters together have been the biggest economic Boom since 1983-84, as shown in the below graph showing YoY real GDP growth, minus the 5.5% of 2021, going all the way back to 1948:
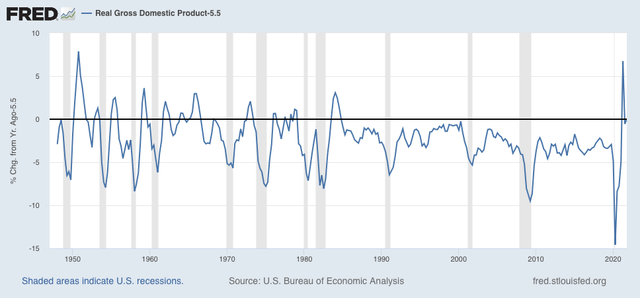
That’s pretty impressive. But it is also the rear view mirror.
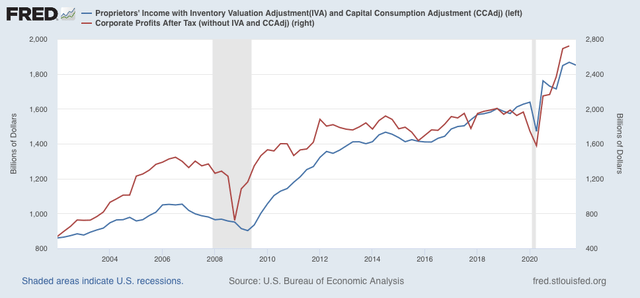
To see what lies ahead, there are two components of GDP which are helpful: real residential fixed investment (housing) and proprietors income (a proxy for business profits). Both of these have long and good track records as helping forecast the economy one year in advance. And here, the news is not so good.
Proprietors income (blue in the graph below) declined -0.9%, even before taking into account any inflation adjustment. Note that this generally rises and falls with corporate profits (red), although it is not quite so leading. But since the latter won’t be reported for at least another month, it is a good placeholder:
The news is also bad in housing, as real residential fixed investment declined for the 3rd quarter in a row:
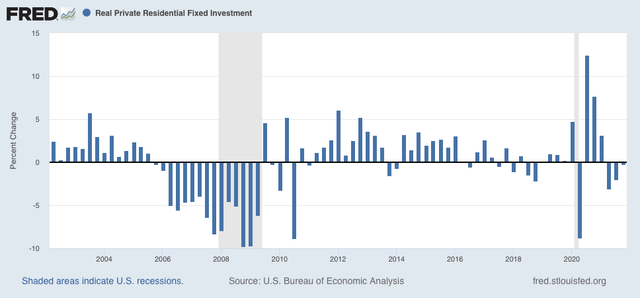
Both nominal and real residential fixed investment as a share of GDP (the actual measurement that is part of the long leading indicators) also declined:
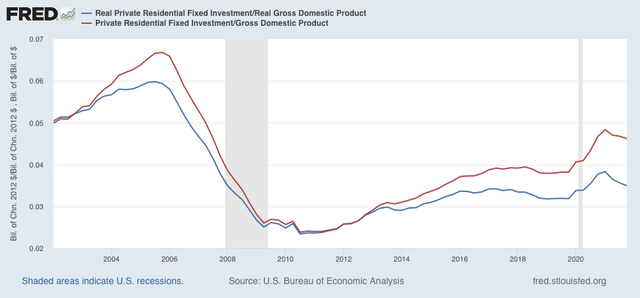
The decline in the housing component is not surprising. Monthly data in housing permits and starts declined by recessionary margins all the way through October of 2021. That business profits may have topped out as well is not a good sign, although this is only the first quarter of decline, and obviously may be a false signal.
Both of these long leading indicators are among the array I track. I plan on posting my forecast for year end 2022 shortly at Seeking Alpha, and will reference it here.