Saturday, February 27, 2021

Weekly Indicators for February 22 - 26 at Seeking Alpha


 - by New Deal democrat

My Weekly Indicators post is up at Seeking Alpha.

After months of virtually no changes in any of the time frames, suddenly there is activity in all of them. Some of it is short term noise due to the disaster in Texas, some is related to the pace and effects of vaccination availability against COVID-19, and some of it is the resulting change in long term interest rates.

As usual, clicking over and reading will bring you up to the virtual moment about the economy, and will bring me a penny or so for my troubles.

Friday, February 26, 2021

January personal income and spending show how important government stimulus has been to keeping the economy afloat


 - by New Deal democrat

This morning’s report on January personal income and spending shows just how important the stimulus packages enacted by the federal government both last spring and last month have been to sustaining the economy.


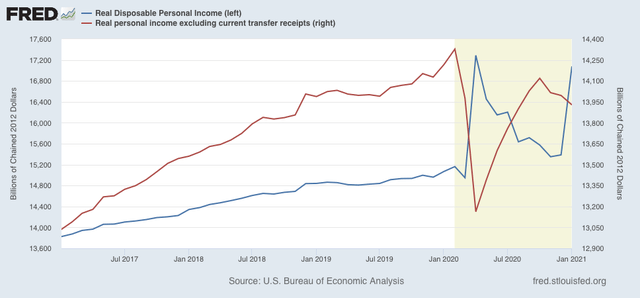
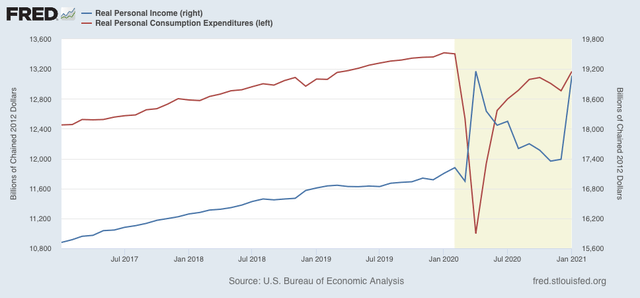
After adjusting for inflation both personal income and spending rose in January, by +9.7% and +2.0%, respectively:


The huge increase in income is not a mistake. It follows from the renewed Congressional stimulus package providing $600 checks to most households. And it’s pretty obvious that had an impact on spending, which rose to levels equivalent to 2019 and only about 2% off peak.

The importance of the stimulus is shown dramatically when we subtract government transfer receipts from the equation, shown in red in the graph below:


Real personal income excluding government transfer receipts fell for the third month in a row, down -0.5% in January.

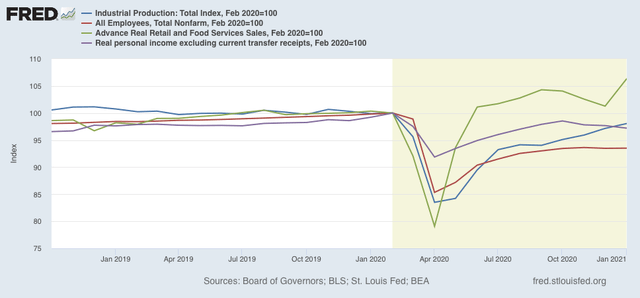
Since this last metric is the last of the four coincident metrics to be reported for January, we can now plot the general outline of the economy through last month, including production (blue), jobs (red), real retail sales (green), and real income (purple):


Industrial production has powered through the last 9 months and is now only -1.8% below its level last February. Real sales are actually higher by 6.4%. Job growth has generally stalled in the last 3 months, but only declined outright in the month of December. But without transfer receipts from government, income is down -2.8% since last February.

*IF* we continue to make good progress with vaccinations, and they prove effective against the new variants of covid-19 as well as the original virus, then by mid-year we could see production higher than before the recession, most likely leading the NBER to declare that the recession was a brief but very deep two month affair (last March and April) with a one year+ recovery which is turning into a full-fledged expansion.

Thursday, February 25, 2021

Initial jobless claims: it appears that the worst of the winter 2020-21 increase is behind us


 - by New Deal democrat

Let me start off this week’s review of initial jobless claims by pre-debunking something I am sure is going to be said elsewhere: a lack of reporting in Texas did *not* appreciably skew this week’s numbers. Applying the same workaround I did for Hurricanes Sandy and Harvey, I.e., subtracting the affected State’s data from the unadjusted number, to see how much it is at variance with all the other States, shows that Texas’s underreporting due to its electricity crisis was less than 20,000 at worst in a week with little seasonal adjustment. In other words, being very generous, the “real” seasonally adjusted number of initial claims at worst probably would have been only about 30,000 higher - I.e., 760,000 - but for Texas issues.

Additionally, last week’s nationwide numbers were actually revised *down* by 20,000, unlike the two prior weeks which saw very large upward revisions.

With those two introductory remarks out of the way, let’s look at the data. 

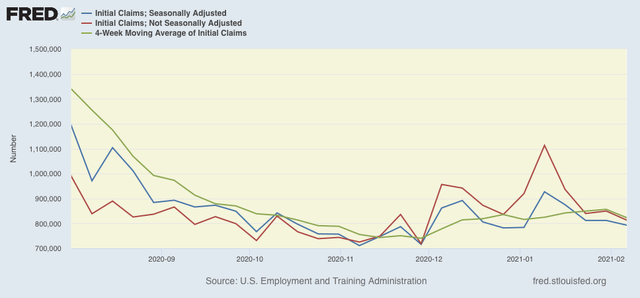
This week, on a unadjusted basis, new jobless claims declined by 131,734 to 710,313. Seasonally adjusted claims decreased by 111,000 to 730,000. The 4 week moving average declined by 20,500 to 807,250. 

Here is the close up since the end of July (these numbers were in the range of 5 to 7 million at their worst in early April): 
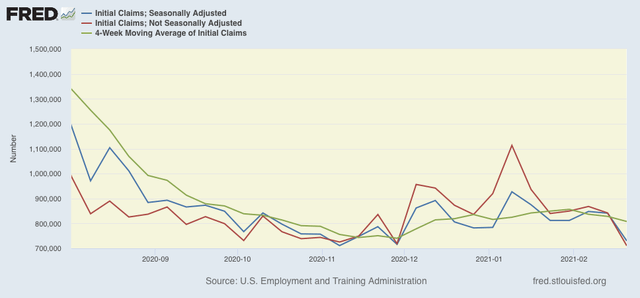
The good news is that recent increases seem to have plateaued. Nevertheless both adjusted and unadjusted claims remain above their worst levels at the depths of the Great Recession.

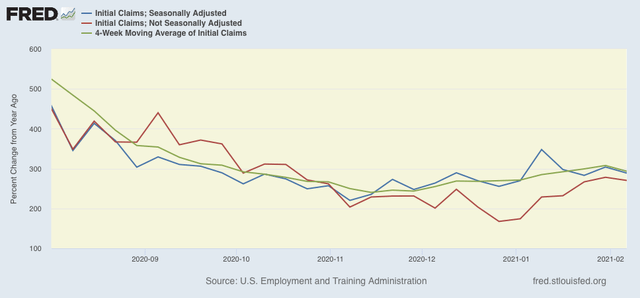
Because of the huge swings caused by the scale of the pandemic - typically claims only vary by 20,000 or less from week to week, but since the start of the pandemic, swings of 50,000 or 100,000 per week have happened as often as not, recently I began posting the YoY% change in the numbers as well, since they will be much less affected by scale. As a result, there is less noise in the numbers, and the trend can be seen more clearly:
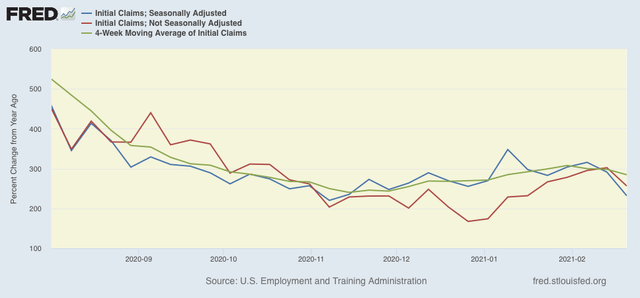
The recent elevation in new claims compared with their November lows is clear. As of this week, it also appears clear, especially in the 4 week average,  that claims have plateaued. As spring begins in the warmer parts of the country, we can expect increased outdoor activity and a relative recovery in employment servicing those activities.


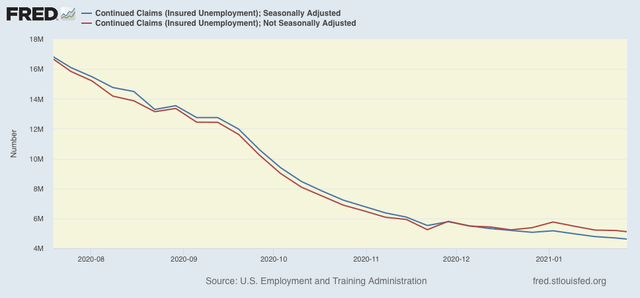
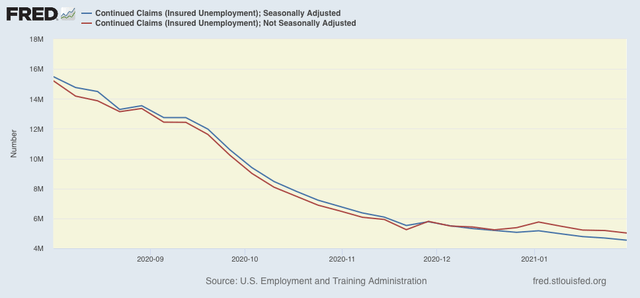
Meanwhile continuing claims, which historically lag initial claims typically by a few weeks to several months, made new pandemic lows yet again this week. Seasonally adjusted continuing claims declined by 101,000 to 4,419,000, while the unadjusted number declined by 143,320 to 4,828,027:
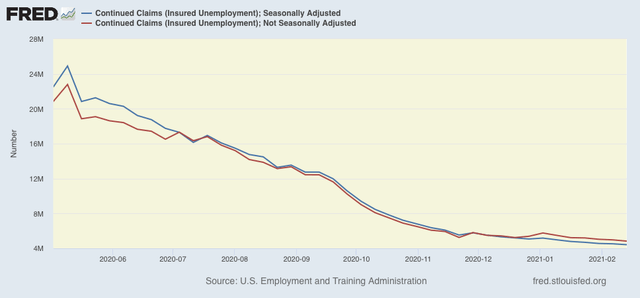

I had suspected that we would see an upward reversal, but obviously that did not happen. Continued claims remain at levels last seen in autumn 2009, only a few months after the Great Recession.

I continue to expect that the onset of better weather in spring (fewer indoor activities) and more vaccinations will mean that we have finally put the worst of the job losses behind us. 

Wednesday, February 24, 2021

New home sales rise m/m, but signal caution for housing market going forward


 - by New Deal democrat

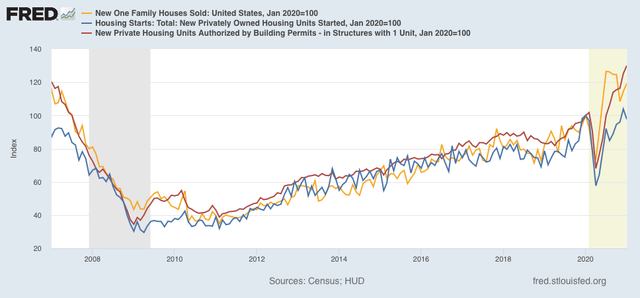
New home sales increased to a three month annualized high of 923,000 in January. This is of a piece with the positive news last week on housing permits. At the same time, the pace remains below the recent high of 979,000 annualized set six months ago in July. The below graph compares housing starts (blue) with the much less volatile single family permits (red) and the even more volatile, and heavily revised, new home sales (gold), normalized to 100 as of January 2020:


The reason to pay attention to new home sales is that, despite their volatility, they tend to peak and bottom before any other housing metric including permits and starts. So the fact that they have not made a new high in 6 months adds a note of caution to the otherwise sizzling housing market.

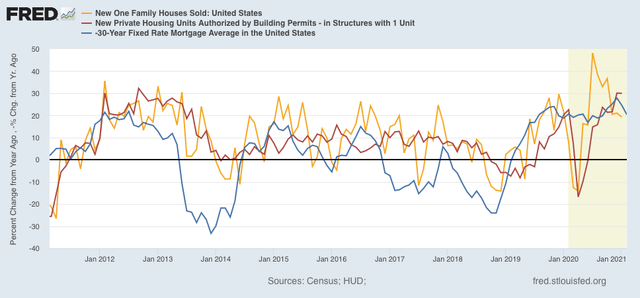
New home sales also tend to be more responsive to changes in mortgage rates.  Recently these have begun to increase, following longer term US treasury rates (shown inverted YoY% change) higher:


Note that in 2014, when mortgage rates rose by about 1%, permits never declined significantly YoY. But new home sales did.

If interest rates plateau, or continue to rise, this is the first yellow flag that permits and starts may stall as well - and, based on historical trends, will do so while home prices are still rising.

Tuesday, February 23, 2021

Coronavirus dashboard for February 23: vaccinations start to have a dramatic effect


 - by New Deal democrat

Total US coronavirus deaths: 500,310

Total US confirmed infections: 28,190,159

Total US vaccinated (at least 1 dose): 44,138,118
Total US vaccinated (both doses): 19,438,495

The good news is, roughly 9.5% of the US population age 18 or over has received both doses of a vaccine. Over 20% has received at least one dose.

The bad news is that we have reached the milestone of half a million dead. Further, probably at least 40,000,000 people have been infected, since many who have no or mild symptoms don’t ever get tested.

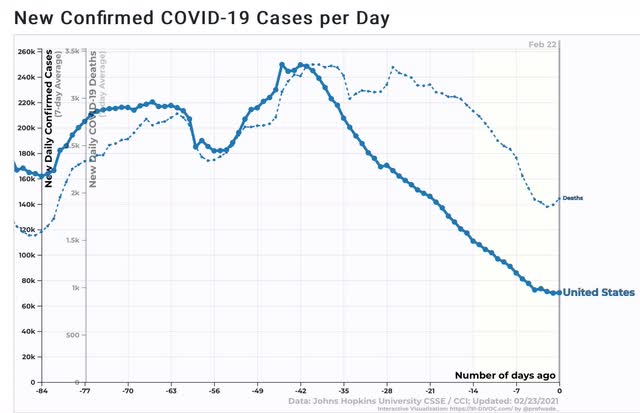
Here’s the graph of the 7 day average of new infections and deaths for the US over the last 12 weeks:


While there has been a decline of over 2/3’s in infections, and 40% in deaths, this only puts us even with the very worst levels of the summer outbreak.

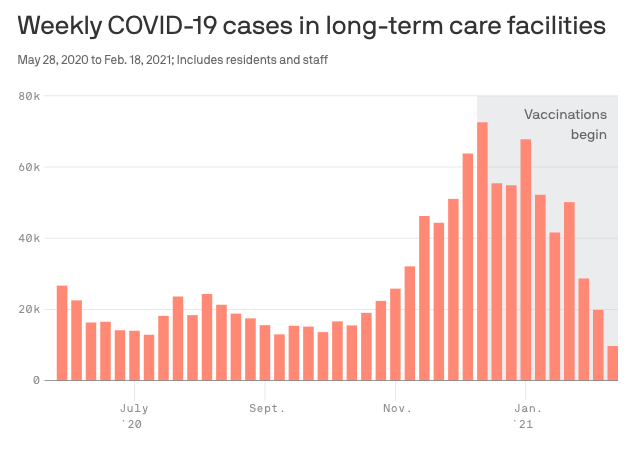
But there is increasingly dramatic evidence that the vaccines are having a real impact. Since the elderly in long term care facilities were the first to be vaccinated, that is where we would first expect to see an impact. And here it is, graphically:


New infections have declined by nearly 90% in these facilities since vaccinations began, and are lower than they have been since at least 8 months ago.

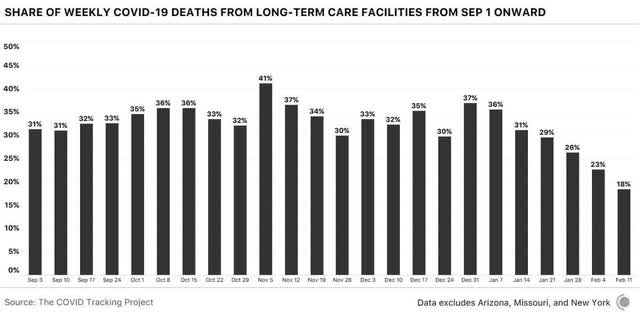
Here is a similar graph from one week ago, showing the percent of all coronavirus cases that arose from long term care facilities:


The share of total cases declined by 50%. But since, over the same time span, *total* cases themselves declined 50%, that means that the total number of cases in long term care facilities declined by roughly 75%!

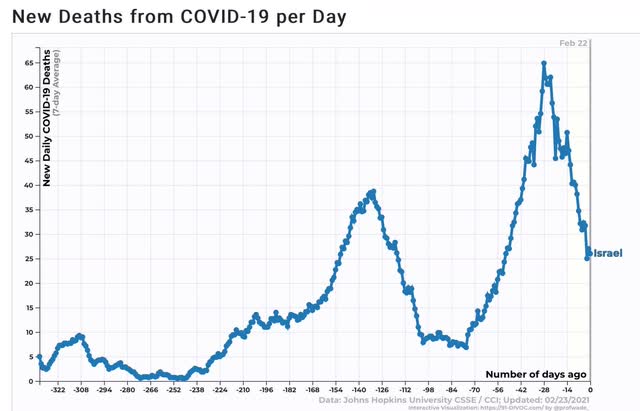
The situation is similar in bellwether Israel, which has delivered doses equivalent to about 80% of its total population since December. Deaths are down over 60%:


And when those who have been vaccinated are compared with those in similar situations who have not been vaccinated, the outcome is even more dramatic:


The 7 day average of those who were vaccinated declined by about 2/3’s, while the decline among those not vaccinated was only 10%.

There is simply no reasonable doubt that, as matters now stand, the vaccines are going to be very effective, probably by the Fourth of July, in nearly halting deaths due to the virus in the US - and that includes the new variant strains.


Monday, February 22, 2021

You’re reading the right blog: 2021 economy edition


 - by New Deal democrat

“You’re reading the right blog” is an old chestnut (for me anyway) that I used to say from time to time to highlight a correct forecast that your (not so?) humble blogger made well in advance of more widely read sources.


Well, please bear with me for one more self-pat on the back.

For at least 6 months, I have been saying that the economy was poised to pick up strongly in 2021 once the pandemic loosened its grip. Most recently I repeated that in my short term and long term forecasts for 2021 over at Seeking Alpha.

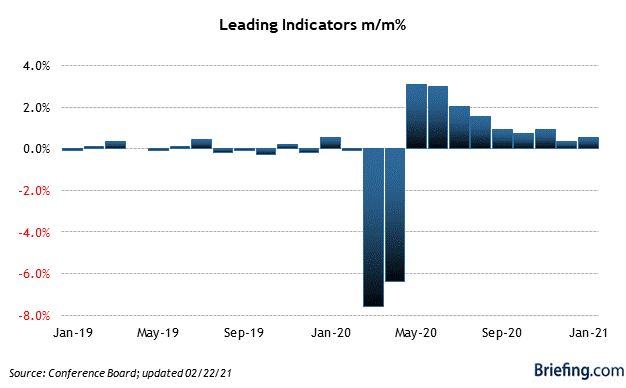
And this morning, January’s index of leading indicators came in at plus 0.3%, the 9th positive reading in a row:


If the next 3 months are simply unchanged, the YoY comparison is going to be the most positive in two decades.

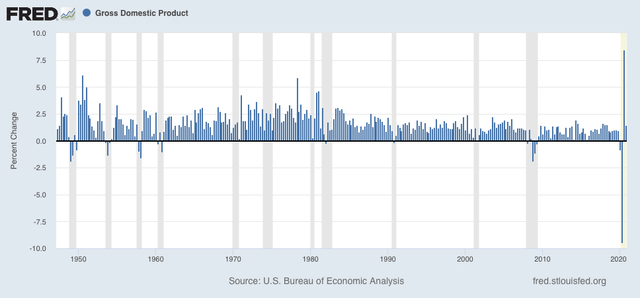
Meanwhile, as Bill McBride has pointed out, both public and Wall Street forecasts for q/q Q1 GDP are, well, through the roof:

Merrill Lynch: 5.5%
Goldman Sachs: 6.0%
NY Fed nowcast: 8.3%
Atlanta Fed GDP now: 9.5%

(Note: all forecasts SAAR)

The only other times in the past 75 years when the q/q change has been this high were in 1950 and 1978, plus the Q3 rebound last year from the Q2 lockdowns:


So, ... ahem ... you’ve been reading the right blog.

Saturday, February 20, 2021

Weekly Indicators for February 15 - 19 at Seeking Alpha


 - by New Deal democrat

My Weekly Indicators post is up at Seeking Alpha.

We are continuing to see breakout strength in a number of  short leading indicators, as well as housing. The continued elevated reading in new jobless claims is the one contrary signal.

As usual, clicking over and reading helps put a little $$ in my wallet, and brings you up to the virtual minute in how the economy is doing.

Friday, February 19, 2021

Strength in housing and cars, oh my!


 - by New Deal democrat

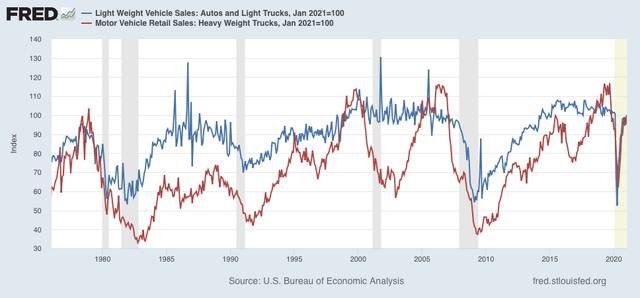
The two consumer goods which turn down before recessions, and up before recoveries, are houses and motor vehicles, in that order.


Since January housing permits and starts came out yesterday, let’s take a look at both.

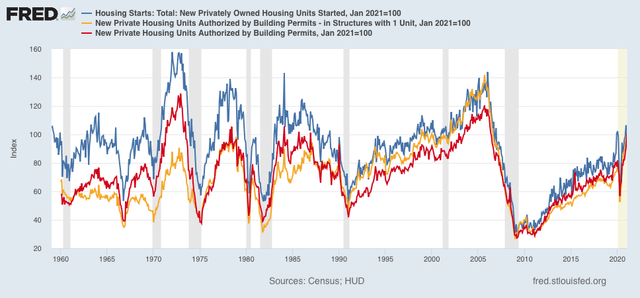
First, while housing starts retreated slightly from their December levels, the more leading and less volatile permits, and the even less volatile single family permits, both made new 14 year highs. The below graph normalizes all three series to 100 as of yesterday’s report, better to show the long term context:


Starts were not so high as in prior booms, but permits were higher than at virtually all past periods except for the early 1970s and the early 2000s bubble.

That’s really strong, and as I’ve said many times over the past half a year, bodes really well for the broader economy in 2021 once the pandemic is brought under control.

Second, it’s a similar story when we turn to motor vehicles. The below graphs normalize both cars and light trucks (blue) and heavy trucks (red) to 100 as of their most recent January data:


Both are closing in on, but not yet at, their prior peaks.

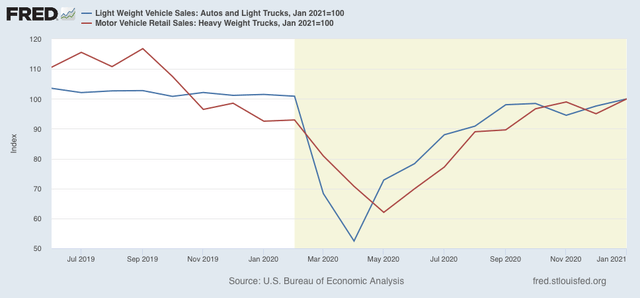
The below is the same information zoomed in on the past 18 months:


Heavy trucks are back about 3/4’s from their worst pandemic levels, and cars and light trucks about 90%.

In short, both of the most important household purchases have returned to close to or have even exceeded their pre-pandemic levels. I am confident this strength is going to expand into the broader economy over the next 3 to 6 months unless there is an unexpected setback in the abatement of the pandemic.

Thursday, February 18, 2021

Jobless claims: huge upward revisions for the second week in a row


 - by New Deal democrat

The story this week is the repeated massive upward revisions to last week’s numbers

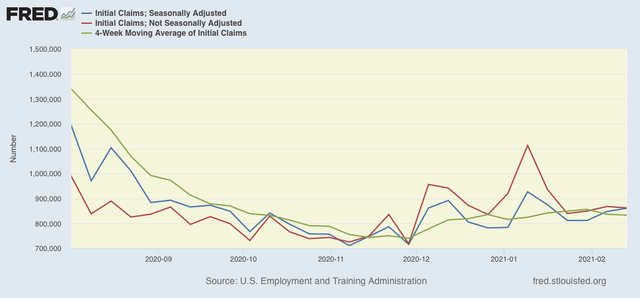
This week, on a unadjusted basis, new jobless claims declined by 5,702 to 862,351. Seasonally adjusted claims increased by 13,000 to 861,000 (meaning last week’s original number of 793,000 was revised higher by almost 50,000! - the 2nd week in a row for huge upward revisions). The 4 week moving average declined by 3,500 to 833,250. 

Here is the close up since the end of July (these numbers were in the range of 5 to 7 million at their worst in early April): 

The “relatively good” news is that, despite the upward revisions, the recent increases seem to have plateaued. At the same time, both adjusted and unadjusted claims remain above their worst levels at the depths of the Great Recession.

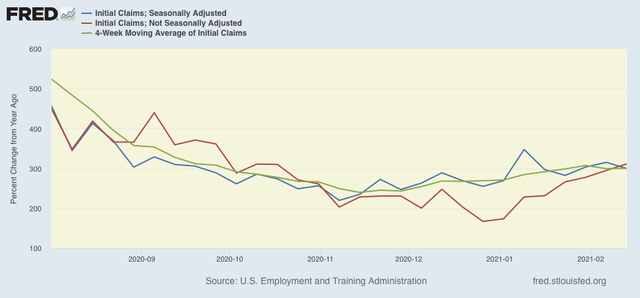
Because of the huge swings caused by the scale of the pandemic - typically claims only vary by 20,000 or less from week to week, but since the start of the pandemic, swings of 50,000 or 100,000 per week have happened as often as not, recently I began posting the YoY% change in the numbers as well, since they will be much less affected by scale. As a result, there is less noise in the numbers, and the trend can be seen more clearly:

The recent elevation in new claims compared with their November lows is clear. The possible plateauing of new claims - except for unadjusted claims, which have continued to increase YoY - in the past few weeks, is much more up in the air, given the huge revisions in the past few weeks.


Meanwhile continuing claims, which historically lag initial claims typically by a few weeks to several months, made new pandemic lows yet again this week. Seasonally adjusted continuing claims declined by 64,000 to 4,494,000, while the unadjusted number declined by 93,576 to 4,945,014:


I had suspected that we would see an upward reversal, but obviously that hasn’t happened. Continued claims remain at a level last seen in autumn 2009, only about 6 months after their worst levels of the Great Recession.

Although I am concerned by the huge upward revisions in the past several weeks, I remain hopeful that the disciplined approach to the pandemic by the Biden Administration, together with the onset of better weather in spring (fewer indoor activities), and more vaccinations, will mean that we either have, or are about to have, put the worst of the job losses behind us. 

Wednesday, February 17, 2021

Industrial production continues strong growth


 - by New Deal democrat

If real retail sales (reported on in the prior post) is the best proxy for the health of the consumer, Industrial production, the King of Coincident Indicators, is the same for production. 

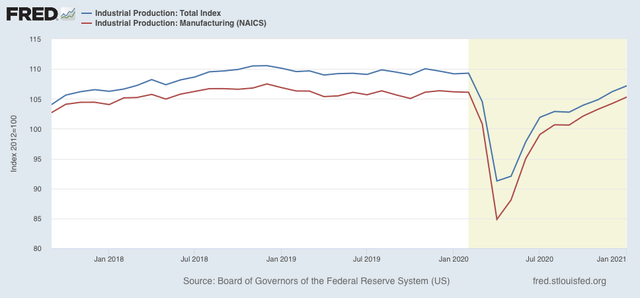
And the news there was also very good. Overall production rose 0.9% in December, and the manufacturing component rose 1.0%. As a result, overall production is only -1.9% below its level just before the pandemic hit last February, while manufacturing is only down -0.8% since then:


At the current pace, manufacturing should be *up* YoY in one month, and overall production in two.

Manufacturing, along with housing, has been the very best sector of the economy since the bottom of the pandemic recession last April, and it continues on a very good trajectory now. As I said with retail sales earlier this morning, this is yet more evidence of an economy primed to soar once the pandemic is brought under control.

Blockbuster January retail sales presage gains in jobs


 - by New Deal democrat

[NOTE: I’ll report separately on industrial production later this morning.]


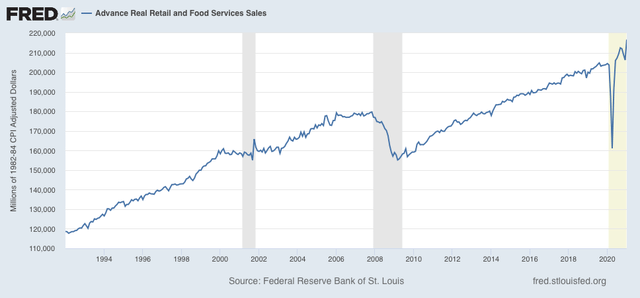
Real retail sales is my bellwether for the health of the consumer. And after 3 months of declines, we got a huge upturn in January. Before adjusting for inflation, retail sales jumped 5.3% - not annually, 5.3% in one month! After adjusting for inflation, sales were up 5.0%, to a new all-time high:


This is simply very good news, and adds to the evidence that, once the pandemic is under control, the economy is going to accelerate.

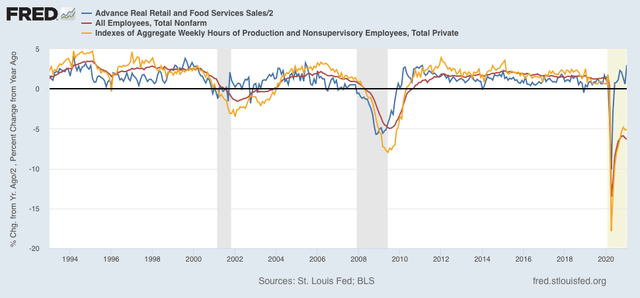
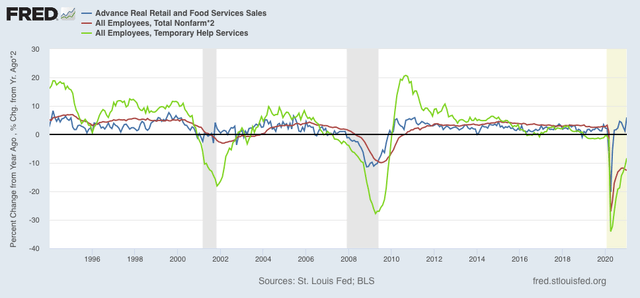
I also use retail sales as a very good short leading indicator for employment. Because the series is somewhat noisy, I use the YoY% change (which was up 6.0% in real terms)  to anticipate what is likely to happen with the jobs numbers several months down the road. And once again, the news is good, both for overall jobs (red) and for the more granular number of aggregate hours of employment (gold):


The YoY growth in sales in the past 5 months has been equivalent to that during most of 2010. While neither jobs nor hours growth matched the growth rate quickly thereafter, the comparisons consistently got better and better. 

Because temporary help jobs lead overall employment, the below graph again compares sales (blue), jobs (red), and temporary help jobs (green) YoY:


Because of this month’s good news is retail sales, I expect to see further gains in temporary help in next month’s jobs report (perhaps turning positive YoY), which is already presaged by the weekly Temporary Staffing Index having turned positive in the past several weeks.

For the past 2 months I have written that “I continue to expect employment to continue to rise - with a lag, and quite possibly a pause during this winter as the pandemic continues to rage - to match the level of sales.” Last month I added that “we certainly got the ‘pause’ in December’s employment report, and if we get more initial jobless claims reports like yesterday’s, a further downturn. But I still expect employment to rise to meet sales once the winter surge in cases and shutdowns of outdoor activities including dining both abate.” That is still my opinion, reinforced by this morning’s retail sales report.

Tuesday, February 16, 2021

My long leading forecast for all of 2021


 - by New Deal democrat

I have a new post up at Seeking Alpha. Usually after Q4 GDP is posted at the end of January, I update my long leading indicators for the next 12 month outlook. 

I’m about 3 weeks late this year, mainly because the pandemic remains in control of the economy. But with vaccinations picking up steam, and the prospect of many people resuming more normal kinda-sorta activity in the next few months, it’s worthwhile to take a more comprehensive look at what is likely to happen once the logjam breaks.

As usual, clicking over and reading should be informative for you, and puts a penny or so in my pocket as well.

Monday, February 15, 2021

On the effects of COVID vaccination, Israel is the bellwether


 - by New Deal democrat

I’m beginning to see some clickbait reports of COVID diagnoses after two doses of the vaccine, together with breathless reporting by some RW’ers and LW’ers that the vaccines are not very effective. I’m here to tell you to beware these headlines and reports.

For example, here is a report out of Oregon that 4 people were diagnosed with COVID after their second doses of vaccine. Sounds scary, right? But if you read carefully, you see that while the *diagnosis* was made more than 14 days after the 2nd dose of the vaccine. That doesn’t mean that the *infection* occurred more than 14 days after administration of the 2nd dose, which would be more significant. In other words, it is perfectly likely that the infection started before the 2nd dose took full effect.

Further, of the 4 cases reported, two were mild - and two were completely asymptomatic. None of them were hospitalized, let alone died.

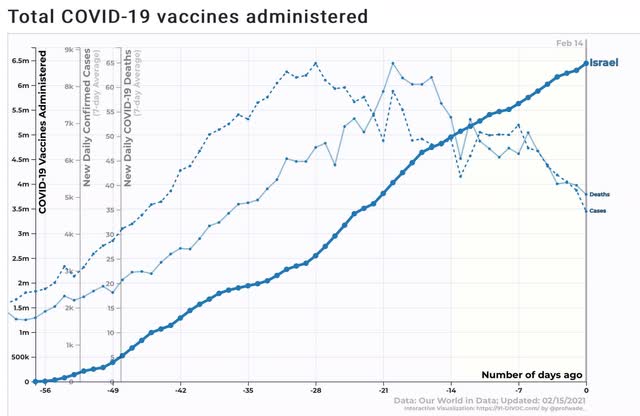
Fortunately, within the next 30 to 60 days the world is going to get some excellent data on the real effects of vaccination. That’s because Israel is on track to have its entire adult population fully vaccinated by that time.

The population of Israel (including children) is roughly 9 million. So far, 6.5 million doses of the Pfizer vaccine (which requires 2 doses) have been administered. At the current rate, in about 8 weeks close about 14 million doses will have been administered, meaning the entire adult population will be vaccinated. In 10 weeks the vaccines should have taken full effect.

Here is where things stand in terms of new infections, deaths, and total vaccines administered in Israel:


If all goes well, new deaths should continue to trend down, and be close to zero in about 10 weeks. That would be a spectacular result. If it doesn’t happen, then we will have to see where there might be problems.

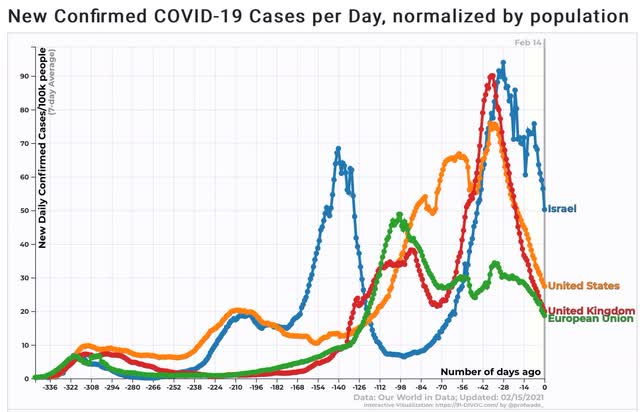
By the way, don’t assume that the recent decline in new infections has to do with vaccination, because there have been similar declines pretty much everywhere in the northern hemisphere:


It very much looks like there was a spike caused by get-together over the winter holidays, which has now (relatively speaking!) ebbed. Note that the US is the only country with a secondary spike that just happens to exactly coincide with 2 weeks after Thanksgiving.

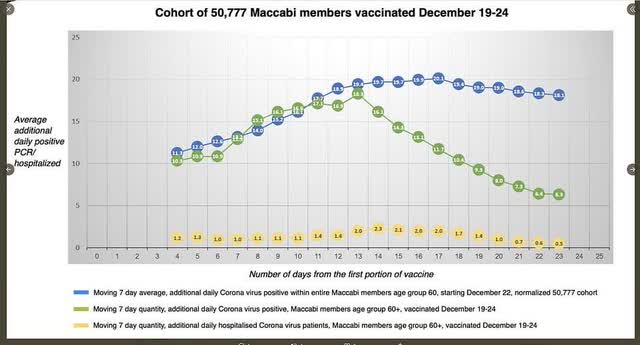
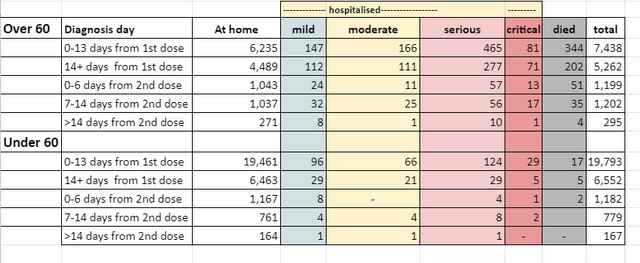
To return to my main point, in the meantime, Israel has performed a study of 1.5 million people, half of which were vaccinated. Here is the spreadsheet of infections, hospitalizations, and deaths for those vaccinated:


After 14 days after the 2nd dose, there were ZERO deaths among those under 60, and 4 deaths among those over 60. Again, it’s not clear if *any* of the *infections* actually took place that far out.

All of the available evidence so far is that these are *excellent* vaccines, but they don’t make the recipients, especially those over 60, “bulletproof.” Until there is herd immunity, older people in particular should continue to wear masks, and avoid indoor dining (where the new very infectious mutations can be very efficiently spread by younger people who are not yet vaccinated and are not wearing masks).

Saturday, February 13, 2021

Weekly Indicators for February 8 - 12 at Seeking Alpha


 - by New Deal democrat

My Weekly Indicators post is up at Seeking Alpha.

We are beginning to see some changes in the short leading timeframe. Most notably, this week, for the first time since last February, temporary staffing is higher YoY. That means that employers are hiring more staff in anticipation of better economic conditions in the months ahead, but aren’t certain enough to make a firm commitment yet.

As usual, clicking over and reading will bring you up to the virtual moment, and help me out with a little pocket change.

Friday, February 12, 2021

Welcome to the vaccination Hunger Games

  - by New Deal democrat

That, dear reader, is a slight variation on what my sibling unit said to me when I related the saga of my attempts to schedule a COVID-19 vaccination.


As I have mentioned from time to time, I am an Old Fossil. And, well, the shortage in supply of the COVID vaccines has set off a fierce (if anything involving Old Fossils can qualify as “fierce”) competition for very limited slots.

What your helpful neighborhood MegaPharmacy has chosen to do is to open up their website for vaccination appointments pretty much in the middle of the night. If you haven’t made your appointment for a date in the next week by the time of your first morning coffee, you are shut out.

So yesterday I intrepidly opened the vaccination portal immediately after getting up in the morning, only to find that the three nearest sites to me were already booked up. So I tried to book at the fourth, about 45 minutes away, and lo and behold, there were slots available today!

After navigating through the sign-up process, which took about 10 minutes, I was greeted with a confirmation screen - which revealed that I had misspelled the name of the city I wanted, and had been redirected to a town over 4 hours away. I furiously tried to backtrack and get to a closer site, only to find that in the 15 minutes I had been online, they had been all booked up.

Which meant I could either accept the appointment about 200 miles away, or wait until next week and try again.

Guess what I am doing, dear reader, as you read this little story? That’s right, I am driving through yet another snowstorm in the East, and if I don’t get into an accident or some other calamity, by tonight I will be back home, but I will have claimed victory in Round 1 of the Boomer Vaccination Hunger Games!

Wish me luck.

Thursday, February 11, 2021

Initial and continued jobless claims: signs that the worst of the pandemic related layoffs may be behind us


 - by New Deal democrat

Some - very relative - good news in unemployment claims this week. It looks like the recent increase in new claims has peaked, while continued claims continue to decline. With new daily infections, still horrible at 100,000/day, only 40% of their 250,000/day peak, and vaccinations slowly increasing near 1.5 million/day, we may have seen the worst.

To today’s data: on a unadjusted basis, new jobless claims declined by 36,354 to 813,145. Seasonally adjusted claims declined by 19,000 to 793,000 (meaning last week’s original number was revised higher by nearly 40,000!). The 4 week moving average also declined by 33,500 to 823,000. 

Here is the close up since the end of July (these numbers were in the range of 5 to 7 million at their worst in early April): 

Both adjusted and unadjusted claims remain above their worst levels at the depths of the Great Recession.

Because of the huge swings caused by the scale of the pandemic - typically claims only vary by 20,000 or less from week to week, but since the start of the pandemic, swings of 50,000 or 100,000 per week have happened as often as not, I have been posting the YoY% change in the numbers as well, since they will be much less affected by scale. As a result, there is less noise in the numbers, and the trend can be seen more clearly:

The recent elevation in new claims compared with their November lows is clear, as is the plateauing of new claims in the past few weeks. But the evidence is also consistent with this week being noise in a rising trend, so several more weeks of data will be necessary to confirm any change.


Meanwhile continuing claims, which historically lag initial claims typically by a few weeks to several months, made new pandemic lows yet again this week. Seasonally adjusted continuing claims declined by 145,000 to 4,545,000, while the unadjusted number declined by 167,609 to 5,025,135:


Although I had suspected that we would see an upward reversal, obviously that hasn’t happened. Continued claims remain at a level last seen in autumn 2009, only about 6 months after their worst levels of the Great Recession.

I am hopeful that the disciplined approach to the pandemic by the Biden Administration, together with the onset of better weather in spring (fewer indoor activities), and more vaccinations, will mean that we either have, or are about to have, put the worst of the job losses behind us. 

Wednesday, February 10, 2021

January inflation still tame; real wages still above previous 1973 peak


 - by New Deal democrat

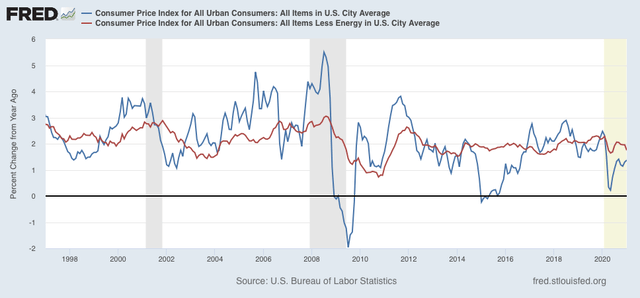
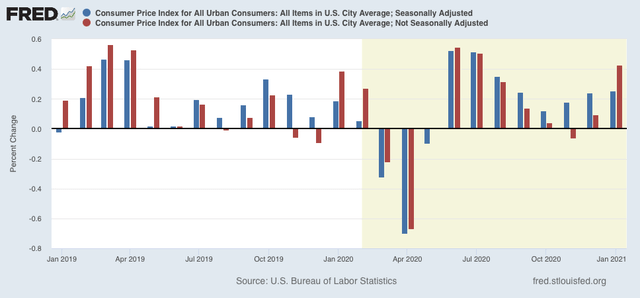
Seasonally adjusted consumer prices rose 0.3% in January. As a result, over the past several months there has been a slight uptick in YoY inflation to 1.3% from 1.1% in October. 

Aside from the pandemic, for the past 40 years, recessions had happened when CPI less energy costs (red) had risen to close to or over 3%/year. As of this month that number is only 1.8%, showing no real price pressure at all: 


Because pandemic affects are probably influencing seasonality, below I show both the  m/m adjusted and non-seasonally adjusted change in CPI:


While inflation is running higher than in 2019, in the longer term scheme of things there is no cause for concern.

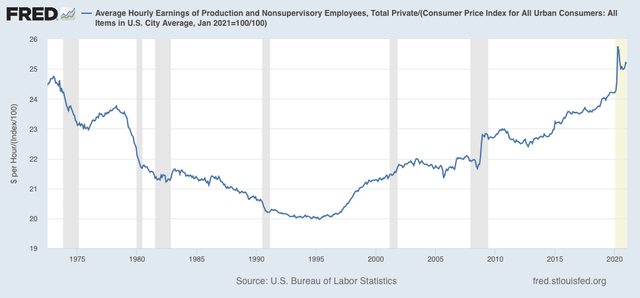
Now let’s take a look at how inflation has affected real wages. Because wages are “stickier” than prices, typically as recessions beat down prices (or at least price increases), in real terms wages rise, either during or just after a recession. That has been the case for the coronavirus recession as well. It is the “real” buying power of wages among those still securely employed during a recession that is one of the engines that usually restarts growth. 
While real wages declined -0.1% in January, since October real wages have risen close to 1%, undoubtedly as a result of the skew in layoffs, which have disproportionately affected those in the low-wage food, beverage, and entertainment industries:


Nevertheless, real hourly wages for non-supervisory workers have continued to exceed their previous 1973 peak.

Once the pandemic is brought under control, I am anticipating at least a short burst of increased inflation, as freedom beckons rather suddenly for 300 million people.

Tuesday, February 9, 2021

December JOLTS report shows renewed stalled jobs market due to out of control pandemic


 - by New Deal democrat

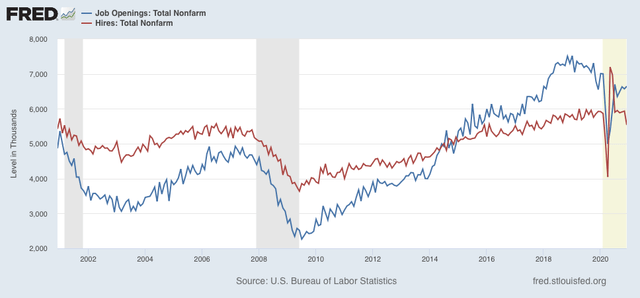
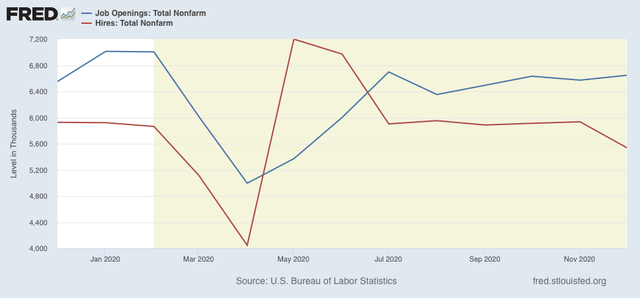
This morning’s JOLTS report for December confirmed a jobs market recovery that has  paused due to the increasing effects of the out of control pandemic. Most importantly, hires declined sharply - down by over 5% in a single month!

While the JOLTS data is a deep dive into the dynamics of the labor market, since it only dates from 2001, there are only 2 previous recoveries with which to compare the present. Nevertheless it is worthwhile to make the comparison.

In the two past recoveries: 
  • first, layoffs declined
  • second, hiring rose
  • third, job openings rose and voluntary quits increased, close to simultaneously

Let’s examine each of those in turn. In each case.

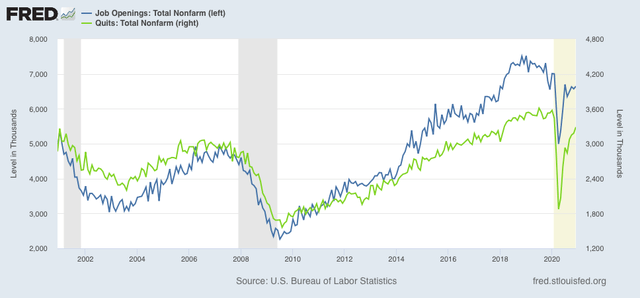
What appears below is that, although there has been some variation, the year 2020 through December has recapitulated the pattern from the last two early recoveries: the first two data series to turn - layoffs and hires - have indeed turned, while the last two - job openings and voluntary quits - have appeared to bottom but have had a much less dramatic rise. With increased pandemic restrictions and consumer caution, several renewed negative readings in November, but not enough to significantly change the trend.

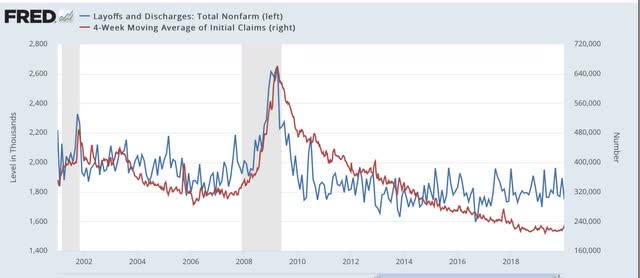
This first graph compares layoffs and discharges (blue) with the 4 week average of initial jobless claims (red) prior to this recession, for reasons of scale since March and April would be “off the charts”:


You can see that, by the end of the recessions, layoffs were already declining, and continued to decline steeply over the next 3-8 months before reaching a “normal” expansion level. The turning point coincides exactly with the much less volatile, but more slowly declining, level of initial jobless claims.

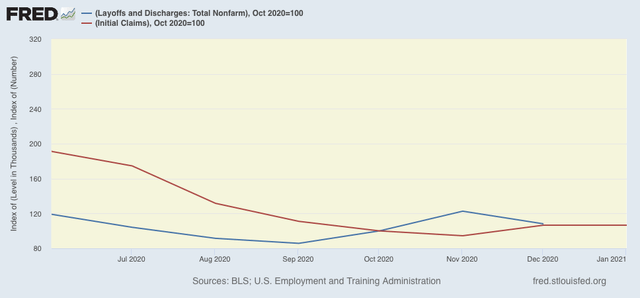
The same had been the case this year up through October. Layoffs and discharges already declined to their “normal” level in May, while initial jobless claims peaked one to two months later, and continued to decline (slowly) into autumn. Then, in November, layoffs and discharges increased and remained elevated in December. Initial claims followed suit with a one month delay: 


Next, here is the entire historical relationship between hires (red) and job openings (blue) through 2020:


In the past two recoveries, actual hires started to increase one to two months before job openings.

Both made troughs in April, but hires initially rebounded more sharply ever since May compared with job openings. Since July openings have stagnated, while hires actually declined significantly in December to their worst level since the April lockdowns:


Next, here are quits (green) vs. job openings (blue): 


In the past two recoveries, openings rose first, followed by quits, suggesting it is openings that leads to the increase in voluntary quits. That has been the case in 2020 as well.

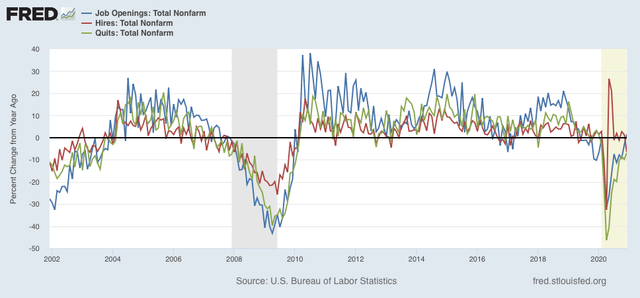
Because of the enormous moves during this pandemic year, seasonal adjustments might not be leaving us with a true picture, so here are job openings (blue), hires (red), and voluntary quits (green), measured YoY instead, for the entirety of the series up through the present:


We can see that hires rebounded first following the 2001 and 2008-09 recessions. Quits and openings moved generally in tandem with a slight lag. The same pattern generally appeared in 2020, with quits perhaps slightly lagging.

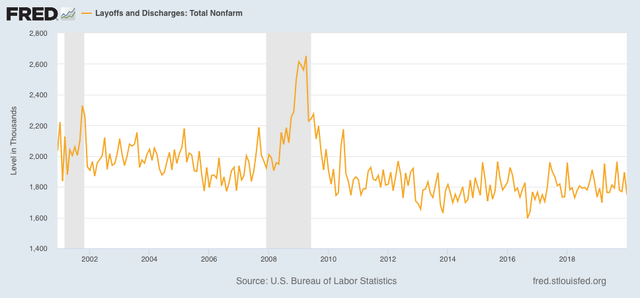
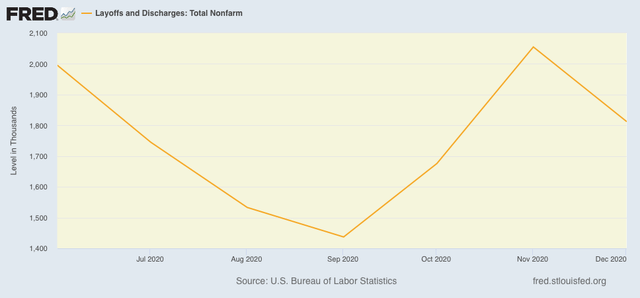
Finally, I have broken out layoffs and discharges separately below, because the their level in April and May of this year would obliterate all other variations. The first graph covers their entire history through 2019, and the second 2020 beginning in June:


This metric returned to normal almost immediately after both of the past two recessions, and did so again by June of last year, and has stayed in that normal range ever since, although layoffs and discharges have clearly increased since September.


To sum up, the December JOLTS report once again shows:

1.  A pattern generally consistent with the past 2 recoveries, with layoffs having returned to normal levels, then hiring having increased, and finally quits and openings increasing as well;

2. The late autumn and early winter surge in the out of control pandemic has shown up in  increasing layoffs and separations, and a downturn in hiring.

With new infections having sharply declined in the past 4 weeks, and 40+ million doses of vaccine administered, I am expecting a positive reversal, but not until at minimum the JOLTS report covering this month,  which will be released in April.

Monday, February 8, 2021

The short term 2021 economic forecast + brief coronavirus update


 - by New Deal democrat

At the beginning of each year, I have usually posted both short and long term forecasts. Because of the impact of the pandemic, I refrained from doing so. But with light at the end of the tunnel courtesy of the vaccines, it makes sense to do updates now.

So . . . my K.I.S.S. short term forecast is up at Seeking Alpha. As usual, clicking on over to the link will give you some useful economic information about the likely trajectory of the economy through midyear, and also reward me a little bit for the effort I put in.

Meanwhile, some significant news on the pandemic front.

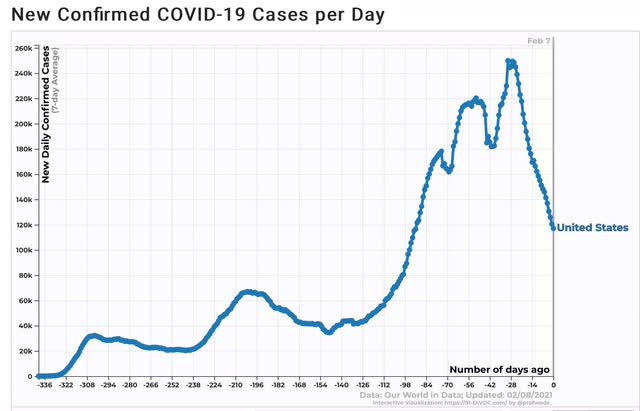
While we wait to see if the Super Bowl was another super spreader event, the one week average of cases through yesterday was at the lowest point in 3 months:

If the downward trajectory continues, we’ll be at our spring and summer averages within 3 weeks.

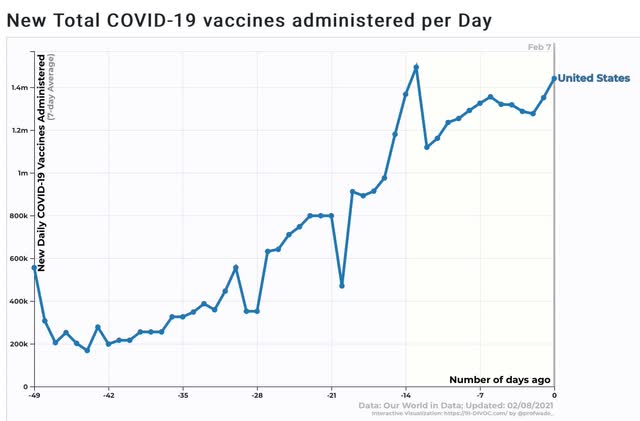
And vaccinations continue to improve, with the weekly rate at over 1.4 million daily:

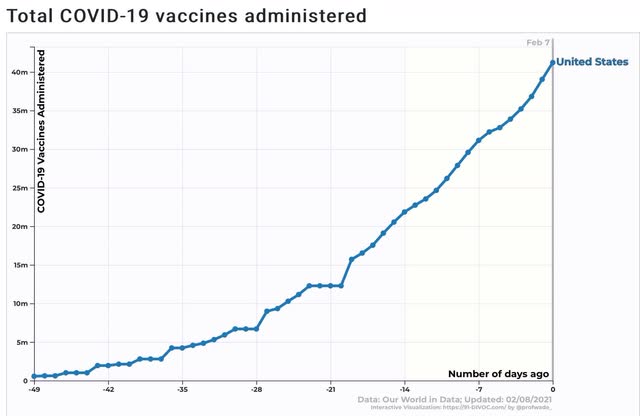
total vaccinations have reached over 40 million:

That is still less than 10% of what we need to bring the pandemic truly under control.


Saturday, February 6, 2021

Weekly Indicators for February 1 - 5 at Seeking Alpha


- by New Deal democrat

My Weekly Indicators post is up at Seeking Alpha.

All of the leading sectors - manufacturing, housing, interest rates, money supply - are revving in place, just waiting for the pandemic to be brought under control.

As usual, clicking over and reading will bring you up to the virtual moment, and bring me a tiny bit of jingle in my pocket.