Saturday, September 12, 2020

“The US is a white Christian country. Everyone else is here on sufferance:” Donald Trump, James II, and the Glorious Revolution


 - by New Deal democrat

For the past year +, I have been reading about the History of Republics -really, a History of the Rule of Law - that has taken me through Ancient Rome, Venice, Genoa, Florence, Switzerland, the Dutch Republic, and currently the Glorious Revolution of 1688 in the UK.

There are enough parallels between that event and the US in 2020 that it is worth some more detailed comparison.

Recently I came across a quote attributed to FDR that I think perfectly encapsulates the current GOP view of the United States:
“The United States is a white Christian country. Everyone else is here on sufferance.”
Now, FDR was a total political animal. He wasn’t necessarily stating his own deeply held view. Rather, more likely he was voicing his opinion of the most prevalent political ideology of the country. 

I think that quote - variously reported as “Anglo-Dutch” or “white Protestant” is spot on. It encapsulates an idea that people of color and white non-Christians (including, arguably, Catholics, or at least those who aren’t “pro-life”) are second class citizens. They are de jure equal, but are only entitled to their voice so long as they don’t disturb the hegemony of the founding white Protestants. Hence why “real America” consists of the lily-white areas of the Midwest and West, and why Whites in the South are entitled to rule their States.

Both US political parties really agree with that divide. Think about it: are Blacks and Hispanics *relatively* worse off compared to Whites when the GOP is in control?  If that is true - and I certainly believe it is - then it necessarily also means that Whites are *relatively* worse off compared to  Blacks and Hispanics when Democrats are in control.  I actually think partisans of both parties agree with both of those statements. What they differ on is which outcome is “fair.” That certainly accords with dozens of quotes I have read from partisans and regular supporters on both side of the divide.  

If you accept the main premise - that GOPers believe that the US is fundamentally supposed to be a white Christian country - then what is the #1 existential threat to that regime?  It isn’t China. It isn’t Iran. It certainly isn’t Russia.

Rather, the #1 imminent threat to that order is the Democratic Party. 

Thus, in order to preserve the US as a white Christian country, allying with Vladimir Putin to make sure that the Democrats don’t take power makes perfect sense. In fact it is laudable.

In short, once you accept this worldview, everything that the GOP does makes perfect sense. 

Which brings me to James II and the Glorious Revolution of 1688.

Yale historian Steve Pincus’s “1688: The First Modern Revolution” is kind of a revisionist-revisionist history that posits that the Glorious Revolution was neither conservative/reactionary, nor limited to the nobility and gentry, but rather was a reaction to a “modernization” scheme by James II. Since Pincus extensively reports the opinions of prior historians, I figured it would be a good read even if I didn’t ultimately agree with his contention (which, so far, I don’t).

James II’s brief reign was characterized by two goals: the substantive goal of returning the UK to Catholicism as the established religion; and the procedural one of imitating Louis XIV of France’s establishment of absolutism in the monarchy in order to get there.

To that end he used burgeoning state revenues (primarily a result of Britain’s overseas colonies) to establish and expand a standing army in all counties and cities throughout the country. He also made use of universal loyalty tests to purge the military, academia, the clergy, and municipal and county governments of opponents, and install (mainly Catholic) loyalists.

To the vast majority of the population, this transgressed one or both of two fundamental principles. James had been allowed to succeed to the Crown only because he espoused (as it turned out, in faint name only) “liberty of conscience.” His subjects initially believed that, while he was personally Catholic, their Church (mainly the Anglican Church) would be allowed to continue exactly as before. Presbyterians, Methodists, and Baptists also believed that their beliefs would not be discriminated against. The vast majority of the British were and remained opposed to the re-establishment of Catholicism as the preferred State religion. When it became clear that this was James’s true intent, he almost universally lost support.


Further, as far as the British were concerned, their King, while hereditary, ruled by law as fundamentally set forth in the Magna Carta and specifically as approved by Parliament. When James started to rule by prerogative, i.e., on his own kingly authority irregardless of the wishes of Parliament, (most especially by overturning the “Test Act” which forbade Catholics from occupying positions of authority, especially in the military),  the British correctly interpreted this to mean that no liberty and no property were safe from monarchical fiat.

Thus the vast majority of the British people supported - indeed, many of the nobility and gentry openly helped plan - the “invasion” of Prince William of Orange in Holland, and his wife Mary, James’s Protestant daughter.
   
To recap: James sought to re-establish a reactionary regime (of Catholicism) by bypassing the proper Legislature, and making use of allegedly unchallengeable Executive authority. This had profound effects on daily life, none more profound than the quartering of troops in localities throughout the kingdom, imposing on innkeepers and simple homeowners alike. 

Now let’s look at the US in 2020. Trump has been trying to re-establish a reactionary regime of white Christianity, by making use of allegedly unchallengeable Executive authority. Like James II, he is trying to establish a standing army in the form of the Department of Homeland Securty (see Portland). And like James II, he is applying loyalty tests across the board to purge every agency he can of those who might oppose his goals, including positions of nonpolitical civil servants. 

In both cases, the majority of the population is having none of it, the big difference being that James II probably had less than 20% - maybe less than 10% - support when the chips were down (the military either turned on him or simply stood aside), while Trump probably has between 40% - 45% support. Most notably, the US military command is apparently actively resisting trump’s attempts to use it politically. 

As a result, the Glorious Revolution of 1688-89 resulted in very few actual deaths. With the burgeoning of a right-wing Brownshirt movement in the US, as NRA protests have spread to anti-lockdown and anti-mask protests, and anti-BLM vigilantism, that happy result looks unlikely in the US.

Yet another parallel is likely to be what came afterward. In the case of the UK, to prevent the arising of another James II, the populace insisted that the monarchs submit to Parliamentary authority. Should Biden win the Presidency and the Democrats win the Senate, it is likely - it is *necessary* - that we will see a Constitutional push to prevent another Trump from attempting to assert unchecked Presidential authority.

Weekly Indicators for September 7 - 11 at Seeking Alpha


 - by New Deal democrat

My Weekly Indicators post is up at Seeking Alpha.

Reporting on one of the two measures I use to gauge consumer spending was discontinued this week, which was particularly unfortunate timing, because the other measure, which had been improving, reverted to negative this week. It is *posssibly* the first evidence of re-entrenchment following the expiration of the emergency Congressional unemployment aid.

In any event, clicking over and reading will bring you thoroughly up to the moment on the economy, while rewarding me ever so slightly for the effort I put in.

Friday, September 11, 2020

Consumer inflation continues to accelerate YoY, but so far no big problem


 - by New Deal democrat


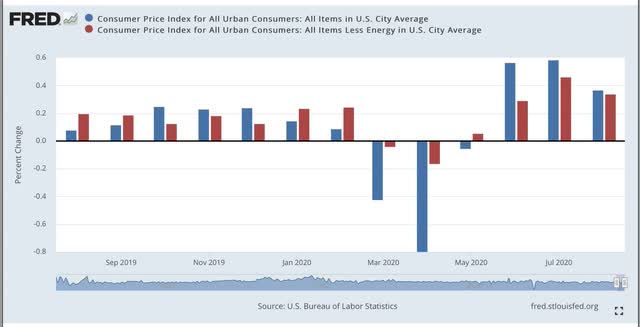
The consumer price index for August was reported up +0.4% this morning. This is the third straight big increase. Below I show this plus the more stable consumer prices minus gas (red): 


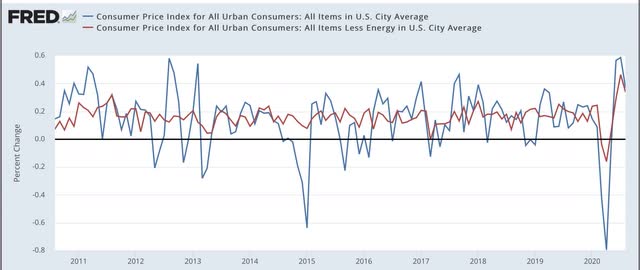
Here’s what the monthly changes look like over the past 10 years:


As you can see, these are at the upper end of monthly inflation increases for the past 10 years.

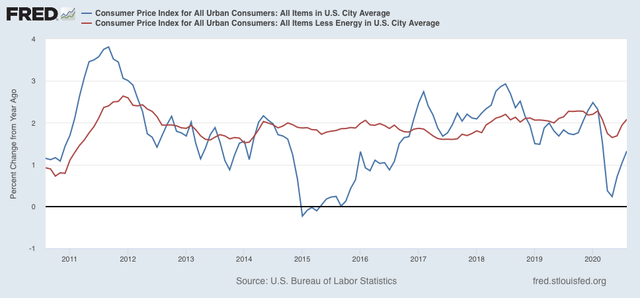
On a YoY basis, however, inflation is still pretty subdued at 1.3%. Inflation ex-gas is up 2.1%, well in the ordinary range for the past 20+ years:


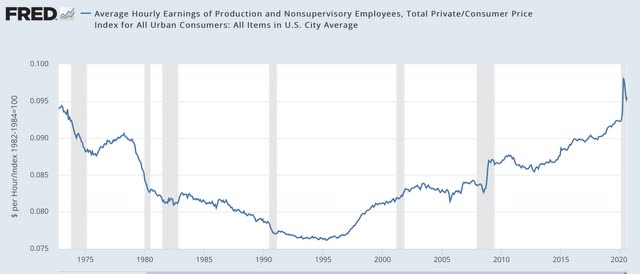
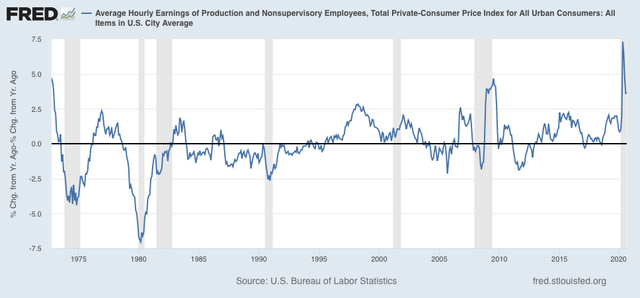
As a result, real wages for non-supervisory employees, in historical terms, have finally surpassed their previous 1973 high:


Of course, this has everything to do with the fact that lower-wage workers have taken the brunt of layoffs and closures due to the pandemic. They were being kept afloat by Congress’s emergency supplemental assistance, which has now ended.

It’s worth noting that a big YoY increase in real hourly wages has been typical coming out of recessions for the past 50 years:


Normally this has been due to a much bigger deceleration in inflation vs. wages. Generally lower paying occupations have been hit harder in past recessions as well, compared with professional and business occupations.

In sum, so far inflation is not a concern, despite the elevated readings of the past three months.

Thursday, September 10, 2020

Improvement in initial and continuing claims stalls out


 - by New Deal democrat


This morning’s jobless claims report shows that the trend of “less worse” news has at least temporarily ended, at a level of about 150,000 higher than the worst weekly levels of the Great Recession.

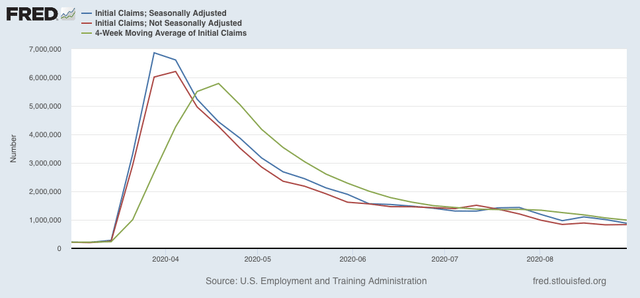
On a non-seasonally adjusted basis, new jobless claims rose for the second week in a row, by 20,140 to 857,148. After seasonal adjustment (which is far less important than usual at this time), claims were unchanged at 884,000, tied for their “best” reading since the pandemic began. The 4 week moving average declined by 21,750 to a new pandemic low of 970,750:


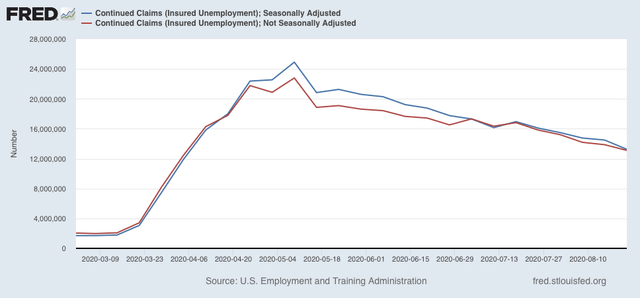
Continuing claims, on both an un-adjusted and seasonally adjusted basis rose from their pandemic lows of last week, by 54,472 to 13,197,059, and by 93,000 to 13,385,000 respectively:


This is a little over half of their worst levels at the beginning of May.

The important takeaway is that there has been little downward movement in new jobless claims over the past five weeks. The jobs market is at best improving slowly at very depressed levels. 

Wednesday, September 9, 2020

Sorry, partisans in denial: swing State polls have tightened


 - by New Deal democrat

It’s a slow economic news week, so let me follow up with some further information about movement in the polls. My usual caution: polls are *NOT* forecasts, just nowcasts estimating what would happen if the election were today.

In the past few days, there is further evidence that Trump’s “law and order” message has resonated with at least a small subset of presumably white, probably older, voters. Below are some graphs from Nate Silver’s site of a few swing and swing-ish States. Note his graphs take into account national, as well as State-specific polls, but the net result is typically within 1% of what my average of State-only polling shows.

There has been considerable narrowing of the race in Florida:  


And also, to a bit lesser extent, in Pennsylvania:


Trump has opened up a small lead in Ohio:


There has also been some subdued movement in Georgia and in Iowa:


Michigan has narrowed slightly, although Biden’s lead remains pretty wide there:


On the other hand, there’s been no perceptible change in North Carolina:


And interestingly, in the two States that have been the epicenter of “Black Lives Matter” incidents, Minnesota and Wisconsin, Biden’s lead may actually have expanded slightly:


It is *way* overstating the case to say that “Biden’s in trouble.” He still has leads in all of the important swing States. And Trump is completely incapable of staying “on message.” He will inevitably rise to any bait that is immediately in front of him, and generate new controversies (like disparaging the military).

But, with “law and order,” telegraphing to conservative, older Whites that “the animals are loose,” he has found his *relatively* most resonant issue, and it shows in the polling.

Sunday, September 6, 2020

The 2020 Presidential and Senate nowcast: Trump finds his issue


 - by New Deal democrat

Here is my weekly update on the 2020 elections, based on State rather than national polling in the past 30 days, since that directly reflects what is likely to happen in the Electoral College. Remember that polls are really only nowcasts, not forecasts. They are snapshots of the present; there is no guarantee they will be identical or nearly identical in early November.

I am afraid I have some bad news for those who think Trump did not have a convention bounce. In the past week, disapproval has eroded by 1.9% and approval has increased by 1.5%. Both of these have moved over 3% from their recent nadirs. I am sorry to tell you that Trump’s attacks on violent protests have been effective, presumably by convincing some Whites who were previously on the fence that “the animals” are loose and have to be brought to heel: 


This is probably why Biden had a press conference in which he unreservedly condemned violence, and Trump has continued to attack anyway.

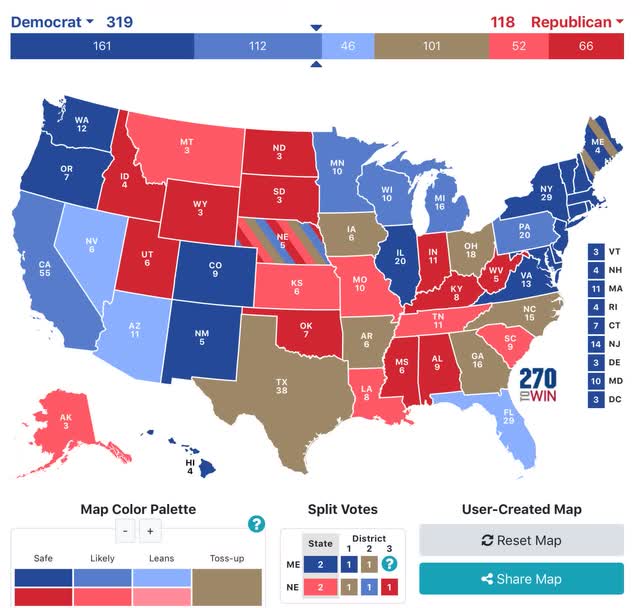
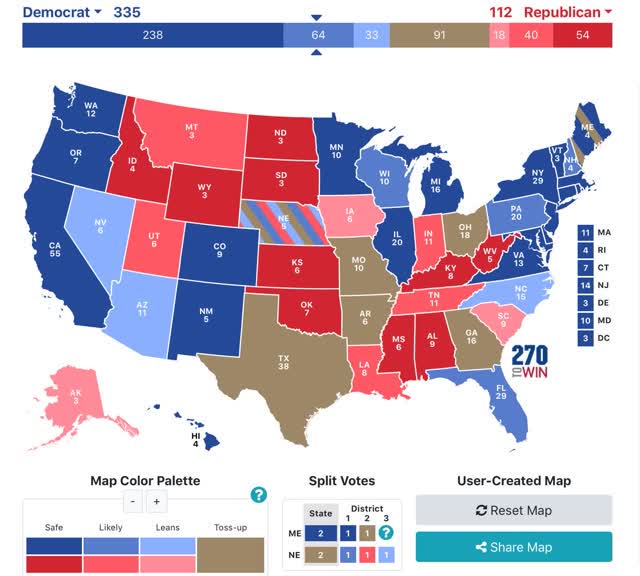
In any event, here is the updated map through September 5. To refresh, here is how  it works:

- States where the race is closer than 3% are shown as toss-ups.
- States where the range is between 3% to 5% are light colors.
- States where the range is between 5% and 10% are medium colors.
- States where the candidate is leading by 10% plus are dark colors.


There has been a spate of new polling, in which Biden’s numbers have generally weakened slightly, but without a major effect on the State totals. Nevada moved from “lean” to “likely” Biden, and Kentucky from “solid” to “likely” Trump. Conversely, both New Hampshire and Maine moved from “solid” to “likely” Biden.

Over the past 5 weeks, however, there has been an erosion in Biden’s “solid” plus “likely” Electoral College votes from 302 to 279. Even so, based on the current map Biden still just has to win the “solid” and “likely” States, and need not win any of the “lean Biden” States, in order to win the election.

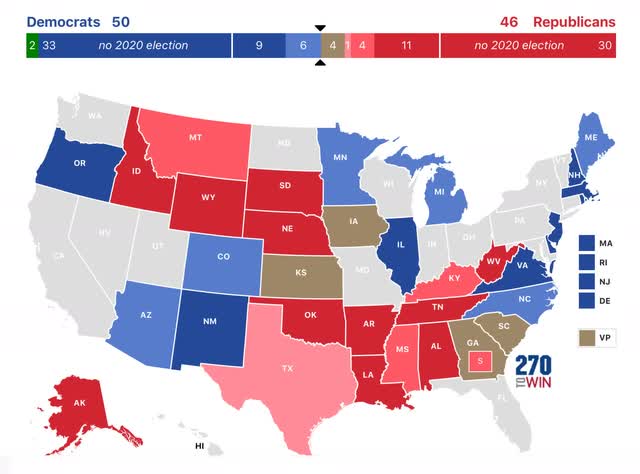
There have also been several changes in the Senate map this week, and like the Presidential map, they have been in opposite directions:


On very sparse, as in 1, poll in the past month, Alaska moved from “likely GOP” to “toss-up,” and more importantly, heavily polled Iowa moved from “toss-up” to “lean Democrat.” Contrarily, South Carolina moved from “toss-up” to “lean GOP,” and Texas moved from “lean GOP” to “likely GOP.”

At current polling, if Democrats win all those seats rated “solid,” “likely,” and “lean Democratic,” they  will have 51 Senate seats; up to 54 with the “toss-ups,” and 55 if they were to capture the “lean GOP” seat.

We are now at the Labor Day weekend. There is only one more jobs report before Election Day. Last Friday’s report continued to show progress, but at a slow rate. Trump will probably get a small boost out of the improvement in the economy, even though it is only to “less awful” levels. Meanwhile new US coronavirus cases have leveled off at about 40,000 cases per day, while deaths have slowly declined to about 800 per day. The leveling off in cases suggests that we are not going to see any substantial improvement in the pandemic over the next few weeks. The public’s accurate perception that Trump has failed to contain COVID-19 is in my opinion now baked into the cake.

Thus I expect some continued incremental improvement in Trump’s position as voters who were leaning GOP “come home.” I see very little chance of a major Biden scandal, but a substantial chance that Trump will do something which will temporarily alienate several percent of voters. 

In sum, I am comfortable saying that Biden will win a majority of the votes cast, or attempted to be cast, by the electorate. Trump’s hopes must be on interfering with the casting and counting of votes, and once again stealing an Electoral College victory by scaring Whites in the rust belt.

Saturday, September 5, 2020

Weekly Indicators for August 31 - September 4 at Seeking Alpha


 - by New Deal democrat

My Weekly Indicators post is up at Seeking Alpha.

Another long leading indicator, corporate profits, are expected to improve substantially in Q3, meaning that yet another forecasting element for the economy one year from now has stopped being a negative.

Lots of conditions are in place for growth - but only when the coronavirus is brought under control.

As usual, clicking over and reading should bring you fully up to date, and it also rewards me with a penny or two for putting in the effort each week.

Friday, September 4, 2020

August jobs report: continued slow incremental progress


 - by New Deal democrat

HEADLINES:
  • 1,371,000 million jobs gained. The gains since May total about 48% of the 22.1 million job losses in March and April. The alternate, and more volatile measure in the household report was 3,756,000 jobs gained, which factors into the unemployment and underemployment rates below.
  • U3 unemployment rate fell -1.8% from 10.2% to 8.4%, compared with the January low of 3.5%.
  • U6 underemployment rate fell -2.3% from 16.5% to 14.2%, compared with the January low of 6.9%.
  • Those on temporary layoff decreased 3.1 million to 6.2 million.
  • Permanent job losers increased by 534,000 to 3.1 million.
  • June was revised downward by -10,000. July was also revised downward by -29,000 respectively, for a net loss of -39,000 jobs compared with previous reports.
Leading employment indicators of a slowdown or recession

I am still highlighting these because of their leading nature for the economy overall.  These were positive: 
  • the average manufacturing workweek rose 0.2hours from 40.7 hours to 40.9 hours. This is one of the 10 components of the LEI and will be a positive.
  • Manufacturing jobs rose by 29,000. Manufacturing has still lost-720,000  jobs in the past 6 months, or -5.6% of the total. 53% of the total loss of 10.6% has been regained.
  • Construction jobs rose by 16,000. Even so, in the past 6 months -225,000 construction jobs have been lost, -5.6% of the total. Almost 2/3’s of the worst loss of 15.2% loss has been regained.
  • Residential construction jobs, which are even more leading, rose by 3,200. Even so, in the past 6 months there have still been -21,200 lost jobs, or about 2.5% of the total.
  • temporary jobs rose by 106,700. Since February, there have still been -471,900 jobs lost, or 16% of all temporary help jobs.
  • the number of people unemployed for 5 weeks or less fell by -921,000 to 2.281 million, compared with April’s total of 14.283 million.
  • Professional and business employment rose by 197,000, which is still -1.475 million, or about 7%. below its February peak.

Wages of non-managerial workers
  • Average Hourly Earnings for Production and Nonsupervisory Personnel: rose $0.18 from $24.63 to $24.81, which is a gain of 3.5% in the 6 months since the pandemic began. Gains had previously reflected that job losses were primarily among lower wage earners, who have been disproportionately recalled to work. That we have increased employment and increased wages as well is a very positive development.

Aggregate hours and wages:
  • the index of aggregate hours worked for non-managerial workers rose by 1.0%. In the past 6 months combined this has nevertheless fallen by about -8.5%.
  •  the index of aggregate payrolls for non-managerial workers rose by 1.7%. In the past 6 months combined this has nevertheless fallen by about -6.4%.  

Other significant data:
  • Full time jobs were responsible for 2.837,000 of the gain in the household report.
  • Part time jobs were responsible for 991,000 of the gain in the household report.
  • The number of job holders who were part time for economic reasons fell by -871,000 to 7.572 million. This is still an increase since February of 3.254 million.

A special note: Included in the total were 238,000 census hires. Without these, the net gain in jobs was 1,133,000.

SUMMARY

This was another positive report, but with some shades of difference. The establishment survey was the smallest gain in the past 4 months, even before census hires are taken in to account. By contrast, the household report, which determines the unemployment rate, was much stronger. 

All of the leading indicators in the report were positive. Further, that average hourly wages for nonsupervisory jobs rose along with the number of recalls was very good news on the wage front.

The one significant concern is that the number of permanent job losses increased to a level on par with April and June, the worst months since the pandemic hit. This is a sign that areas of unemployment are becoming permanent and will not automatically rebound with the control of the coronavirus.

All in all, the message is that of continued substantial, but incremental, gains since the April bottom in jobs. At the rate of gains in the past two months, it would take another 8 months to regain all the jobs lost in the first two months of the pandemic.

Politically, this is *relatively* helpful to the Trump campaign, but it is by no means good enough to overcome the huge losses overall this year. There will only be one more jobs report before the election, and unless there is a miracle in the next month - which is needless to say very unlikely - Trump is going to face Election Day with a poor jobs record.

Thursday, September 3, 2020

Initial and continuing claims: very slow “less worse” progress continues


 - by New Deal democrat

The continued good news in this morning’s jobless claims report is that the trend of “less worse” news is intact. But the improvement has slowed dramatically, and is still at a level of about 150,000 higher than the worst weekly levels of the Great Recession.

On a non-seasonally adjusted basis, new jobless claims rose (slightly) by 7,591 from their pandemic low last week to 833,352. After seasonal adjustment (which is far less important than usual at this time), claims declined by 130,000 to 881,000, their “best” reading since the pandemic began. The 4 week moving average also declined to a new pandemic low of 991,750, its first reading under 1 million:


Continuing claims, on both an un-adjusted and seasonally adjusted basis also continued to decline to new pandemic lows, by 765,644 to 13,104,366, and by 1,238,000 to 13,254,000 respectively:


Continuing claims have fallen by almost half from their peaks in early May.

So, “good” (or “continuing less worse”) news on the unemployment claims front, but still progressing at such a slow pace that, if the trend were to continue, it would take another 6 months or more to get back to a “normal” pace. And I doubt very much that the trend is going to continue at the rate it has in the past 4 months.

Tomorrow is the jobs report for August. Whether there has been any meaningful improvement in the unemployment rate, and whether the pace of rebounding job gains has slowed further - or worse, reversed - are going to be the big issues.

Wednesday, September 2, 2020

Coronavirus dashboard for September 2: Trumpism still kills


 - by New Deal democrat

Total US cases: 6,073,840
Cases, 7 day average: 42,304
Total US deaths: 184,604
Deaths, 7 day average: 888

Source: COVID Tracking Project

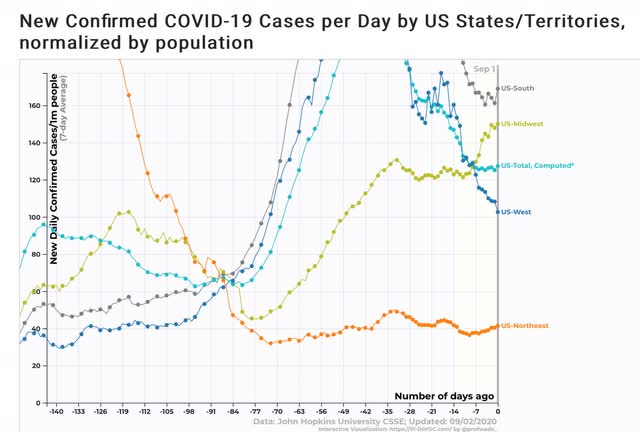
US cases by region:


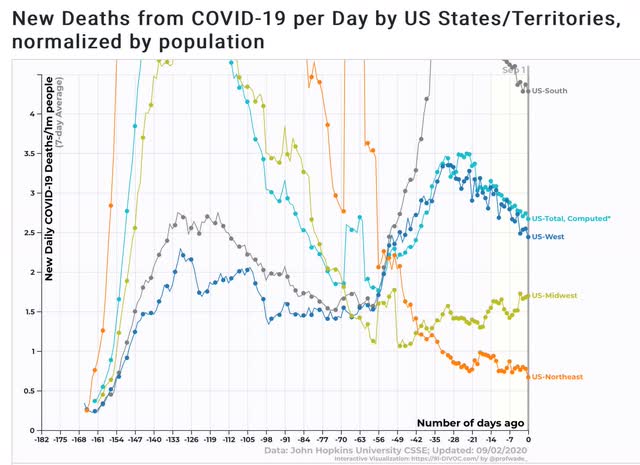
US deaths by region:


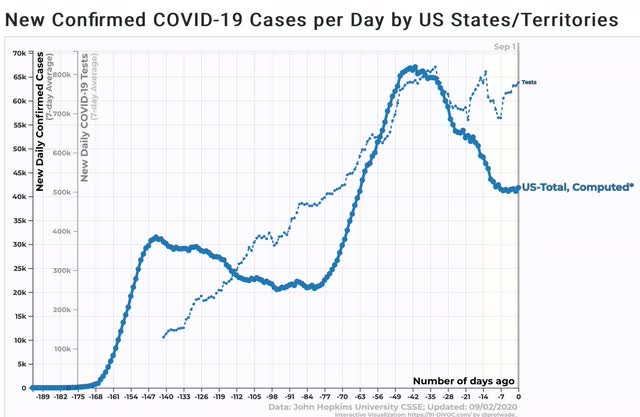
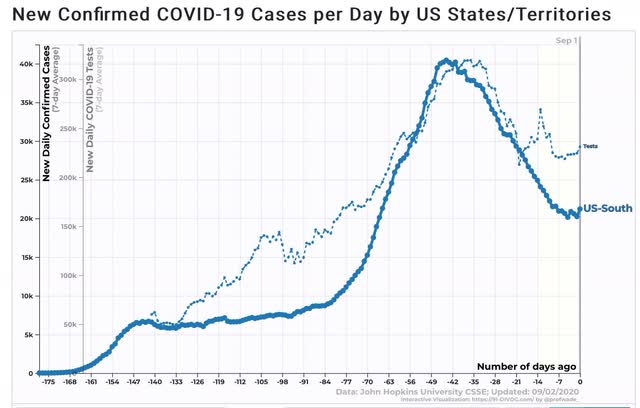
Superficially, this looks somewhat promising, as both cases and deaths have declined. But note that cases have flattened in the past week or so without further declines. This is particularly of concern, because the number of *tests* administered *has* declined somewhat over the past few weeks, as shown in the graph below of tests vs. cases, for the total US


In the Northeast, testing has actually *increased,* without finding any more new cases (not shown). That’s good! But here are the other three regions:

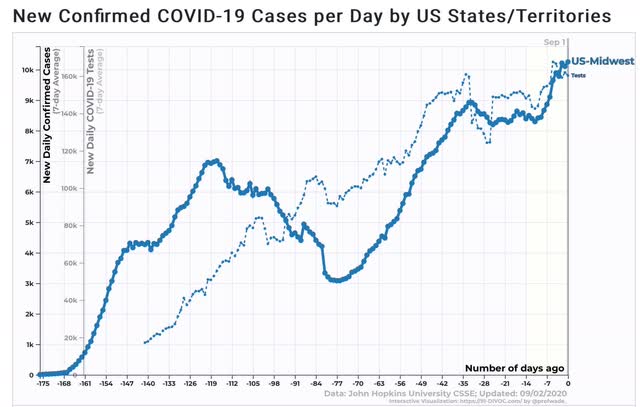
Tests vs. cases, Midwest:


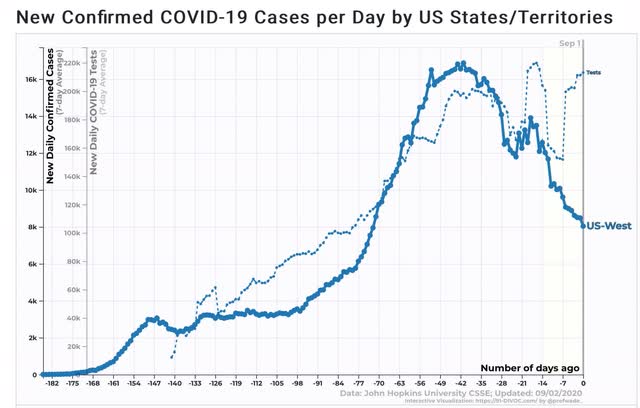
Tests vs. cases, West:


Tests vs. cases, South


In the Midwest, testing and cases have increased essentially in tandem. In the West, testing has plateaued, while new cases have declined, so the decline is probably real.

But in the South, the decline in new cases up until several weeks ago was matched by a similar decline in tests. In other words, had testing not declined, new cases probably would not have declined either. And in the South, the “true” number of cases compared with other regions is probably still substantially higher than shown.

Short version: Trumpism still kills.

Tuesday, September 1, 2020

A good start to the month: August ISM manufacturing and July residential construction


 - by New Deal democrat

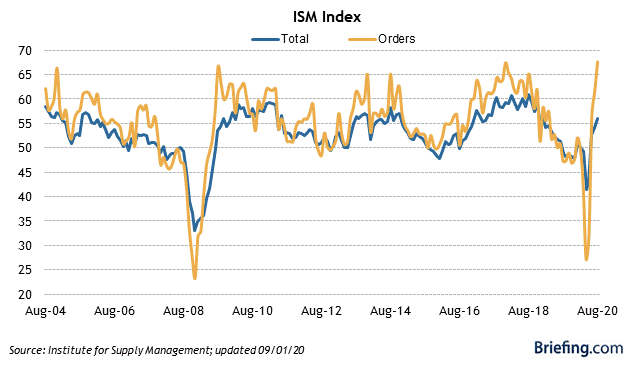
Another month of data started out this morning with the first report for August, ISM manufacturing. It showed positive acceleration from July.

The overall index came in at 56.0, up 1.8 from July. The more leading new orders subindex improved by 6.1 to 67.6, a very positive result (and reading over 50 indicates growth):


These are both the best readings in two full years.

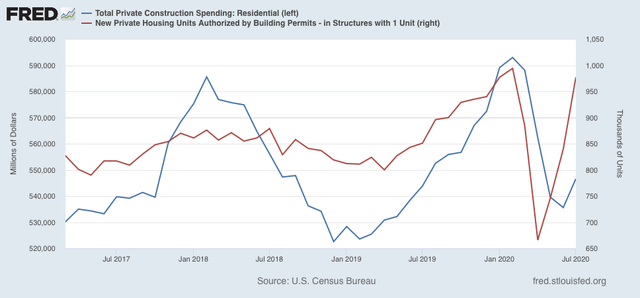
Meanwhile July residential construction spending also increased a slight +0.1% from June (blue, compared with single family permits, red, right scale):


Since residential contruction follows housing permits and starts with a short lag, it is not surprising that it has not improved more yet. But it is the least volatile of all of the leading indicators in housing, so is valuable for confirmation of the trend: in this case, that housing bottomed early in the summer and has improved since.

So, good news to start the month.

Monday, August 31, 2020

The long leading forecast for H1 2021 at Seeking Alpha


 - by New Deal democrat

It’s been a long time since I “officially” updated my primary set of long leading indicators, mainly because the until it is brought under control the coronavirus pandemic renders other indicators moot.

But that is likely to change by sometime in spring next year, so it makes sense to see what the economy might look like right after that.

This post was posted at Seeking Alpha.

The outcome of the election, and the likely time by which a decent vaccine might become available factor importantly into this outlook.

As I commented in response to some pushback there, my thought process was generally as follows:
95% of this article is exactly the same analysis of long leading indicators I have done twice a year for about the past 10 years.
The problem is that if the pandemic is still raging next summer, the normal indicators are not helpful in examining what the economy is likely to be like then. But if the pandemic is under control, then the effects of the normal indicators should be applicable.
On that score, point 2 - that a vaccine seems likely to be in place by then for at least the most vulnerable parts of the population - has nothing to do with politics.

As to point one, all poll aggregators and virtually all economic-based forecasts indicate a likely Biden win (e.g., applying the index of leading indicators to the contestants’ polls from the end of Q1). That isn’t political either; that’s simply historical metrics.
Will the national election make a difference in the future course of the pandemic? Go to 91-divoc.com, and scroll down to the third set of graphs: infections and deaths Per Capita for 122 countries. 
The US’s history is unique. It isonly in the company of third world countries. Almost every other industrialized country, both East and West, including all of the major ones, brought the pandemic under control, even though several - France and Spain - got complacent and have allowed a subsequent resurgence.
The only factor that explains the uniquely bad response of the US among industrialized countries to the pandemic is national leadership.
The only “leap of faith” required to back up point one is whether the likely election winner is also likely to be able to achieve the result of dozens of other national political leaderships in the industrialized world. That seems a reasonable calculation to me.
As a result, to include the matter of the likely course of the pandemic based on the outcome of the election in November is an important determinant of the analysis of the numbers.

Sunday, August 30, 2020

The 2020 Presidential and Senate polling nowcast: Biden’s popular majority is congealing


 - by New Deal democrat

Here is my weekly update on the 2020 elections, based on State rather than national polling in the past 30 days, since that directly reflects what is likely to happen in the Electoral College. Remember that polls are really only nowcasts, not forecasts. They are snapshots of the present; there is no guarantee they will be identical or nearly identical in early November.

As I have frequently noted, Trump’s approval has always reverted to the mean, absent a new outrage that is both unusually cruel and simultaneously unusually inept. Since there has been none in the past few weeks, Trump’s margin reverted by 2% for both approval and disapproval. Perhaps more importantly, there has been virtually no movement in the past week, despite the RNC convention:


Here is the updated map through August 22. To refresh, here is how  it works:

- States where the race is closer than 3% are shown as toss-ups.
- States where the range is between 3% to 5% are light colors.
- States where the range is between 5% and 10% are medium colors.
- States where the candidate is leading by 10% plus are dark colors.


There were a bunch of polls out during the week from pollsters rated “C-“ by Nate Silver. Despite that, only Florida changed, downgraded from “likely” to “lean” Biden.

There has been erosion over the past 4 weeks, as demonstrated by the map from the beginning of August:


Note the weakening in Minnesota, Michigan, and North Carolina in particular, and the deeper red of Montana and South Carolina.

Even so, despite heavy polling, Georgia, North Carolina, Ohio, and even Texas remain in the toss-up category.

And I am still surprised that there have been no new polls in months in Nevada in particular.

Nevertheless, based on the current map Biden still just has to win the “solid” and “likely” States, and need not win any of the “lean Biden” States, in order to win the election.

After the August jobs report this Friday, I believe the public’s perception of the economy is going to be congealed; and after Labor Day equally so as to the coronavirus pandemic. After that point, only wild cards such as a dramatic further explosion of social unrest might sway the dynamic. I expect some tightening in the polls based on an improved economy, and based on GOP voters “coming home.”

The Senate map has not changed at all during the past week, despite the spate of “C-“ polls of those races:


Based on this map, if Democrats simply win all those seats rated “solid” and “likely,” they  will have the 50 Senate seats necessary for a technical majority. If they were to win the “toss-ups” and “lean GOP” races as well, they could end up with as many as 55 Senate seats.
Finally, a couple of noteworthy nuggets.

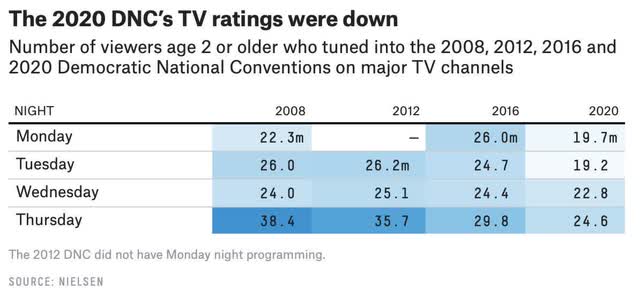
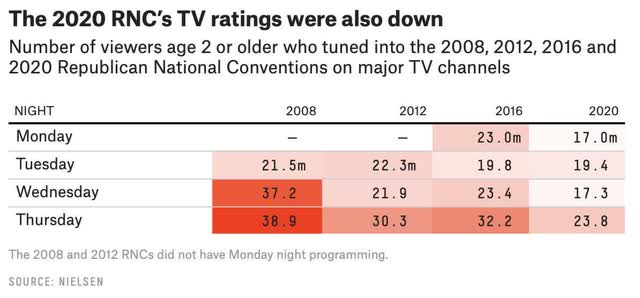
Below are the nightly ratings for both the Democratic and GOP conventions:


Note that while both viewerships were down, the Democratic convention viewership was only down -17.5% from 2016, while the GOP viewership was down -26.1%. Trump is such a known commodity that I doubt anyone other than diehard believers turned in. The differential favors Biden.

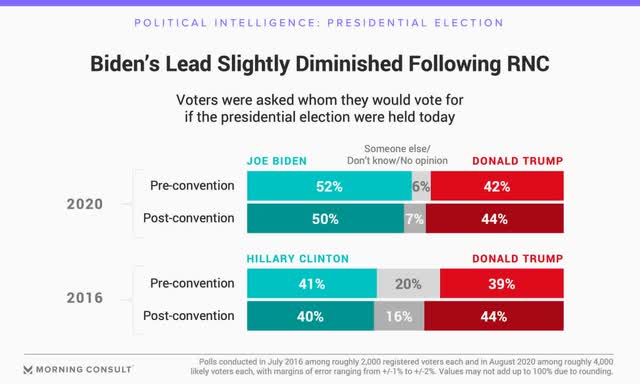
Second, here are the Morning Consult polls pre- and post-conventions for 2016 and 2020:


Note that Hillary Clinton, while leading, never crossed 50%. By contrast, Biden has not been *under* 50%. And there are less than half the percentage of undecided voters this year vs. 2016. It is simply going to be a nearly impossible task for Trump to actually win the popular vote. All of his hopes must be on the Electoral College and in voter and vote-counting suppression.