Saturday, October 5, 2019
Weekly Indicators for September 30 - October 4 at Seeking Alpha
- by New Deal democrat
My Weekly Indicators post is up at Seeking Alpha.
It’s pretty clear that manufacturing is in a recession right now. The economy as a whole isn’t because the consumer sector of the economy is still doing fairly well.
As usual, clicking over and reading should bring you up to the minute on the economy, and reward me a little bit for my efforts.


Friday, October 4, 2019
September jobs report: excellent in coincident and lagging sectors, cautionary in leading sectors
- by New Deal democrat
HEADLINES:
- +136,000 jobs added (+135,000 ex-Census)
- U3 unemployment rate declined -0.2% from 3.7% to 3.5% (NEW LOW)
- U6 underemployment rate declined -0.3% from 7.2% to 6.9% (NEW LOW)
Leading employment indicators of a slowdown or recession
I am highlighting these because many leading indicators overall strongly suggest that an employment slowdown is coming. The following more leading numbers in the report tell us about where the economy is likely to be a few months from now. These were mixed.
- the average manufacturing workweek declined -0.1 from 40.6 hours to 40.5 hours. This is one of the 10 components of the LEI and is negative.
- Manufacturing jobs declined by -2,000. YoY manufacturing is up 117,000, a deceleration from 2018’s pace.
- construction jobs rose by 7,000. YoY construction jobs are up 156,000, also a deceleration from summer 2018. Residential construction jobs, which are even more leading, rose by 500.
- temporary jobs rose by 10,200. (NOTE: July, which was originally reported at +10,500, is now shown at -2,200. August was revised down by -900 to +14,500).
- the number of people unemployed for 5 weeks or less declined by -339,000 from 2,207,000 to 1,868,000. (NEW EXPANSION LOW)
Wages and participation rates
Here are the headlines on wages and the broader measures of underemployment:
Here are the headlines on wages and the broader measures of underemployment:
- Not in Labor Force, but Want a Job Now: declined by -270,000 from 5.150 million to 4.880 million (NEW EXPANSION LOW)
- Part time for economic reasons: declined by -31,000 from 4.381 million to 4.350 million
- Employment/population ratio ages 25-54: rose +0.1% from 80.0% to 80.1%.
- Average Hourly Earnings for Production and Nonsupervisory Personnel: rose $.04 to $23.65, up +3.5% YoY. This is still a slight decline from the recent YoY% change peak. (Note: you may be reading different information about wages elsewhere. They are citing average wages for all private workers. I use wages for nonsupervisory personnel, to come closer to the situation for ordinary workers.)
Holding Trump accountable on manufacturing and mining jobs
Trump specifically campaigned on bringing back manufacturing and mining jobs. Is he keeping this promise?
Trump specifically campaigned on bringing back manufacturing and mining jobs. Is he keeping this promise?
- Manufacturing jobs rose an average of +9,750/month in the past year vs. the last seven years of Obama's presidency in which an average of +10,300 manufacturing jobs were added each month.
- Coal mining jobs rose 200, an average of 125 jobs/month in the past year vs. the last seven years of Obama's presidency in which an average of -300 jobs were lost each month
Other important coincident indicators help us paint a more complete picture of the present:
- Overtime was unchanged at 3.2 hours
- Professional and business employment (generally higher-paying jobs) rose by +34,000 and is up +437,000 YoY.
- the index of aggregate hours worked for non-managerial workers rose by 0.1%
- the index of aggregate payrolls for non-managerial workers rose by 0.3%
Other news included:
- the alternate jobs number contained in the more volatile household survey rose by 371,000 jobs. This represents an increase of 2,200,000 jobs YoY vs. 2,147,000 in the establishment survey.
- Government jobs rose by 22,000 (21,000 ex-census).
- the overall employment to population ratio for all ages 16 and up rose 0.1% to 61.0% m/m and is up 0.6% YoY.
- The labor force participation rate was unchanged at 63.2% and is up 0.5% YoY.
SUMMARY
This was a excellent report in almost all respects outside of the headline jobs number. New expansion lows were set for unemployment, underemployment, short term unemployment, and those who want a job now but have not looked. New expansion highs were set for prime age employment, participation, and aggregate hours and payrolls. Non-supervisory wages improved tepidly m/m, but growth remains at expansion highs YoY.
The only fly in the ointment, aside from the headline number, was as I expected in the leading sectors of the establishment survey. Manufacturing hours fell, as did manufacturing employment. Construction employment rose slightly, especially as to the most leading residential construction sector. And while temporary employment rose “strongly,” August was revised down slightly, and July, which was originally reported up 2,200, is now shown as a decline of -10,500.
In short, a great report in the coincident and lagging aspects, with some pronounced weakness in the leading aspects.
Thursday, October 3, 2019
September 2019 motor vehicle sales
- by New Deal democrat
Motor vehicle sales are a short leading indicator. In particular, on the consumer side, they have typically rolled over after housing but before consumer nondurables, so they are useful in gauging the health of the consumer.
More recently I’ve started tracking heavy truck sales as well. That’s because, in addition for being a proxy for the producer side of the economy, as the below graph shows, they are much less noisy that light vehicle sales, and susceptible to fewer false positives (note: measure is quarterly to cut down further on noise):
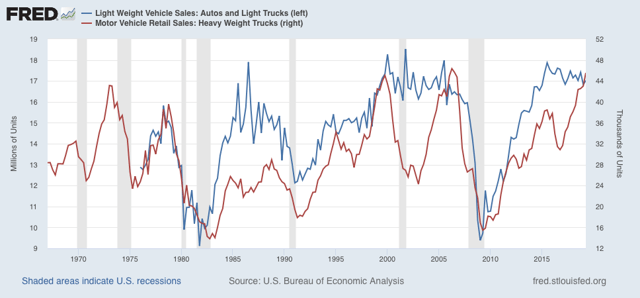
With the exception of 1969, heavy truck sales have always declined ~20% or more from peak prior to the onset of a recession. The only false positives are 1984-86, 1994-96, and 2015-16, all of which were pronounced slowdowns. As you can see, through Q2 these were growing.
Car and light truck sales have typically declined about 10% or more on a three month moving average basis before a recession hits, which would be below 16.5 million vehicles annualized, but there is lots more noise.
Zooming in on the past few years on a monthly basis, the below graphs norms September 2019’s sales levels (not yet shown on FRED) to 100:
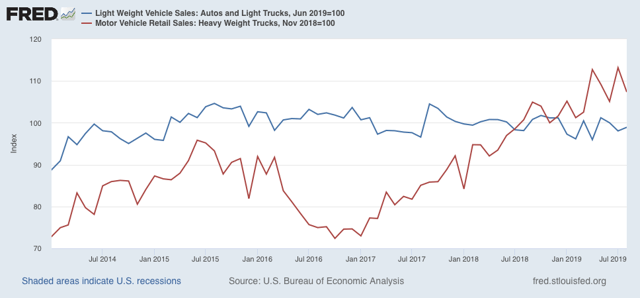
In September, 17.2 million light vehicles were sold on an annualized basis, down only about 5% from peak. But 41,800 heavy trucks were sold, a -11.6% decline from July’s record high.
Only one month, and not nearly enough to warrant any imminent recession concerns. But it’s worth noting that the one other time that truck sales declined sharply before auto sales was in the year prior to the 2001 producer-led recession. If heavy truck sales should fall by -15% or more, which would be to the 40,200 or fewer monthly, that would be a yellow flag. For now, considering the contraction shown in the ISM manufacturing index, heavy truck sales bear watching more closely.
Wednesday, October 2, 2019
Expect a weak report for the leading jobs sectors on Friday
- by New Deal democrat
September motor vehicle sales will be reported later today, after the domestic US manufacturers post their numbers. Sales of all other vehicles were down -13% YoY, but that is without seasonal adjustment including for Labor Day, so the seasonally adjusted sales might tell a completely different story.
In the meantime, with an eye towards Friday’s jobs report, let’s take a look at what is happening with temporary help services, one of the most leading components of employment.
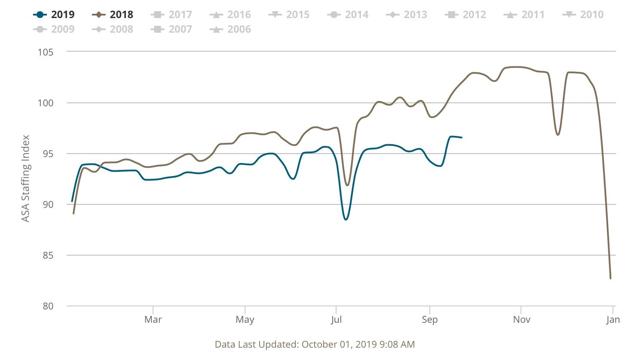
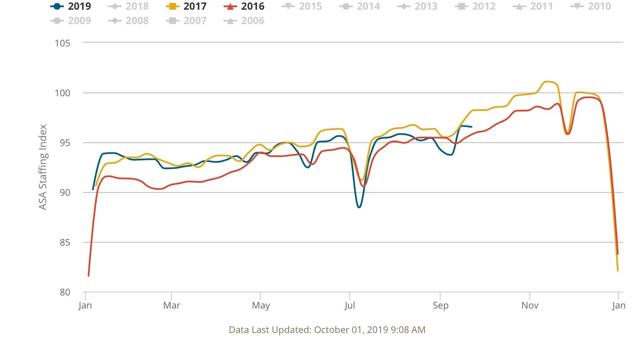
Every week I update the American Staffing Index, (from which site the first four graphs below are taken) which has a 14 year history and in that time has correlated pretty well with the final temp help employment numbers. This year it has turned increasingly negative, and this week had the most negative YoY reading so far, down -5.45% YoY for the single week, and off -4.9% YoY as a 4 week moving average:
Maybe the best way to see how bad this is, is this non-seasonally adjusted look at the index’s entire history:
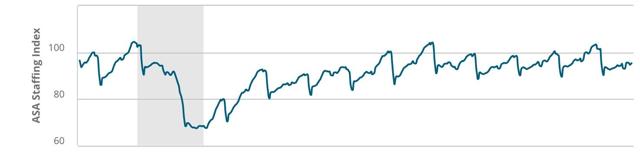
Note how the index typically rises over the course of the year until plunging right after the Christmas and New Year’s holidays — but this year has barely risen at all, the worst performance since its 2008 plunge during the Great Recession.
Let’s also compare this year with several other years during this expansion that have been relatively week. First, here’s 2016-17:
And here’s 2011-12:
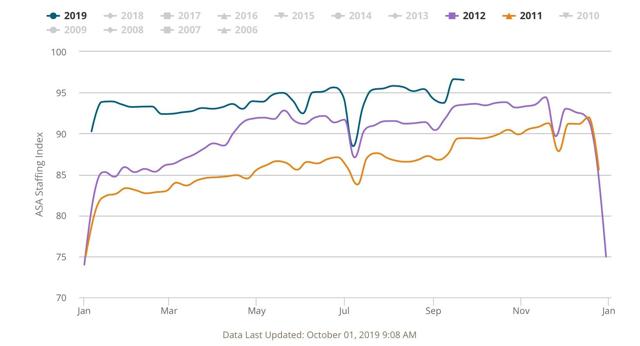
This year is a little weaker than 2011, and not quite as weak as mid-2012. It’s also pretty close to the middle portion of 2016 and the first 6 months of 2017.
Now let’s look at temporary jobs, averaged quarterly, from the jobs reports from 2011 to the present:
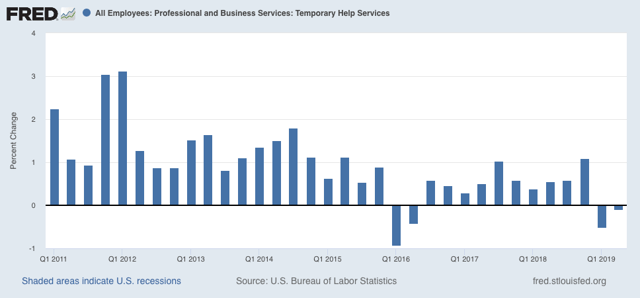
Although there will still gains, there was a big downshift in 2012, outright losses in early 2016, and continuing weakness, albeit with gains, through 2017. There have been losses in both Q1 and Q2 of this year.
As I reported a few weeks ago, the pattern has been for temp jobs to “surprisingly” increase in the initial jobs report, only to be revised significantly downward over the next two months. Last month August’s gain was initially reported at +15,400.
If Friday’s report runs true to form, there will be “surprising” gains in temp jobs, but a big downward revision to August’s number. I fully expect that the final, combined number for August and September will be negative.
The other two leading jobs sectors are residential construction and manufacturing. Residential construction has picked up, so that number is likely to be positive, but the ISM manufacturing report’s employment subindex showed contraction for the second month in a row.
The bottom line is, I expect continued weakness in the leading sectors of the jobs report on Friday.
Tuesday, October 1, 2019
Once again, two sharply contrasting reports to start the month
- by New Deal democrat
One month ago, I wrote that the first reports in September, construction spending and the ISM manufacturing index, showed two contrasting views of the economy. That was again the case today.
As in last month, residential construction spending increased for the month. Below I show it in comparison with single family permits:
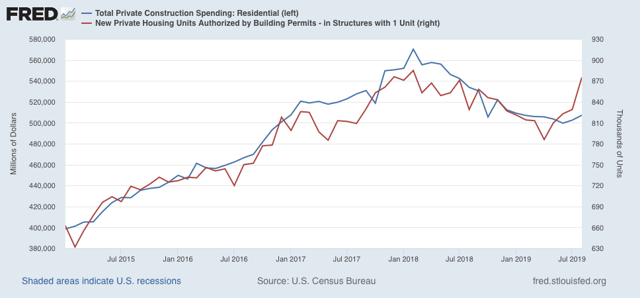
As in last month, residential construction spending increased for the month. Below I show it in comparison with single family permits:
Typically construction follows permits. In the past few years, it has been almost coincident with permits. In any event, this is more confirming evidence that in the important and leading housing sector, the decline that started in early 2018 has ended. This is positive news for the economy as a whole in 2020.
But once again the ISM manufacturing index was bad news, falling further below 50 from 49.1 in August to 47.8 in September. Just as badly, the leading new orders component, which one month ago had the worst reading since the Great Recession, at 47.2, barely improved this month to 47.3:
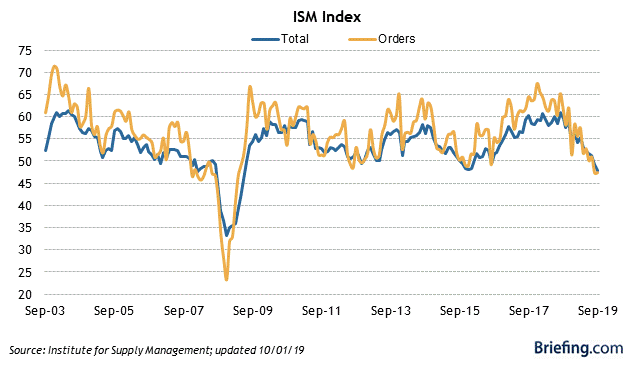
In the past it has typically taken at least two readings below 48 for the ISM manufacturing index to indicate recession. On the other hand, the new orders index is already at a level which has been consistent over the past 70 years with a recession in the very near future - although it is also consistent, as for example in 1966, with a slowdown only:
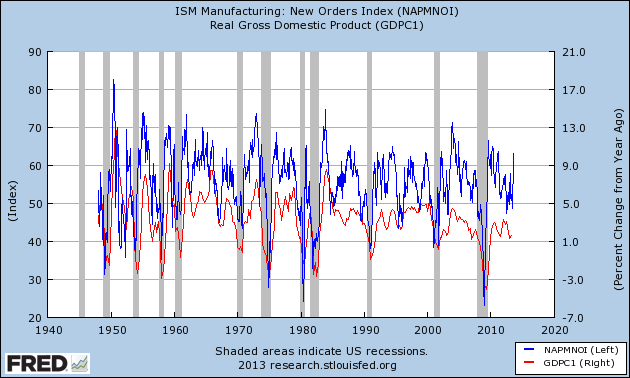
I should caution that the manufacturing sector in the economy is a smaller segment now than at any point since these series were started almost 75 years ago, so that a downturn there — and there certainly is a downturn there now — will have less repercussions than in the past. Which is a more long-winded way of saying that I think the economy as a whole is more likely to see a slowdown than an outright contraction.
Exactly as in one month ago, the reports, combined, suggest that in Friday’s jobs report there should be a little improvement in residential construction jobs, but suggest a decline in manufacturing jobs (last month there was a very slight increase) -- something that has been loudly telegraphed by the decline in the manufacturing work week in the past year.
Monday, September 30, 2019
Weekly Indicators for September 23 - 27 at Seeking Alpha
- by New Deal democrat
My Weekly Indicators post is up at Seeking Alpha.
If you’re wondering why it’s so late, it’s because SA pretty much shut down between Friday afternoon and this morning.
Anyway, recession risks are rapidly receding, at least through the 4th Quarter. As usual, clicking over and reading puts a little jingle in my pocket, as well as brining you up to the moment on the economy.
Friday, September 27, 2019
Personal spending shows consumers OK; durable goods shows producers still struggling
- by New Deal democrat
This morning’s reports on personal income and spending continue to show a consumer that is doing alright. Meanwhile durable goods orders continue to show a production sector that is struggling.
First, real personal income (red in the graph below) rose +0.4% in August, while real personal spending rose +0.1%. Since July spending (blue) was revised down -0.1%, the result was a wash:
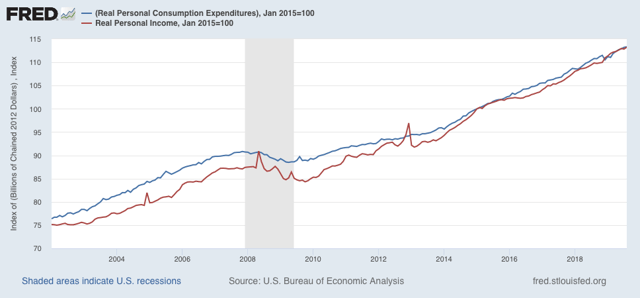
The rising trend remains intact.
In general, spending has slightly lagged income in the past few years. Thus the personal saving rate has increased:
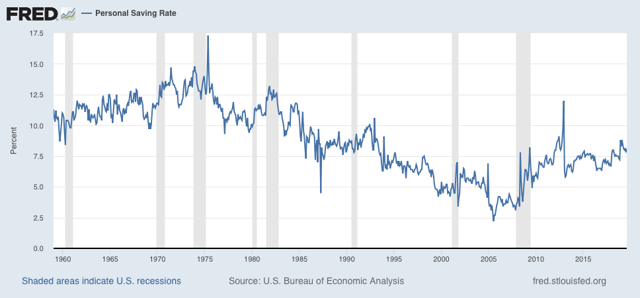
Overall the savings rate has increased since before the Great Recession, meaning that households are being more cautious with spending. This is a real change in the trend of declining savings that started in about 1980.
Meanwhile, durable goods orders for August (blue in the graph below) were up a slight +0.2%, while “core” durable goods orders (minus defense and Boeing)(red) declined -0.2%:
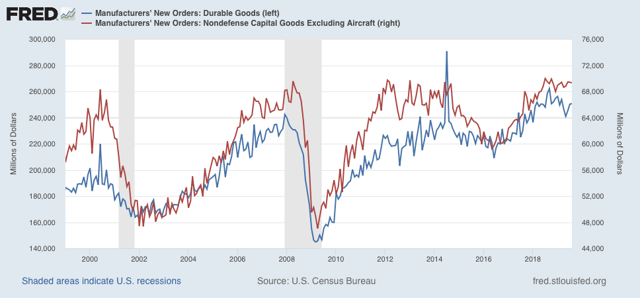
Because there are unique issues with the Boeing 737 Max, I think “core” orders are less helpful than usual. The bottom line is that durable goods orders remain in decline compared with the end of last year, similar to but not as bad as prior to the producer-led 2001 recession.
In short, the consumer continues to do OK. The weakness has been on the producer side, although not enough at this point to signal a recession.
Thursday, September 26, 2019
Initial jobless claims continue near expansion lows
- by New Deal democrat
I’ve been monitoring initial jobless claims closely for the past several months, to see if there are any signs of stress. This is because the long leading indicators were negative one year ago, and many - but not a majority - of the short leading indicators have recently turned negative as well. So I have been on “recession watch.” But no recession is going to begin unless and until layoffs increase.
To reiterate, my two thresholds are:
1. If the four week average on claims is more than 10% above its expansion low.
2. If the YoY% change in the monthly average turns higher.
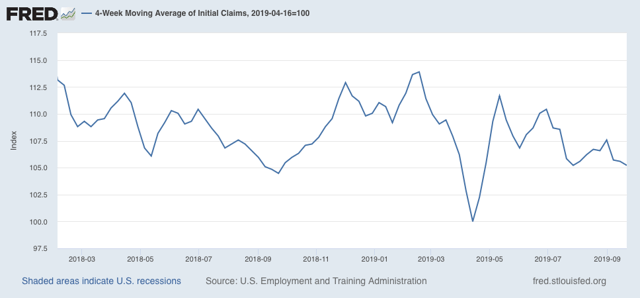
As of this week, initial claims continue to be very close to their expansion lows. The 4 week moving average of claims Is 212,000, only 11,000, or 5.2%, above the lowest reading of this expansion:
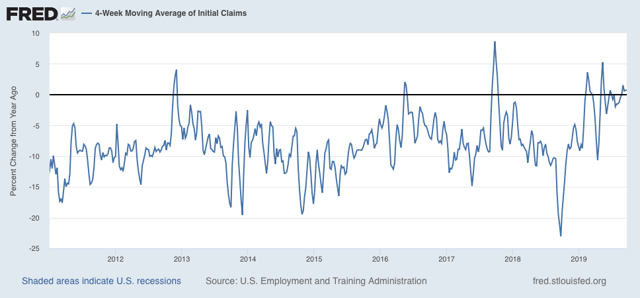
On a YoY% change basis, the 4 week average is only 0.7% higher than one year ago (which itself was one of the lowest readings of the entire expansion):
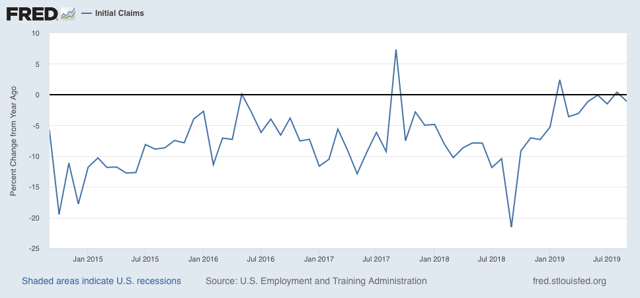
But September claims so far are running -2,333, or -1.1% less than the full month of September 2018:
The less volatile 4 week average of continuing claims is also running -1.5% below where it was a year ago:
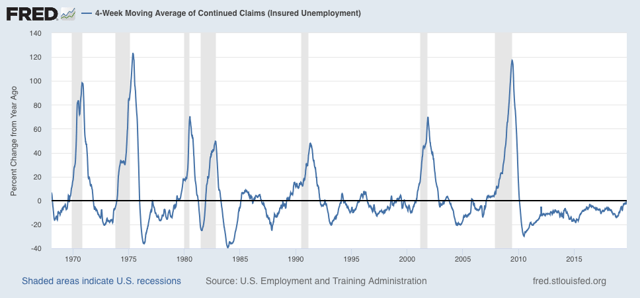
There is simply no sign whatsoever of any stress in the jobs market that we could expect to see in the immediate months preceding a recession. The recession risk for Q4 of this year is rapidly receding.
Wednesday, September 25, 2019
August new home sales continue rebounding trend
- by New Deal democrat
Let me start out my look at this morning’s August new home sales report with my typical housing mantra:
- Interest rates lead sales
- Sales lead prices
- Prices lead inventory
We saw all of that in this morning’s report.
First, the trend of rising single family sales continues, and the three month average of this very volatile series (blue), shown in comparison with single family housing permits was the highest since late 2007:
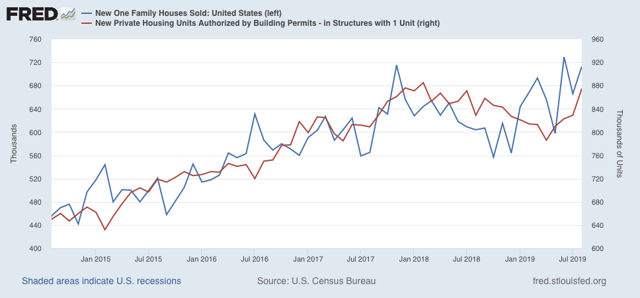
Note, by the way, that new single family home sales have a tendency to lead every other metric, including permits - but they are much more volatile and heavily revised.
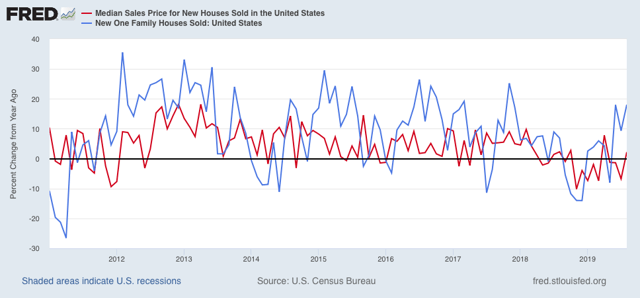
Next, the median new home price (red) turned positive YoY, for only the second time since the slump that began last year, vs. the YoY change in sales (blue) which has been positive YoY for most of this year:
Finally, here is the long term view of new home sales vs. new homes for sale, I.e., inventory (gold):
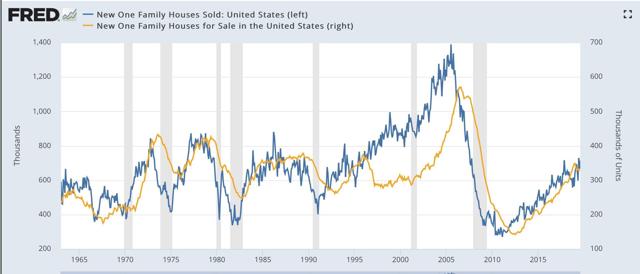
It’s easy to see that inventory only turns after sales do.
Now, here is the close up look of the past 5 years:
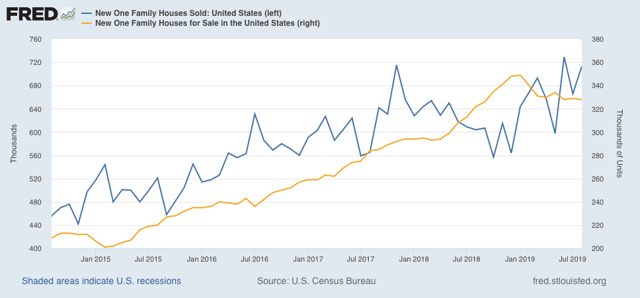
Inventory turned down earlier this year, and at the moment is stable at that lower level. Note that I do not make use of “month’s supply” of inventory in my analysis, because it is clear that it turns up or down only as a result of sales turning up or down.
In sum, August new home sales confirms that lower mortgage rates have caused sales to increase, prices appear to be beginning to follow, and inventory remains slightly reduced.
As per my “housing choke collar” thesis, any quick continued increase in prices is likely to feed into a slowdown in sales.
Tuesday, September 24, 2019
The incipient housing choke collar: July prices update
- by New Deal democrat
Three months ago I first wrote about the concept of a “housing choke collar” constraining economic growth, to wit:
The FHFA and Case-Shiller price indexes have only decelerated to a point where they roughly match median household income growth. This makes me wonder if prices for new homes will shoot back up again quickly as demand returns. If so, we could wind up in a “choke collar” situation (similar to what we had with gas prices 5 to 10 years ago), where rapid price increases choke off demand, which causes prices to back off, which reignites demand, and so on repeatedly.
This is important, because if the producer side of the economy falters, a choking off of higher new demand for housing would enhance the chances of a recession.
Three months later, and it is clear that housing sales bottomed this spring, as both housing permits and starts made new expansion highs in August. Since sales lead prices, I wrote last week that I expected price growth to bottom shortly. With this morning’s releases of the FHFA and Case-Shiller House Price Indexes through August and July, respectively, it appears that the bottoming process is happening.
The FHFA House Price Index (gold) rose +0.4%, and the Case-Shiller national house price index (red) rose +0.1% (seasonally adjusted), in July. The YoY% change in each was +5.0% and +4.2%, respectively, essentially unchanged from June, as shown in the below graph along with YoY single family housing permits (green):
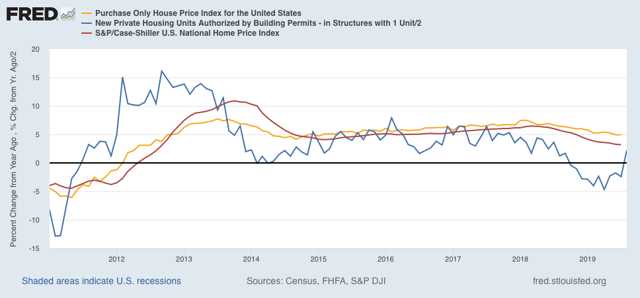
As is easily seen, housing sales growth has already started to increase. Price deceleration is probably bottoming out.
But with average hourly earnings growth running at roughly +3.4% YoY for the last 12 months, buyers are not gaining any ground compared with house prices. The only relief is due to the - very significant - decline in mortgage rates.
The below graph shows average hourly earnings (blue), compared with median household income (green), together with the FHFA Index (gold) and Case-Shiller national index (red). Since we only have household income through 2018, I have normed all four indexes to January 2004, when hourly earnings and house prices were at the same relative levels as they are now:
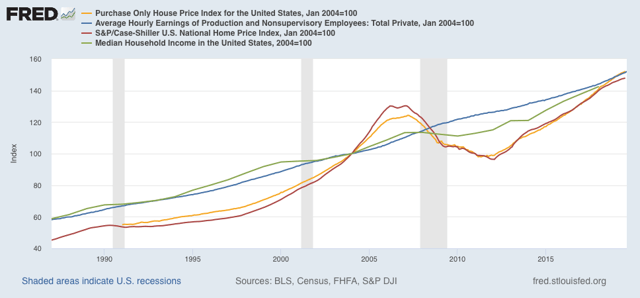
At the bubble peak, house prices were about 15% higher relative to earnings and income as they are now. But that is the *only* time in the past 30 years that house prices have been, relatively, higher.
In short, we are probably close to the peak that house-purchasing households can bear relative to their incomes. Unless mortgage rates decline further - and I am not anticipating any big further declines - housing sales growth, and its positive leading effect on the economy as a whole, is likely to be muted.
Monday, September 23, 2019
Tame inflation —-> “soft landing”?
- by New Deal democrat
I have a new post up at Seeking Alpha.
So long as inflation remains tame, the Fed has scope to bring about a “soft landing” to the slowdown, without there necessarily being a recession (so long as the Toddler in the White House doesn’t tip over the whole apple cart).
As usual, clicking over and reading puts a penny or two in my pocket.
Sunday, September 22, 2019
What Kurt Eichenwald says - Saving the Republic
- by New Deal democrat
When I’m not reading and writing about the economy, I do occasionally comment elsewhere on political topics.
So it was on Thursday when, in response to this post asserting that Democrats were powerless to do anything - (including enforcing THEIR OWN GODDAM SUBPOENAS!) - and that it was “green lantern-ism” to believe otherwise, I decided I had had enough (see comment #25), for which I was called a “kook” and a disloyal Democrat. It would “hand the President a public relations victory,” it would have “undesirable optics,” and wouldn’t show “comity.”
Worse, most of these people - presumably people paying attention to the news - didn’t know that each House of Congress, like courtroom judges, have the the power of “inherent contempt,” meaning that they don’t have to ask a prosecutor to bring a case for contempt, they can imprison a non-compliant witness, obtain a conviction from the full House, and continue that imprisonment until the witness agrees to obey their subpoena.
Well, if I am a “kook” for wanting Congress to enforce its powers, so is Kurt Eichenwald of the New York Times, who has been absoluletely ON FIRE this week. Unfortunately, since twitter unrolls don’t play nice with blogger, I can’t reproduce it here, but go read the whole threads, here, here, and here.
And, while you are at it, read this 2015 article by Matt Yglesias about how, even then, “the United States was now exhibiting 11 of the 13 telltale signs of a fascist dictatorship,” and its scheme of Constitutional democracy is likely to fall in the near future.
It is simply ghastly that people like Nancy Pelosi and Joe Biden think all we need to do is elect Democrats in 2020 and all will be well. HELL, no!
Donald Trump has once and for all exposed the fact that the US has a Presidential autocracy, so long as the President has 1/3 of the Senate +1 unwilling to stop them (because you need 2/3’s of the Senate to Convict in Impeachment or to overturn an Emergency declaration).
If the Republic does not succumb to Trump, Constitutional Amendments need to be proposed most of all to rein in Presidential power, and to do so without necessity of Impeachment. That means, at very least, Courts being able to enforce Congressional prerogatives on an expedited basis, and Congress and/or the States (via governors or attorneys general) being able to compel lower Executive Branch officials to enforce laws and regulations, under pains of fines or improsisonment. And Presidents should not be able to pardon current or former Executive branch officials from their term in office.
—
P.S. I just gone done reading “How Democracies Die,” by Steven Levitsky and Daniel Ziblatt. I also just finished reading two books about the Roman Republic (which lasted 450 years, and was stable for the first 375), and how it ultimately fell into tyranny. It turns out that many of the themes discussed by Levitsky and Ziblatt were front and center in that ancient Republic as well, which hopeufully will shortly be an opus on a Sunday here.
Saturday, September 21, 2019
Weekly Indicators for September 16 - 20 at Seeking Alpha
- by New Deal democrat
My Weekly Indicators post is up at Seeking Alpha.
For all of the discussion about various iterations of the treasury bond yield curve, it is little noted that right now it is sending a different message than virtually every other long leading indicator for the economy.
As usual, clicking over and reading should bring you up to the moment on the economy, and bring me a penny or two for my efforts.
Friday, September 20, 2019
A closer look at the housing rebound
-by New Deal democrat
On Wednesday we got some excellent new residential construction numbers. I went into a lot more detail, showing how - exactly as I forecast - the turn in interest rates led the turn in housing sales by about six months, over at Seeking Alpha.
As usual, clicking over and reading helps reward me with a penny or two for my efforts.
While I am at it, on the subject of housing, here is a chart I am working on (not completed yet!) for another post, showing the maximum percentage decline in total and single family housing permits from expansion peak until the onset of recession, ever since reports started in the early 1960s, plus the decline from peak between the beginning of 2018 to the present:
| Recession onset | Total housing Permits | 1 unit housing Permits | —— | — |
|---|---|---|---|---|
| 12/1969 | -22.7% | -20.7% | ——— | |
| 11/1973 | -42.0 | -40.1 | ||
| 6/1980 | -36.8 | -43.7 | ||
| 7/1981 | -37.4 | -38.4 | ||
| 7/1990 | -44.3 | -35.1 | ||
| 3/2001 | -11.5 | -12.5 | ||
| 12/2007 | -49.2 | -58.7 | ||
| 2018-19 | -12.4 | -11.9 | ||
Note that in all cases but two (1969 and 2001), the declines were in excess of 30%. The recent decline, at roughly 12%, is almost identical to the decline prior to the 2001 recession. Why the 2001 recession happened despite the relatively small decline is important (and a subject of that other post to come!).
Also while I am at it, last October I wrote that Barring the Fed Reversing Course, Housing Has Peaked For This Cycle. Obviously with Wednesday’s permits and starts data, housing has exceeded its prior peak.
So what happened? Obviously the Fed did recently - very tardily in my opinion - change course. But the primary driver was a 1.5% decrease in mortgage rates, assisted by a 10% decrease in median new home prices.
Here’s a graph of 30 year mortgage rates since January 2013:
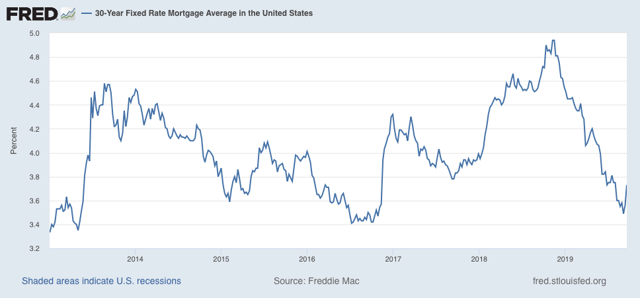
The “taper tantrum” of summer 2013 caused mortgage rates to rise 1.2%. Over the next 3 years, culminating with the Brexit panic low of summer 2016, rates went back down to 3.4%. Between the election of Trump and the Fed raising rates, by last November mortgage rates had risen to 5%. But in the last 11 months they have declined 1.5% (I don’t think it is primarily due to US recession fears, but that is another story).
Now here is the median new home sales price:
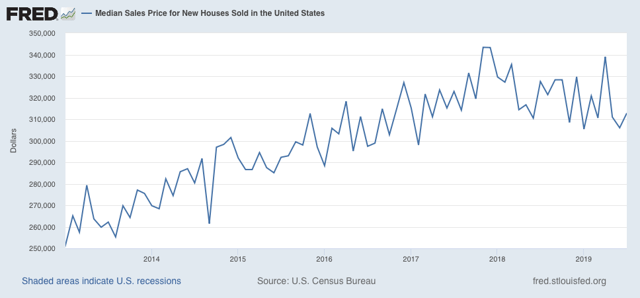
There was a 10% decline that started right at the peak of new home sales at the beginning of 2018.
Here’s what the decline in mortgage rates plus the decline in median prices did to the typical mortgage payment.
In November 2018, if you made a $30,000 down payment and took out a $300,000 30 year mortgage at 5% on the $330,000 median-priced new house, your monthly payment was $1610. Earlier this month, if you made the same down payment and took out a $270,000 mortgage at 3.5% on the $300,000 median-priced new house, your monthly payment had declined to $1212.
That’s almost a $400 difference per month. That is going to spark a lot of new demand — and it did!
Thursday, September 19, 2019
Initial claims increasingly foreclose 2019-early 2020 downturn
- by New Deal democrat
I’ve been monitoring initial jobless claims closely for the past several months, to see if there are any signs of stress. This is because the long leading indicators were negative one year ago, and many - but not a majority - of the short leading indicators have recently turned negative as well. So I have been on “recession watch.” But no recession is going to begin unless and until layoffs increase.
To reiterate, my two thresholds are:
1. If the four week average on claims is more than 10% above its expansion low.
2. If the YoY% change in the monthly average turns higher.
As of this week, initial claims continue to be very close to their expansion lows. The 4 week moving average of claims as of this morning is 212,500, only 11,000, or 5.3%, above the lowest reading this expansion:
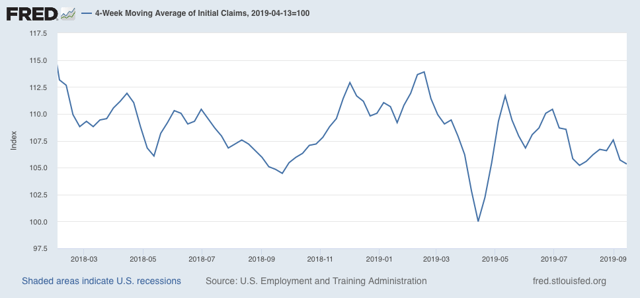
On a YoY% change basis, the 4 week average is 0.6% higher than one year ago:
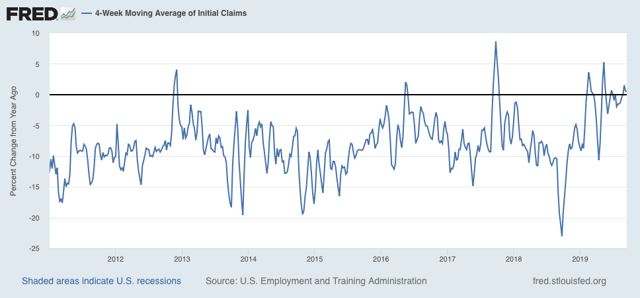
But September claims so far are running -5000 less than the full month of September 2018.
The less volatile 4 week average of continuing claims is also running -1.3% below where it was a year ago:
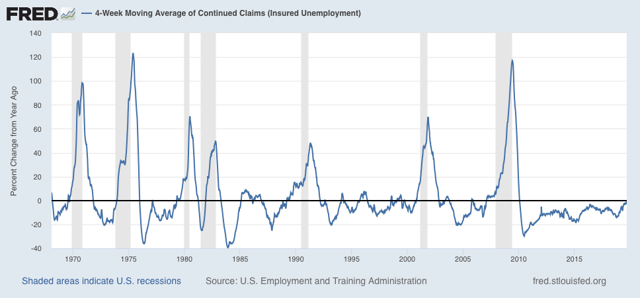
Initial claims continue to be an important positive in the short term forecast. If a recession doesn’t happen within the next 6 months, it is hard to imagine it happening at all through 2020 (with usual caveat: *IF* the economy is left to its own devices). And initial claims increasingly suggest that a downturn will not happen within that 6 month window.
Wednesday, September 18, 2019
Housing: BOOM!
- by New Deal democrat
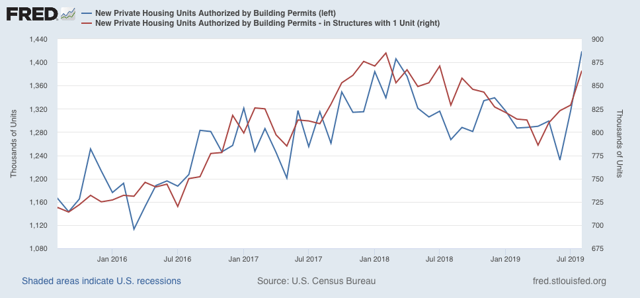
Well, this is an easy post. This morning’s report on housing permits and starts showed new expansion highs in both overall permits and starts. The less volatile single family segment also recovered, with both single family permits and starts at one year highs, although slightly below their expansion peaks.
Here are total and single family permits:
And here are total and single family starts:
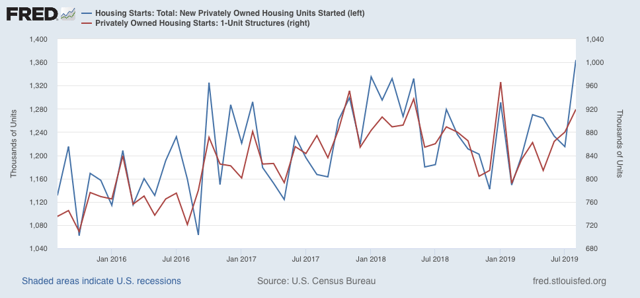
The housing downturn is over. As expected, lower interest rates for the past eight months have shown up in the housing data in spades.
This has major implications for the index of leading indicators this month, which can be expected to pop. And since housing permits are a long leading indicator, this, along with new expansion lows in corporate bond yields, new highs in per capita real retail sales, renewed increases in real money supply, and continuing looseness in credit conditions, means that the only negative long leading indicator is the partially inverted yield curve, and the only mixed or neutral indicator is corporate profits. In short, the latter part of next year is shaping up to be quite positive.
In the immediate term, I wonder if this takes the pressure off the Fed to lower interest rates. If you are a Democrat, don’t hang your hat on there being a recession on Election Day next year (although “Tariff Man” may yet come through!).
Tuesday, September 17, 2019
Industrial production rebounds; another message of slowdown, no recession
- by New Deal democrat
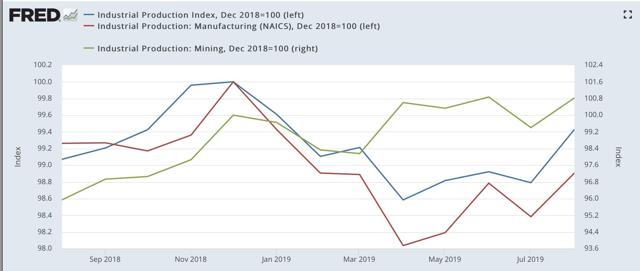
Industrial Production is the King of Coincident Indicators. When industrial production peaks and troughs coincides more often than any other indicator to NBER’s recession dating. Let’s take a look at the report for August, which was pretty darn good, which was released this morning.
Production as a whole increased 0.6%, and last month’s report was revised upward by +0.1%. The manufacturing component also increased, by 0.5%. Both, however, are still below their peaks set last December (left scale in the graphs below). The other important component, mining (which includes oil production) increased 1.4%, reversing July’s decline, missing a new high by less than 0.1% (right scale):
Stepping back for a longer term look, here is the same graph including the “shallow industrial recession” of 2015-16:
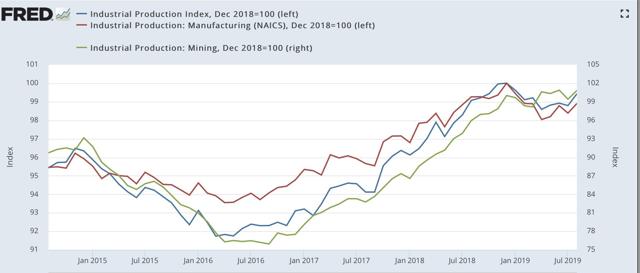
The main difference between the two periods is that the more volatile mining (oil and gas) sector declined by almost 23% in 2015-16, but has continued to increase this year. Manufacturing, which declined about 3% in 2015-16, declined 2% at its worst point this year. Overall industrial production declined by -5% in 2015-16, but only declined -1.4% at its worst point in April of this year.
Here is the update on all of the four monthly indicators that the NBER has said it pays particular attention to in deciding whether or not there is a recession:
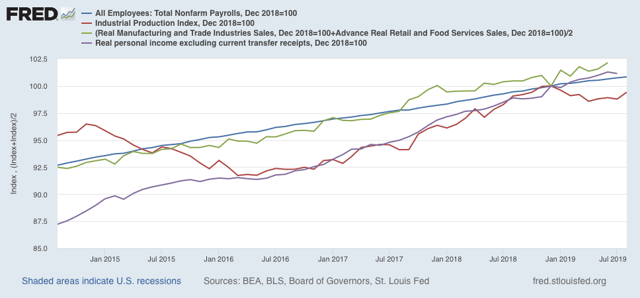
As in 2015-16, industrial production is the only one of the four which has declined this year.
In sum, production had a much more shallow decline this year than in 2015-16, and — so far — looks to be recovering from its trough in April. Once again the message appears to be: slowdown, no recession.
Monday, September 16, 2019
Weekly Indicators for September 9 - 13 at Seeking Alpha
- by New Deal democrat
I realized that I neglected to post a link to this Saturday’s Weekly Indicators post, which was up at Seeking Alpha. So here it is.
The theme over the past few months has been that, despite worsening conditions in manufacturing, and almost singular forecaster attention to the yield curve, many of the short and long term indicators have been improving, or are starting to improve.
As always, clicking over and reading helps reward me a little bit for the efforts I put in.
Last week’s initial jobless claims still show slowdown, no recession
- by New Deal democrat
A couple of weeks ago, I updated the entire list of short leading indicators. To cut to the chase, those that were negative or trending negative came out of the production sector, while those that were positive were mainly from the consumer sector.
But, regardless of which sector’s weakness might give rise to a recession, at some point it would have to be reflected in increased layoffs. As last Thursday’s report of initial jobless claims showed, that isn’t happening. Since I didn’t get around to commenting on this last week, let’s take a look now.
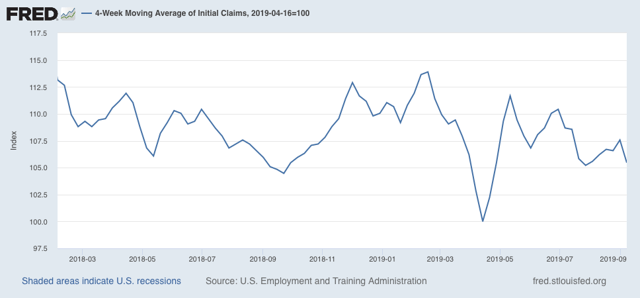
At 204,000, last week’s number of initial claims is close to the bottom of the number of claims even in the past year. The four week moving average is only 5.5% above the low point set in April:
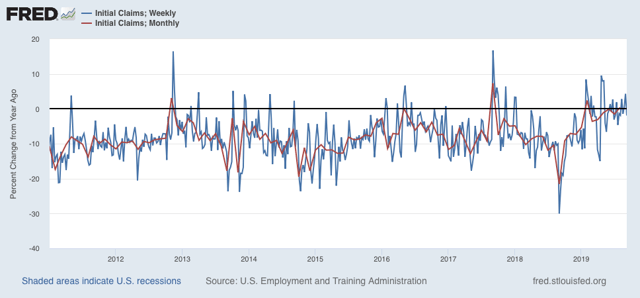
Before a recession, the YoY comparison of initial claims generally moves higher for at least two months in a row. Against very positive numbers in August last year, this year’s number was slightly negative, but as shown below (weekly YoY claims in blue, monthly average in red) we haven’t violated this rule, and September so far is positive YoY:
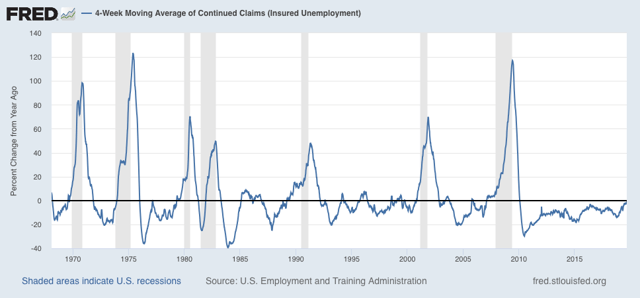
Continuing claims turn a little after initial claims, but are less volatile. The four week moving average of continuing claims is -2.1% below where it was last year:
The bottom line is that the trend in jobless claims remains very weakly positive. Like so many other data series I track, the message at this point is “slowdown, no recession.”
Friday, September 13, 2019
August retail sales confirm healthy consumer sector
- by New Deal democrat
Retail sales are one of my favorite indicators, because in real terms they can tell us so much about the present, near term forecast, and longer term forecast for the economy.
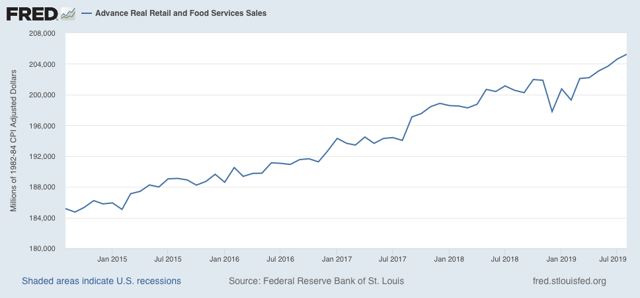
This morning retail sales for August were reported up +0.4%, and July, which was already very good at +0.7%, was revised upward by another +0.1% as well. Since consumer inflation increased by +0.4% over that two month period, real retail sales have risen +0.7% in the past two months. As a result, YoY real retail sales, which had been faltering earlier this year, are now up +2.3%.
Here is what the last five years look like:
Others may use other deflators. I use overall CPI because:
1. I’ve been doing it this way for over 10 years.
2. This is the deflator used by FRED.
3. It has a 70+ year history.
4. Over that 70+ year history, it has an excellent record as a short leading indicator for employment and recessions. That’s the kind of track record I like.
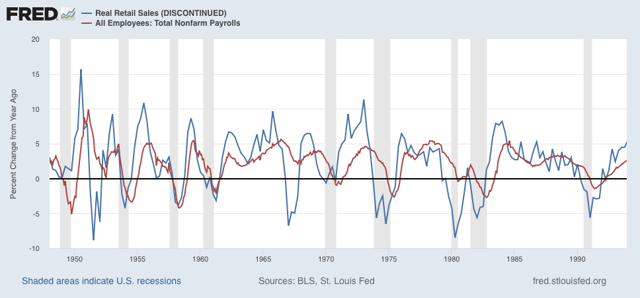
As I mentioned above, although the relationship is noisy, real retail sales measured YoY tend to lead employment (red in the graphs below) by about 4 to 8 months. here is that relationship for the past 70 years, measured quarterly to cut down on noise:
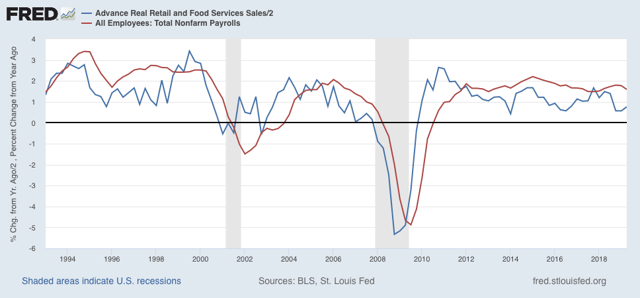
Now here is the monthly close-up of the last five years. You can see that it is much noisier, but helps us pick out the turning points:
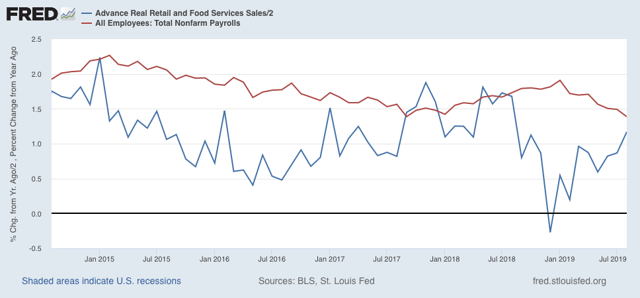
The recent peak in YoY employment gains followed the recent peak in real retail sales by roughly 6 months, and the downturn in real retail sales at the end of last year has already shown up in weakness in the employment numbers this year. Similarly I expect the improvement in retail sales to show up in an improvement in the employment numbers by about next spring.
Finally, real retail sales per capita is a long leading indicator. In particular it has turned down a full year before either of the past two recessions:
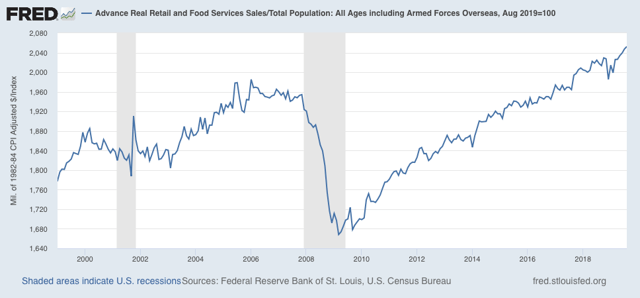
With the past several months setting new highs, this is evidence against a recession within the next year. Further, in the last 70 years, this measure has always turned negative YoY at least shortly before a recession has begun. Although there have been some false positives, there are no false negatives. In other words, this is a very reliable positive indicator.
With the past several months setting new highs, this is evidence against a recession within the next year. Further, in the last 70 years, this measure has always turned negative YoY at least shortly before a recession has begun. Although there have been some false positives, there are no false negatives. In other words, this is a very reliable positive indicator.
To sum up, real retail sales are evidence against the current slowdown turning into a full-fledged recession, and argue for an improvement in employment and the economy as a whole starting about next spring — assuming the economy is left to its own devices, and Tariff Man does not hit American companies and households with further substantial stealth tax increases (currently standing at about $460 per household annualized).
Subscribe to:
Posts (Atom)