- by New Deal democrat
Three months ago I first wrote about the concept of a “housing choke collar” constraining economic growth, to wit:
The FHFA and Case-Shiller price indexes have only decelerated to a point where they roughly match median household income growth. This makes me wonder if prices for new homes will shoot back up again quickly as demand returns. If so, we could wind up in a “choke collar” situation (similar to what we had with gas prices 5 to 10 years ago), where rapid price increases choke off demand, which causes prices to back off, which reignites demand, and so on repeatedly.
This is important, because if the producer side of the economy falters, a choking off of higher new demand for housing would enhance the chances of a recession.
Three months later, and it is clear that housing sales bottomed this spring, as both housing permits and starts made new expansion highs in August. Since sales lead prices, I wrote last week that I expected price growth to bottom shortly. With this morning’s releases of the FHFA and Case-Shiller House Price Indexes through August and July, respectively, it appears that the bottoming process is happening.
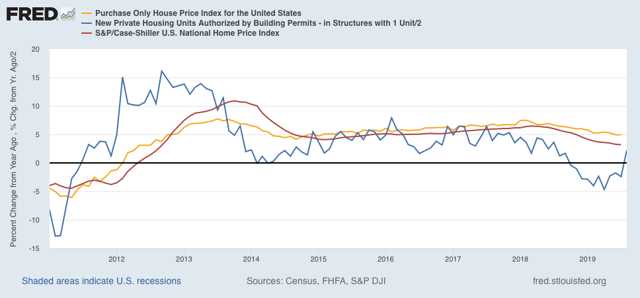
The FHFA House Price Index (gold) rose +0.4%, and the Case-Shiller national house price index (red) rose +0.1% (seasonally adjusted), in July. The YoY% change in each was +5.0% and +4.2%, respectively, essentially unchanged from June, as shown in the below graph along with YoY single family housing permits (green):

As is easily seen, housing sales growth has already started to increase. Price deceleration is probably bottoming out.
But with average hourly earnings growth running at roughly +3.4% YoY for the last 12 months, buyers are not gaining any ground compared with house prices. The only relief is due to the - very significant - decline in mortgage rates.
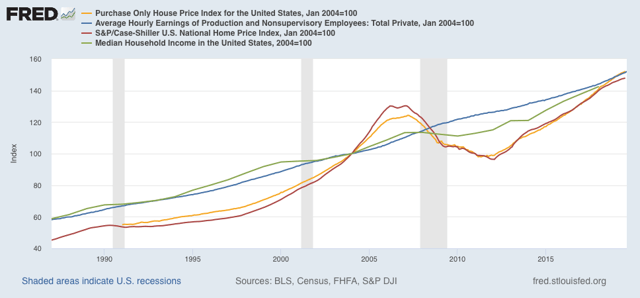
The below graph shows average hourly earnings (blue), compared with median household income (green), together with the FHFA Index (gold) and Case-Shiller national index (red). Since we only have household income through 2018, I have normed all four indexes to January 2004, when hourly earnings and house prices were at the same relative levels as they are now:

At the bubble peak, house prices were about 15% higher relative to earnings and income as they are now. But that is the *only* time in the past 30 years that house prices have been, relatively, higher.
In short, we are probably close to the peak that house-purchasing households can bear relative to their incomes. Unless mortgage rates decline further - and I am not anticipating any big further declines - housing sales growth, and its positive leading effect on the economy as a whole, is likely to be muted.