Tuesday, January 26, 2010

Obama Proposes Spending Freeze

From the NY Times:

President Obama will call for a three-year freeze in spending on many domestic programs, and for increases no greater than inflation after that, an initiative intended to signal his seriousness about cutting the budget deficit, administration officials said Monday.

.....

The freeze would cover the agencies and programs for which Congress allocates specific budgets each year, including air traffic control, farm subsidies, education, nutrition and national parks.

But it would exempt security-related budgets for the Pentagon, foreign aid, the Veterans Administration and homeland security, as well as the entitlement programs that make up the biggest and fastest-growing part of the federal budget: Medicare, Medicaid and Social Security.

The payoff in budget savings would be small relative to the deficit: The estimated $250 billion in savings over 10 years would be less than 3 percent of the roughly $9 trillion in additional deficits the government is expected to accumulate over that time.

Why are they doing this?

“A lot of our caucus won’t like it but I don’t think we have any choice,” said an adviser to Congressional Democratic leaders, who would only speak on condition of anonymity about internal party deliberations. “After Massachusetts and all the polls about independents’ abandoning us for being fiscally irresponsible, we can’t afford to be spending more than Obama.”


Here are a few points, in no particular order of important.

1.) We're in the middle of a recession -- the worst recession of the last 60 years. We have to spend money now to alleviate the effects of the recession and get us out of the recession. That's standard Keynsean economics 101. And so far it's worked -- the economy grew 2.2% in the third quarter, largely thanks to government spending.

2.) The cuts are in fact pretty small and therefore mostly symbolic.

3.) Notice there is no talk about getting out of Afghanistan. While I am loathe to inject my political thoughts into this process, suffice it to say I believe trying to win a war in a country that has been at war for a very long time is a pointless task. I view this effort in similar terms -- no win.

4.) There is the possibility that he is playing to the bond market in an attempt to keep interest rates lower.

5.) A lot of the problems I have with this is a matter of timing. Is this he right time to be talking about deficit reduction? I don't think so. Given the US has a 10% unemployment rate this is really the time to spend to get people employed. To that end, I would propose a public works project that employs all the unemployed construction workers we currently have. That would be a really good idea.

Existing Home Sales Tank

From Bloomberg:

Existing home sales in plunged a little deeper than expected in December though prices surprisingly firmed in the month. Sales fell 16.7 percent for the largest monthly decline in data going back to 1968. The annual rate of 5.45 million units compares with expectations for 5.90 million and against the 2009 total of 5.16 million. Declines swept all regions especially the Midwest and were split evenly between single-family homes, down 16.8 percent to a 4.79 million rate, and condos, down 15.4 percent to 0.66 million.

Now the goods news. Prices firmed, up a sizable 4.9 percent on the median to $178,300 and up 6.4 percent on the average to $225,400. The National Association of Realtors, which compiles the report, attributed the gain to a higher proportion of repeat buyers during the month. First-time buyers, enticed by special credits, were a key force behind the housing sector's pop higher in the second half of last year. The first round of housing credits expired in November before being extended and expanded into the spring, a factor that is likely to lead to acceleration in home buying in the coming months.

But right now the housing sector is once again very soft. A special negative in today's report is a rise in supply, to 7.2 months at the current sales rate vs. 6.5 months in November. Reaction to today's report was muted with stocks and the dollar slipping very slightly. New home sales will be posted on Wednesday and are expected to firm following an 11 percent tumble in November.


Here is the chart:


While I am pleased with the price picture, the rest of the report was terrible, plain and simple. The only consolation is it is one month of data. That's about it.

Treasury Tuesdays


A.) Prices broke the downward sloping trend line and

B.) Moved higher, with several upward gaps along the way.

This is a good example of why it's important to always know where support, resistance and trend lines are. Breaking a trendline is an important technical development that must be heeded.


A.) The 10 and the 20 day EMAs are moving higher and the 10 day EWA has crossed over the 20 day SMA. Prices are above all the EMAs.


A.) The MACD is moving higher, indicating momentum is on out side, but

B.) The A/D line has not increased, indicating we're not seeing an accumulation of shares. That means this might be a counter-trend rally.

Monday, January 25, 2010

Today's Market


Prices consolidated today in a small range. This is good news as it slowed the freefall from last week. However, we're not out of the technical woods yet. Last week's price action really did some damage to the markets as a whole.

BRIC Consumers to the Rescue?

From Bloomberg:

Developing countries led by China and India will supplant the American consumer as the source of “natural growth” for the global economy, according to Paul Sheard of Nomura Securities International Inc.

There will be “less exuberant and robust consumption than we had in the past few years” in the U.S. because the American household will continue to “tighten its belt,” New-York based Sheard, global chief economist at Nomura, said in a Bloomberg Television interview in Hong Kong today. “There are other parts of the world, though, that can take up some of that slack,” such as China and India, he said.

This is a big change, but one that was bound to come. As other parts of the world experience economic growth, they increase their spending/purchasing power. As that happens, their overall demand for "things" increases. Overall, it's a healthy trend as the world grows less reliant on the US consumer.

Market Mondays, Continued


Let's continue with a look at the QQQQs

A.) Prices found resistance in the 46.50 area. They found support in the 45.50/45.60 area. They advanced to the 46.50 level three times only to fall back (C).

D.) Prices could not make it to the 45.50 area on their fourth try, and began a series of lower highs and lower lows for the remainder of the week. Note the higher volume on the sell-offs.


Note that prices have moved through three areas of technical support over the last three days.


A.) Prices moved through the 10, 20 and 50 day EMA as well.


A.) The MACD sent a sell signal before the sell-off and

B.) We saw outflows from the market as well.

Pent-up Housing Demand?!?!

- by New Deal democrat

For information geeks like me, the St Louis Fred has premiered a brand new toy, namely, the ability to perform mathematical functions on one or more data series and generate a graph of the result. Taking it for a test spin, I decided to find out how big the housing bubble really was on a population weighted basis. I divided housing permits by population, and this is the surprising result I got:
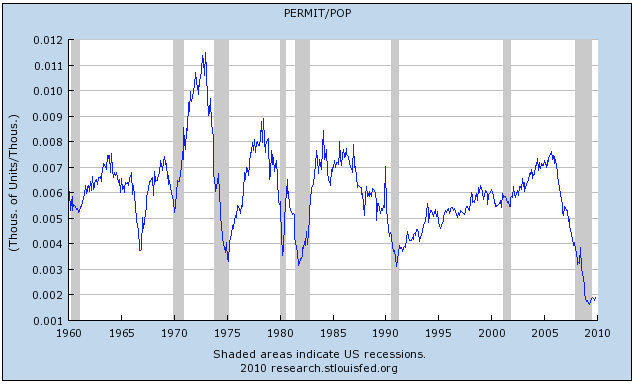

On a per capita basis, the housing boom of a few years ago doesn't look that outlandish at all! In fact, at least 3 prior booms in the last 40 years were bigger. On the negative side, the current housing bust is even more clearly the worst in the post WW2 era.

Since I had previously done the calculations, I was able to take the comparison further back in time. Last July, I posted about Housing during the Roaring Twenties and Great Depression. Here's the graph from a 1954 text that I started with:


I found the Department of Labor source data or "non farm housing starts," and generated the following chart, which also in the last column converted the housing starts by multiplying the data proportionate to the population for each year compared with our modern population of 300 million. All data is in 1000's:

YearNonfarm housing starts2009 equivalent
1920247 699
1921449 1236
1922716 1953
1923371 994
1924893 2350
19259372423
1926849 2177
1927810 2042
1928753 1867
1929509 1252
1930330 805
1931254 615
1932134322
193393 221
1934126 300
1935221522
1936319 748
1937336 781
1938406 937
19395151179
19406021368


Note that this chart is for nonfarm housing starts only. In 1930, 25% of the US population lived on farms, compared with only 2% today. So if anything, the 1920s boom was much more of a bubble than the recent one. Similarly, the population adjusted 221,000 housing starts from 1933 is considerably worse than the April 2009 bottom of 498,000.

So, contrary to most prevailing opinion, is the housing bust creating pent-up demand? Certainly there is an oversupply of houses - at current asking prices - on the market now. Nevertheless, in a long term secular sense, I believe the answer is "Yes."

While the US population is growing by about 1% a year, new home buyers are what drives that market, and that is very age sensitive. First time home buyers are generally younger persons who have formed a new household and are ready to move from an apartment or their parent's home to their own. In other words, the number of first time homebuyers over time ought to be proportionate to the number of persons who are entering the stage of their lives where they are ready to form their own household and buy their first home. That number isn't static or growing smoothly, as this graph of immigration adjusted births by year by the Harry S. Dent Foundation (whose investment advice based on it may not have been so hot) shows:


The Baby Boom peaked at 5 million births a year in the late 1950s, and the Gen X baby bust reached a nadir of less than 4 million in the early 1970s. The echo boom of Gen Y/Millenials peaked at about 5 million again in 1990. The data used in this graph is corroborated by the demographics information supplied in the 2000 Census.

In other words, the number of people at the right age to buy their first house would have contracted by 1 million a year as the Boomers gave way to Gen X, and then rise again by up to 1 million as the Millenials enter house buying ages. What we need to know is, at what age range do people typically form a new household, and at what age range do they typically buy their first house?

Although the data isn't available for use at the St. Louis Fred site, the Census Bureau does break down population by quintile, and from this we can obtain information about the average age that new households are formed, and here it is:


Not surprisingly, young people begin to move out of their parents' homes at about age 20. Those who married very young form their own household, while young singles live with roommates. By age 25, new household formation rapidly accelerates, and continues through age 35, by which time close to the maximum percentage of people are living in their own or spouse's household.

Of course, while some people may move directly from their parents' home to a house of their own, many if not most will go through a period of living in an apartment. The median age of first time homebuyers is therefore a little older than the median age of forming a new household. This information is very difficult to obtain, but a survey conducted in 2006 found that the average age of first time homebuyers in the Gen X and Boomer eras was 29 years old. (The survey found that Millenials were buying at age 26 on average, but since they include persons born as late as 1994 in that group, I think we can safely ignore that anomaly.) For our purposes, we can round to age 30 as the average age of first time homebuyers, which is also the median age of 2009 first time home buyers as found in a survey by the NAR.

Interestingly, the National Association of Home Builders reported that at the peak of the housing bubble in 2005, the Census Bureau found that the median age of home buyers was up to 33 years old, perhaps reflecting the unaffordability of housing at the market's peak.

Applying this information to housing, we would expect the Boomer generation's impact on first time home buying to begin shortly before 1976 and to have reached its peak first home buying years around the late 1980s. After that, the pool of young first time homebuyers would gradually shrink until about 2005, and then begin to rise again. Obviously I'm not suggesting a perfect fit to the data that begins this post. Mortgage interest rates obviously play are role, as do home buyers expectations about whether prices for houses will be stable, go down, or rise during the period of their ownership. For example, as the first Boomers entered the housing market, prices began to rise with demand (and 1970s inflation and interest rates), making housing much more expensive for later Boomers. Similarly, in essense the housing bubble of 2004-6 borrowed future demand for housing. The nadir we should have had then, we are having now.

So, what is the condition of the Millenial generation? According to the Bureau of Labor Statistics, job losses during the Great Recession have been particularly concentrated among the youngest cohort of the workforce. A smaller share of 16- to 24-year-olds are currently employed--46.1%--than at any time since the government began collecting such data in 1948. Thus, at the moment, the "echo boomers" may be the "Boomerang" generation, moving back in with their parents to save money in a dismal job climate:
According to a recent Pew Research Center study [conducted in October 2009], one in 10 adults between the ages of 18 and 34 said the poor economy has forced them to move back in with mom and dad.... In addition to those who have moved home, another 12 percent scurried to find a roommate to scale down living expenses.

Young adults are altering their behavior in other ways too. About 15 percent of adults younger than 35 say they have postponed getting married because of the recession, according to Pew.

Not only can they not afford a big wedding, but they don't have the money to buy a house or take care of a child, the study said. Fourteen percent of young adults say they have put off having a baby.

"They are delaying important decisions, perhaps indefinitely. We hope it's temporarily, but that's contingent upon the economy improving," said Richard Morin, a senior editor at Pew and the study's author. "These aren't slackers. These are people who are in transition, and their lives are on hold."

As this graph of the most recent Case Schiller house price index by Calculated Risk shows, housing prices still have a way to go to fall to their longer term mean:

so the Boomerang generation is going to have a difficult time buying their first home for a few years to come.

I'm not saying that housing is set to take off this month or this year. Nevertheless, in a secular sense, a long term bottom in the housing market is taking place now. Thirty years ago it was 1980, and the Baby bust of Gen X was giving way to the echo boom of Gen Y/ Millenials. This means that every single day, there is more and more demographic pressure building up on the demand side of the housing market, and that pressure is going to continue to increase for the next 10+ years.

Market Mondays

Last week we say a big sell-off. First - and as always -- Corey at Afraid to Trade has some great analysis. In addition, consider the following charts:


A.) Prices moved through three key support areas in two days. They did so on high and increasing volume.

B.) There are still two short-term support areas below prices.

Note the strength of the candles -- the bodies are long (as in a few points). This indicates prices dropped throughout the day.


A.) Prices have moved through the EMAs quickly -- prices are now below the 10, 20 and 50 day EMA.


A.) Momentum has been decreasing for months.

I'll post on the other averages throughout the day.

Friday, January 22, 2010

Weekly Indicators (with special graph of Daily Treasury Receipts)

- by New Deal democrat

This week we got good reports and Housing Permits and Starts. Both are up on a YoY basis for the first time since the housing bust began, starts just barely, permits substantially. Permits also rebounded from their recent surprise decline, Starts were down from last month and basically meandering sideways for the last 6 months.

Edmunds "cautioned that the seasonally adjusted annual rate for U.S. auto sales could be 10.5 million in January." That would be the lowest rate in 3 months. Auto sales are seasonal, so just as good sales in December weren't good enough for a positive real retail sales report, this month might not be "bad" enough for a poor real retail sales report.

Leading Economic Indicators for December were up 1.1%. On a YoY basis, they are now up over 7%. This is the best YoY performance in nearly 25 years except for a brief period in 2003, and portends strong growth for this quarter and at least the beginning of next quarter.

Turning to the high frequency weekly indicators, the ICSC reported same store sales for the week of January 16 up 2.0% from the week before and up 2.6% from the year before. This isn't as good as it sounds, since inflation is running close to 3% at the moment.

Similarly, Shoppertrak reported sales down (-7.6%) from the prior week, and up a slight +0.8% on a YoY basis.

Railfax showed cyclical and intermodal traffic up vs. a year ago (which was the exact bottom). Comparisons start getting hard this week. If numbers don't improve, both may be negative YoY again, but seasonality makes that unlikely.

The BLS reported initial jobless claims of 482,000 last week, and the 4 week average went up to 448,250. There was an indication that this reflected an administrative backlog, i.e., the last two week's numbers should have been worse, and this week's better. Recall that a week ago I said that the seasonal adjustment was probably too optimistic, and to expect the weekly claims number to rise to about 480,000, which would in no way disturb the year-long declining trend. Next week the seasonal changes pretty much wash out. So long as the jobless number next week begins with a 4 and not a 5, the trend is still in place.

Oil has declined to $75 a barrel, which is good, and gasoline at $2.74 also declined slightly from last week, but is still above its range for the last few months. Usage is in seasonal decline, but more ominously is on the verge of going negative YoY.

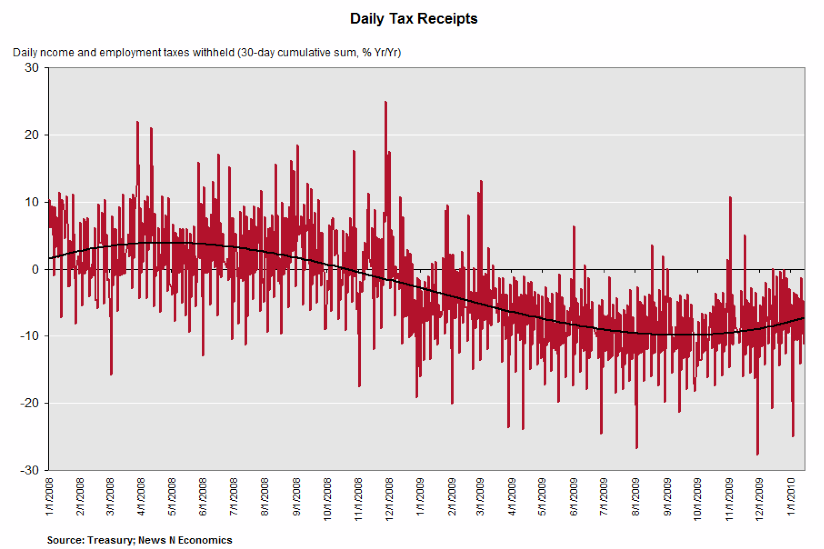
Now our special bonus, h/t Angry Bear, the following graph of Daily Treasury Withholding Receipts (red lines), and YoY 5 day smoothed average (black dotted line):


The YoY went negative in October 2008 (almost a year after the recession started) and appears to have bottomed in October 2009. If it takes until October 2010 to turn positive, that suggests the actual seasonally adjusted bottom might not be until this spring, which obviously puts the states and federal budgets under severe distress.

But the YoY average might turn up more quickly. As of January 20, the Daily Treasury Statement showed $96.6B in withholding taxes pain this months, compared with $101.0B on the same date last year, a decline of (-4.4%).

In the next 60 days or so, given the tougher YoY comparisons, we should have a good idea how sustainable the recovery is going to be. This week, the comparisons in retail sales, gasoline, and rail traffic looked worrisome.

Regulators Doing Their Job

From Bloomberg:

U.S. banking supervisors are using existing authority to raise standards for capital, liquidity and risk management without waiting for the Obama administration and Congress to hammer out a new regulatory structure.

Agencies led by the Federal Reserve and the Office of the Comptroller of the Currency this year are set to propose rule revisions that would increase the amount of capital large banks must set aside against the risk of trading losses, according to government officials. The revisions would follow recommendations of the Basel Committee, the global coordinator for banking regulations based in Switzerland.

U.S. regulators are also proposing stronger guidelines on liquidity risk and this month told banks to improve strategies to guard against the possibility of an abrupt increase in interest rates. The renewed scrutiny comes as firms that received taxpayer support, including Goldman Sachs Group Inc. and JPMorgan Chase & Co., report earnings swelled by gains from securities trading.

“You have got more intensive, more intrusive and more forceful supervision,” said Richard Spillenkothen, a former director of the Fed Board’s Division of Banking Supervision and Regulation and now a Washington-based director at Deloitte & Touche LLP. “Regulators believe going into this crisis in 2007 that capital positions were too low and the liquidity cushions were not sufficiently robust.”

Just think what would have happened if they had done this a few years ago ...

LEIs Up 1.1

From the Conference Board:

The Conference Board Leading Economic Index™ (LEI) for the U.S. increased 1.1 percent in December, following a 1.0 percent gain in November, and a 0.3 percent rise in October.

.....

Says Ataman Ozyildirim, Economist at The Conference Board: "The Conference Board LEI for the U.S. increased sharply in December, and has risen steadily for nine consecutive months. The six-month growth rate has picked up slightly to 5.2 percent (about a 10.8 percent annual rate) in the period through December, substantially higher than earlier in the year. In addition, the strengths among the leading indicators have remained very widespread in recent months."

Adds Ken Goldstein, Economist at The Conference Board: "The indicators point to an economy in early recovery. The coincident economic index shows slow expansion of economic activity through December. The leading economic index suggests that the pace of improvement could pick up this spring."

Here are the internals:

Click for a larger image.

Note there was improvement across a variety of indicators -- that is, nine of the components showed some type of improvement.

The Conference Board Coincident Economic Index™ (CEI) for the U.S. rose 0.1 percent in December, following a 0.1 percent increase in both November and October. The Conference Board Lagging Economic Index™ (LAG) declined 0.2 percent in December, following a 0.5 percent decline in November, and a 0.2 percent decline in October.

Here is a chart of those numbers:

Note that three of the four components have been increasing for at least four months.


Forex Fridays


A.) There are four gaps higher in the first leg of the dollars rally.

B.) This is followed by a pennant pattern consolidation.

C.) After retreating to the 50% Fibonacci level, prices continued their upward climb, again gapping higher on several occasions.


A.) The MACD has given a buy signal,

B.) Money is flowing into the stock, and

C.) The EMAs are in a bullish configuration, although in a newly bullish configuration. That means ideally we'd like to see more time in this alignment.

Thursday, January 21, 2010

Today's Market


The SPYs sold off on big volume. Prices moved through support and two EMAs, printing a very long red bar.


The QQQQs sold off on big volume. Prices moved through support and two EMAs, printing a very long red bar.

This is how market corrections start.

Philadelphia Fed Shows Expansion

From the Philadelphia Federal Reserve:

The survey's broadest measure of manufacturing conditions, the diffusion index of current activity, decreased from a revised reading of 22.5 in December to 15.2 this month.* The index has now remained positive for five consecutive months (see Chart). Indicators for new orders and shipments suggest continued growth this month, but they also declined somewhat from their December readings. The current new orders index, which has remained positive for six consecutive months, decreased 5 points. The current shipments index fell 4 points. The current inventory index, although still negative, increased 4 points, to its highest reading in 26 months. Indicators for unfilled orders and delivery times edged higher and are both positive, suggesting stronger economic conditions.

Labor market conditions have been stabilizing in recent months, and for the second consecutive month, the percentage of firms reporting an increase in employment was higher than the percentage reporting declines. The current employment index increased 2 points, to its highest reading since February 2008. The workweek index fell back 2 points but has now been positive for three consecutive months.


Here is a chart of the data:


The regional manufacturing surveys were some of the original data points that turned positive. They continue to indicate growth ahead.

Jobless Claims +36,000

From Bloomberg:

Distortions cloud what on the surface is a negative jobless claims report. Initial claims jumped 36,000 in the Jan. 16 week to 482,000, marking a third straight increase and the fifth increase in five weeks -- not a streak that points to improvement in the labor market (Jan. 9 week revised 2,000 higher to 446,000). The four-week average, at 448,250, rose 7,000 in the week to snap a long streak of uninterrupted improvement going back to August.

Now the special factors. The Labor Department said claims piled up due to short holiday staffing at state processing centers. Market News International is quoting a Labor Department analyst as saying the week's gain is "not economic, but administrative." Starting with the next report, the government analyst expects the effect to reverse making for a steady decline in coming weeks. An implication here is that short-staffing this year was greater than prior years and is not offset by seasonal adjustments. Note also that data from an unusually large number of seven states had to be estimated for the current report.


From CNBC:

The number of U.S. workers filing new applications for unemployment insurance unexpectedly rose last week as claims delayed from the year-end holidays were pushed through, government data showed on Thursday.


In essence, the previous weeks numbers should have been higher, but were not because applications were delayed for various reasons. We'll have to see how that dynamic plays out in the next few weeks.

The 4-week moving average posted in increase, but this was the first one in 19 weeks. In other words, this increase is against the prevailed trend of claims.

Obama to Limit Bank Sizes

From the NY Times:

President Obama on Thursday will publicly propose giving bank regulators the power to limit the size of the nation’s largest banks and the scope of their risk-taking activities, an administration official said late Wednesday.

.....

The president, for the first time, will throw his weight behind an approach long championed by Paul A. Volcker, former chairman of the Federal Reserve and an adviser to the Obama administration. The proposal will put limits on bank size and prohibit commercial banks from trading for their own accounts — known as proprietary trading.

.....

Only a handful of large banks would be the targets of the proposal, among them Citigroup, Bank of America, JPMorgan Chase and Wells Fargo. Goldman Sachs, the Wall Street trading house, became a commercial bank during this latest crisis, and it would presumably have to give up that status.

“The heart of my argument,” Mr. Volcker said, “is who we are going to save and who we are not going to save. And I don’t want to save what is not at the heart of commercial banking.”


I wrote the following a few weeks ago:

Regarding wall street firms, you have two choices:

1.) Allow big institutions to exist, but regulate them with a regulator who has teeth and is willing to use its teeth.

or

2.) Reinstate Glass Steagall


It looks like the administration is going after number 2. Let's see if they actually do something or if the idea gets killed in Congress.

Thursday Oil Market Round-Up

Let's tale a look at the recent sell-off. Click for a larger image.


A.) Prices formed a three day broadening pattern -- a topping/reversal pattern

B.)Prices gapped down twice after forming the top.

C.) Prices hit resistance right around the 200 day EMA

D.) Prices have continued moving lower after moving through the 200 day EMA.

In addition, consider this chart:


A.) Prices are consolidating in a triangle pattern right around the 200 day EMA.

Wednesday, January 20, 2010

Today's Market

From Investopedia on buying climax:

Following a protracted period of selling or buying, a point wherein market trends are retarded or discontinued.

At a selling climax, the market is characterized by a trend reversal whereby the market begins to buy stocks and prices rise. For a buying climax, the opposite occurs, and the market begins to sell, resulting in lower prices. The climax is merely the highest point of selling or buying and can be followed by many trend reversals.


A.) Prices have been in a range for the last two weeks

B.) Volume has been increasing.


A.) Prices have been in a range and

B.) Volume has been increasing


A.) Prices have been in range and

B.) Volume is increasing a bit, but not to the degree as the SPYs and QQQQs

Housing Starts Down 4%; Permits Up 10%

From Bloomberg:

Building permits in the U.S. unexpectedly jumped in December, signaling gains in housing will be sustained into 2010 after winter weather depressed construction at the end of last year.

Applications rose 11 percent to a 653,000 annual rate last month, the most since October 2008, the Commerce Department said today in Washington. Work began on houses at a 557,000 pace, down 4 percent from November.

Builders are probably anticipating sales will increase after the government extended a tax credit for first-time buyers through June and expanded it to include some current owners. Record foreclosures and unemployment near a 26-year high represent hurdles that may prevent the industry from strengthening much further.


Note that the number of starts has been consistent for about 8 months. Yes -- it's at a low level. While new home inventory has been dropping builders are still concerned about overall demand. Hence the low rate of growth.
------------
Note by NDD:

There is a certain very well-known blog which, month after month, has been complaining about the reporting of housing starts and permits, among other housing data, because the reporting has failed to note that the situation is awful because the numbers showed Year-over-Year declines.

Well, today both the permits and starts numbers were positive YoY, starts just barely but permits by a substantial amount. So what did that blog have to say about the YoY numbers today? Nothing, that's what.

PPI Up .2%

From the BLS:

The Producer Price Index for Finished Goods moved up 0.2 percent in December, seasonally adjusted, the U.S. Bureau of Labor Statistics reported today. This rise followed a 1.8-percent advance in November and a 0.3-percent increase in October. At the earlier stages of processing, prices received by producers of intermediate goods rose 0.5 percent and the crude goods index moved up 1.0 percent. On an unadjusted basis, prices for finished goods advanced 4.4 percent in 2009, after falling 0.9 percent in 2008.


This is good news on several fronts. First, you want a little inflation (how much is "a little" is debatable.) However, a little inflation indicates that somewhere in the system there is either enough cost push or demand pull inflation to keep prices moving higher. Secondly, a deflationary threat got us into this mess. These numbers indicate that the deflationary scare is receding. This is clearly illustrated in this 12-month chart of the YOY change in PPI:


Click for a larger image

It's important to remember the YOY number is subject to an incredibly low comparison number. As a result, higher numbers on the YOY comparison are likely for some time.