Tuesday, February 19, 2008

What Inflation? pt. II

From the WSJ:

China's consumer prices surged by 7.1% in January, exacerbating the dilemma for policymakers who face both weakening global growth and a domestic economy still at risk of overheating.

The acceleration in inflation, up from 6.5% in December, came after heavy snowstorms in late January froze power grids and shut down road and rail transportation across much of southern and central China. The severe shortages of daily necessities that followed helped push the monthly inflation reading to its highest level since September 1996. And the snow's impact on prices is likely to be felt further in coming months, as it killed farm animals and damaged crops across a large part of the country.

The continued price increases, which have been gaining speed since early 2007, make it more difficult for the government to stimulate the economy to counter the recent financial-market turmoil and economic slowdown in the U.S. and Europe. China's inflation is still confined almost entirely to food -- where prices rose 18.2% in January -- but officials are concerned those increases could feed into bigger price spirals that would be much more difficult to contain.


All China has to do is go to a core inflation policy and everything will be OK.

And then there is this:

China's producer prices rose last month at their fastest rate in more than three years, adding to the inflationary pressures confronting Beijing policy makers.

Producer prices rose 6.1% in January from the year earlier, data issued by the National Bureau of Statistics showed yesterday.
The figure was up from 5.4% in December and was the highest since December 2004.

Curbing inflation and excess liquidity remain the focus of China's economic policy as producer prices, along with other recent economic data, suggest that the impact of the global economic slowdown hasn't been obvious in China so far, said Tao Wang, a Beijing-based economist at Bank of America Corp.

"The growing inflationary pressure, especially with buoyant export and money-supply growth, points to the necessity for China to continue its tight monetary policy," she said.


It's not just a US problem now, is it?

Oh yeah in case you missed this on Friday

The January increase in overall imports resumed the upward trend of the past year after a 0.2 percent decrease in December. The index, which had risen 3.1 percent in November and 1.5 percent in October, is up 13.7 percent over the past 12 months, the largest year-over-year increase since the index was first published in September 1982.


But we should be lowering rates right now....

Monday, February 18, 2008

What Inflation?

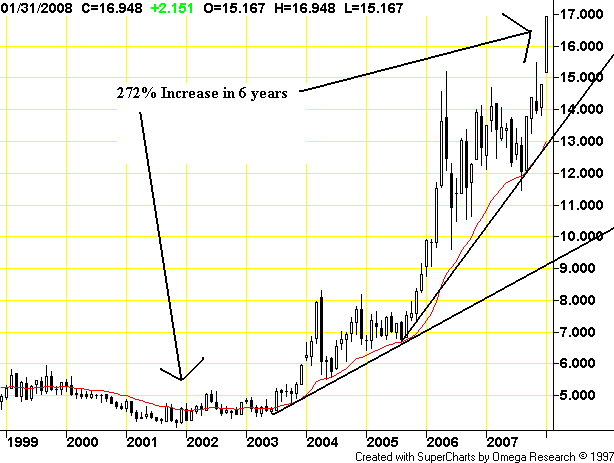
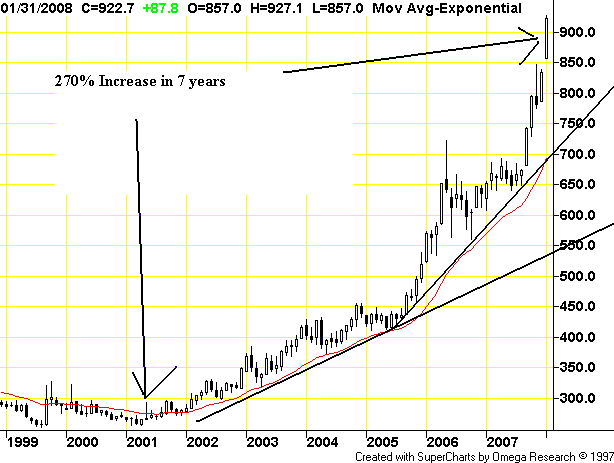
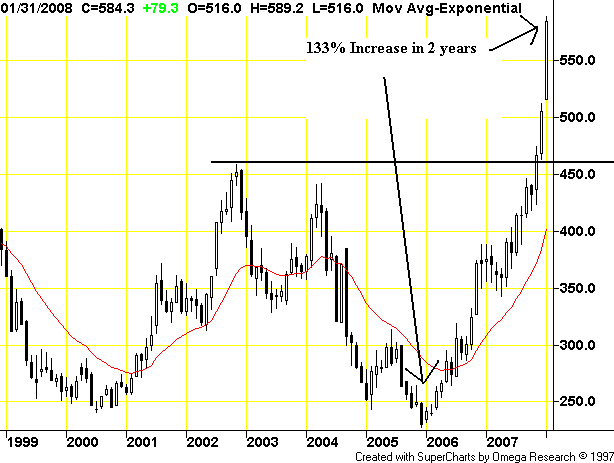
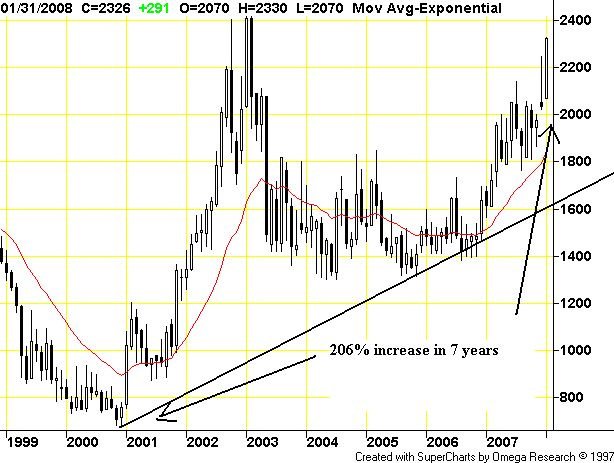
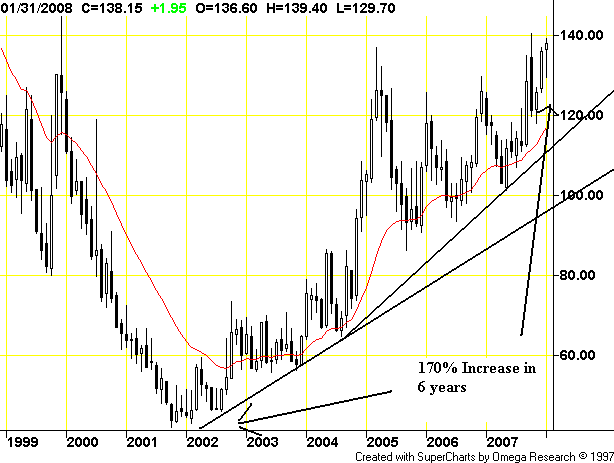
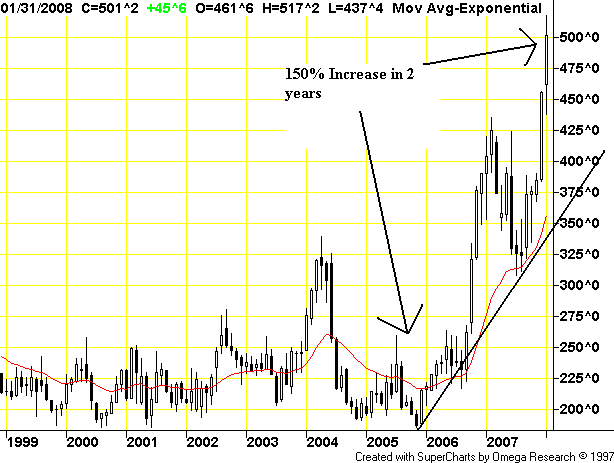
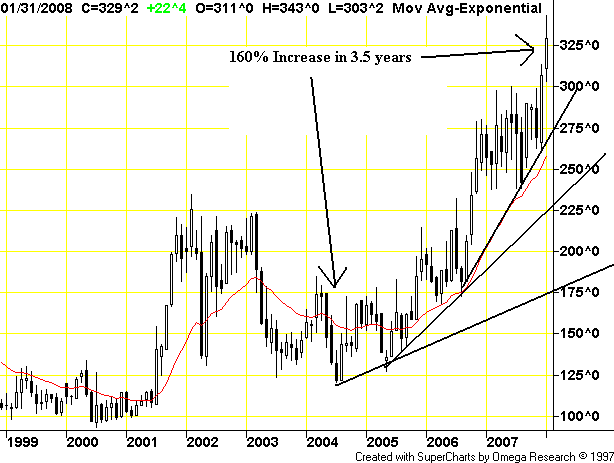
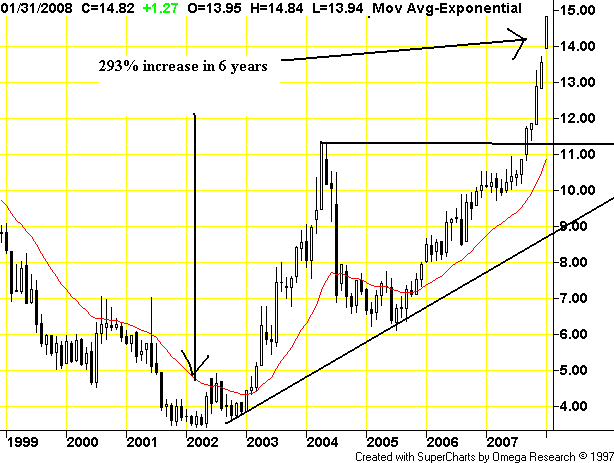
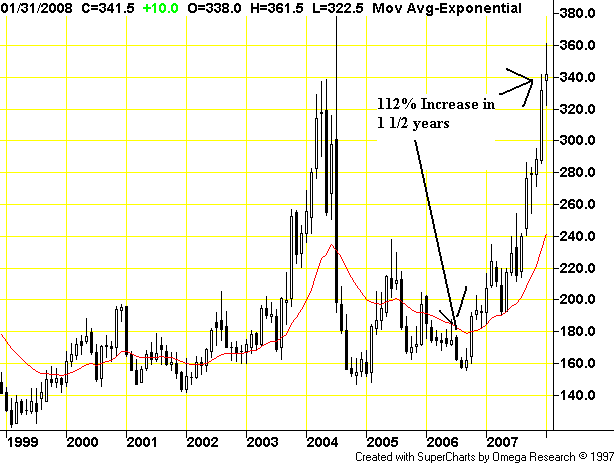
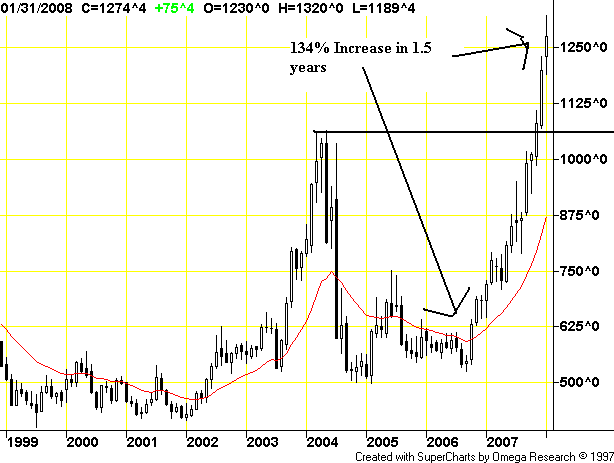
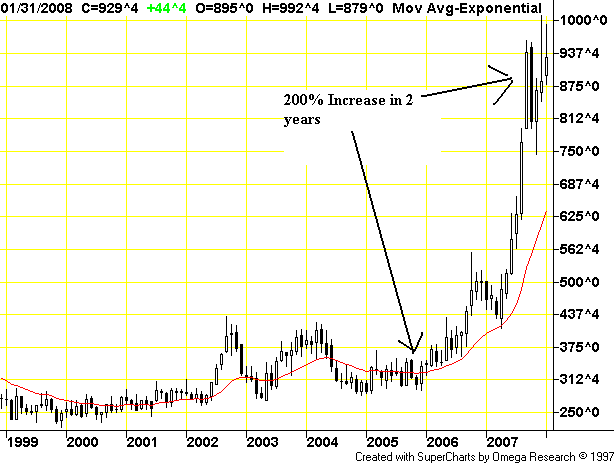
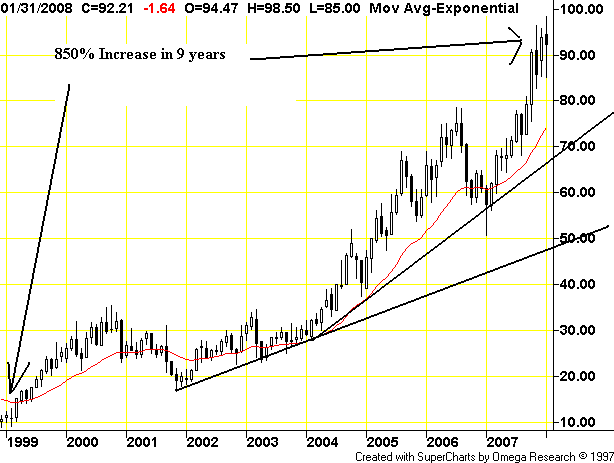
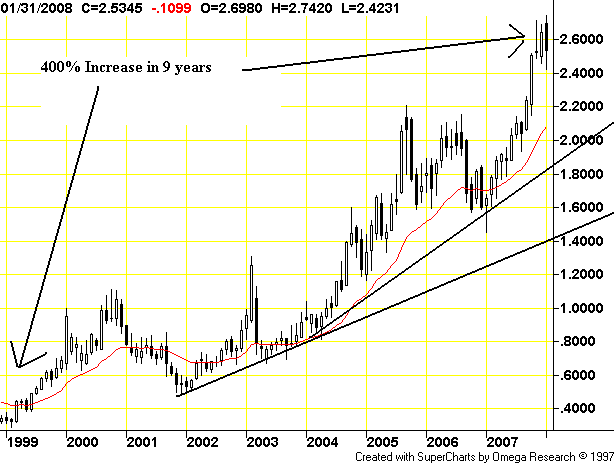
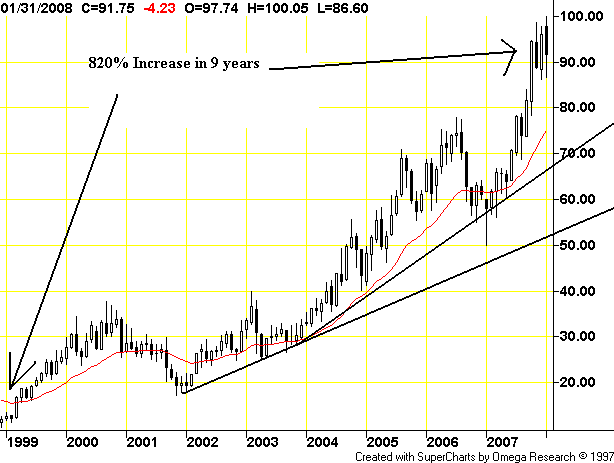
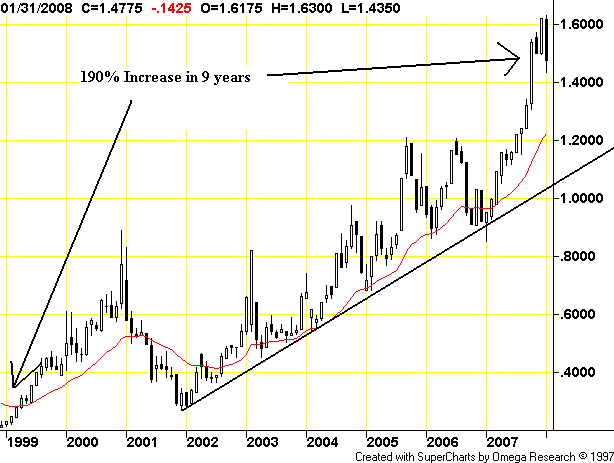
I've written this title a bunch over the last few months, largely in response to a story of a few commodities hitting new highs. However, I haven't looked at a ton of charts and compiled them into a master list. So here is that list.

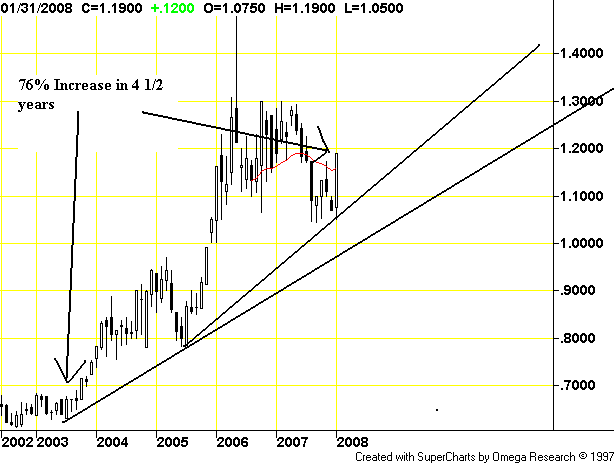
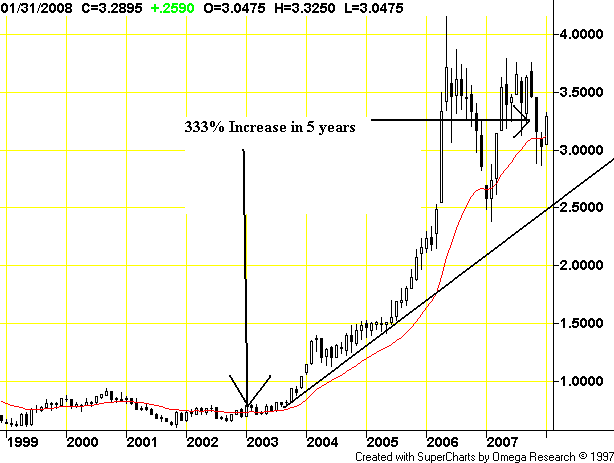
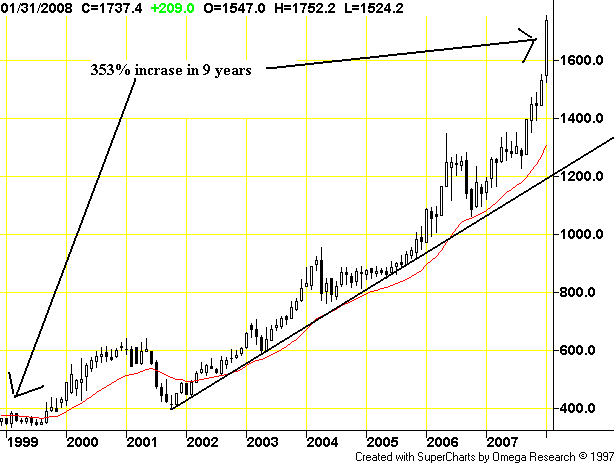
First I went to Futures Trading Charts. Then I looked at their futures charts for agricultural and energy commodities. I found 18 charts that show major price moves. All of them are listed below.

If this were one commodity I would dismiss it as a commodity specific price disruption. However, we're looking at major league price spikes across the spectrum of goods. That's a huge deal and it indicates a fundamental development in the markets. I stand by my standard explanation 101: with India's and China's standard of living going up, it's only natural the demand curve gets moved to the right. That means increasing prices.

I eyeballed the gains, so they might be off by a few percentage points either way but you get the rough idea.

Aluminum


Copper


Platinum


Silver


Gold


Canola


Cocoa


Coffee


Corn


Oats


Rough Rice


Soybean Meal


Soybeans


Wheat


Brent Crude Oil


Heating Oil


Light Crude


Propane


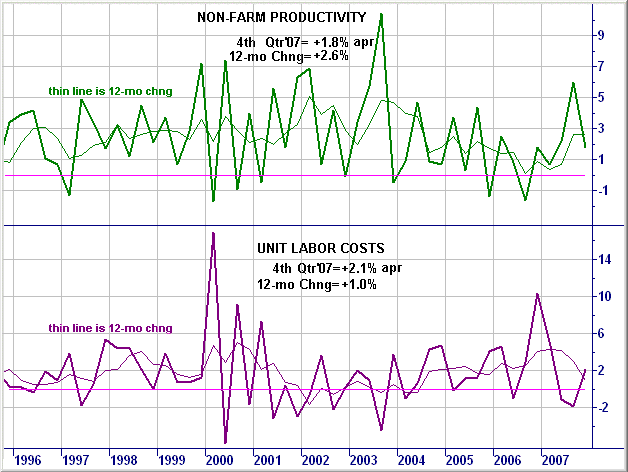
Now for the final question. Here is a graph from Martin Capital of Productivity.


Are the gains on this chart enough to absorb all of the cost increases demonstrated in the charts above?

Finally, given what the charts above show (who are you gonna believe -- government statistics or your lyin' eyes?) is this really a good environment to start lowering rates?

Market's Are Closed Today

The markets are closed today. I'm going to catch-up and hopefully get a bit ahead on school work. Or I'll get sucked into the Law and Order Marathon on TNT. I'll be back tomorrow.

Sunday, February 17, 2008

The Week Ahead

From an information perspective, we really don't get that much.

First, the markets are closed on Monday for President's day.

Wednesday we get two important stats. Housing starts and CPI. I'm especially curious about CPI in the wake of the import export price release last week that showed the highest rate of growth since 1982.

With any housing statistic, its more a matter of how bad will it be? I can't the the homebuilders doing any major buildouts right now.

As for the market, I'm waiting for one of the big averages to break out of the consolidation pattern we're in.

Saturday, February 16, 2008

Last Week's Markets

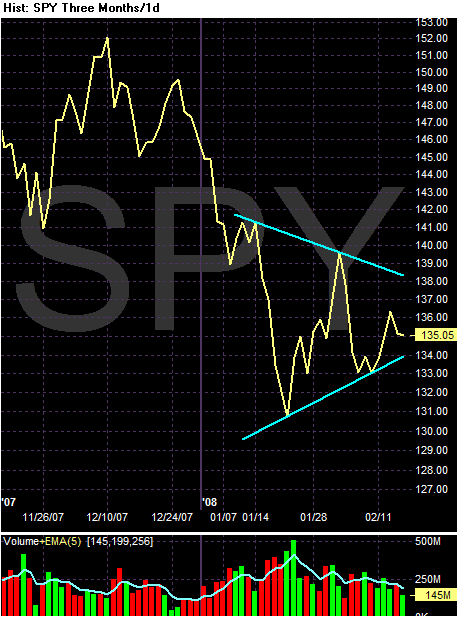
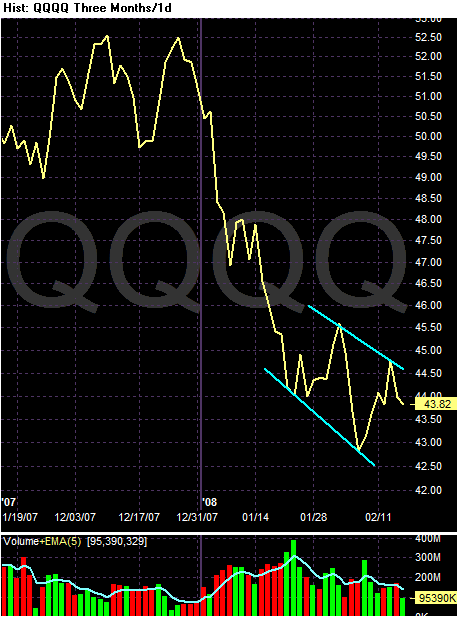
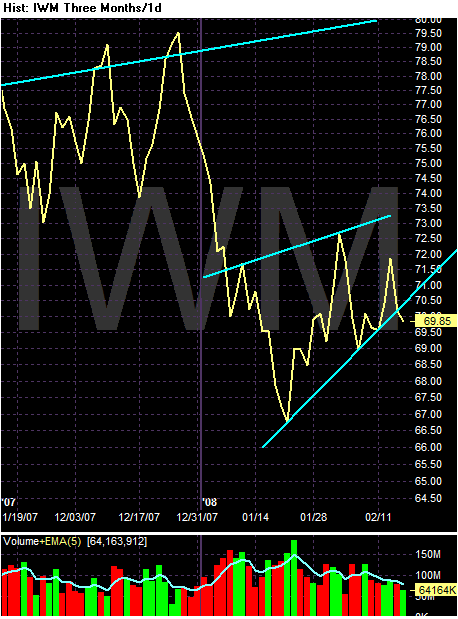
For the last week I used longer charts to clear out the noise and show the market was consolidating for the week. That's what I'm going to do here. First, here are the line charts of the SPYs, QQQQs, and IWMs to show the consolidation.


We're still firmly in the middle of a consolidation except for the IWMs which broke below support on Friday. However, there has been a great deal of bouncing around on the part of all the averages lately, so I want to see a stronger break before I call a break of the triangle.

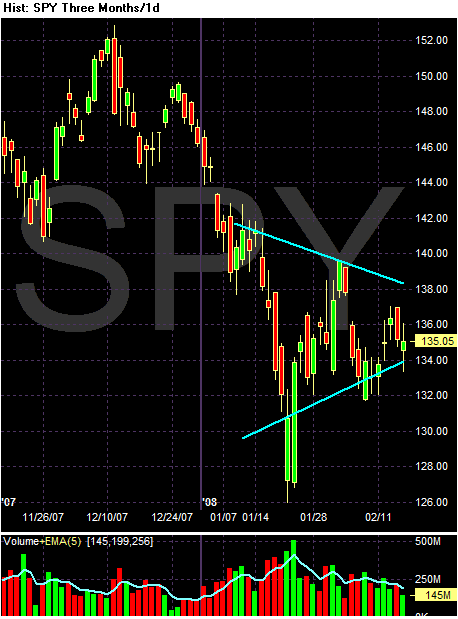
Here are all three charts in candle form. I have kept the lines from the previous charts in the same place.


The markets have been extremely hard to read lately -- there is a lot of conflicting sentiment out there. The bulls have the Fed on their side while the bears have literally every other piece of data. Who wins is anybody's guess.

Friday, February 15, 2008

Weekend Weimer and Beagle.

The markets will soon be closed. So that means its time to stop thinking about the economy and the markets for now.

Usually I have pictures of my Weimaraners and the future Mr$. Bonddad's Beagle up right now. But this week a Beagle named Uno won best in show. So here is the You Tube of the moment of victory. Notice how Uno is baying throughout.


And here's a video from the AP with some background.

How Do We Get Out of This Mess?

I've done a great deal of complaining about the overall conditions in the financial markets but I haven't offered any solutions. So, here's my answer.

There isn't much we can do. Any solution would create a moral hazard, meaning the solution would encourage the behavior that got us into this mess in the first place. To illustrate this point, let's take a quick look at what got us into this mess.

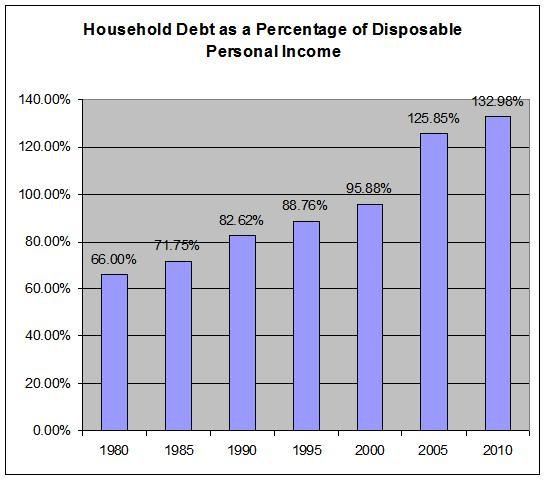
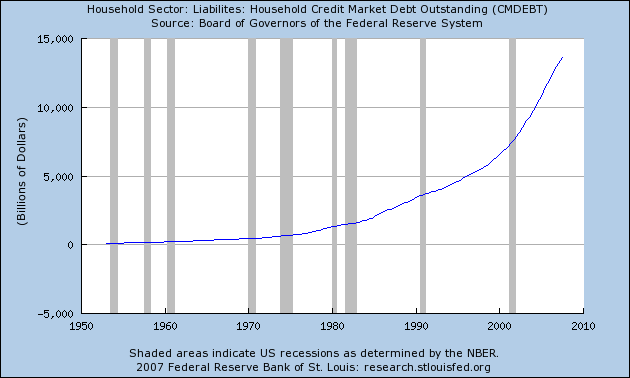
This expansion is characterized by a massive expansion of household debt. First, here is a chart of total household debt outstanding going back a few decades.


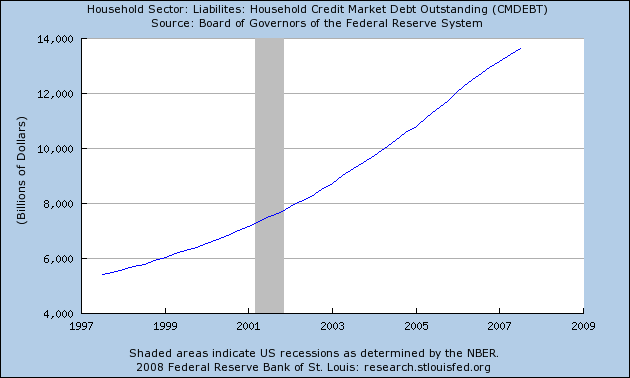
Here is the same chart for the last 10 years.


To put all of this debt in perspective, here are two graphs.
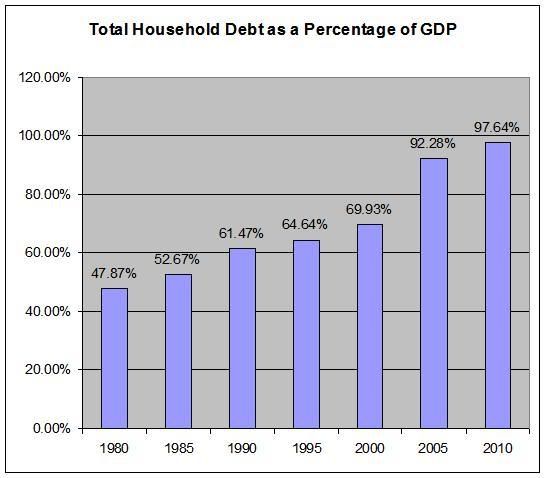


So, we have almost as much household debt as we do national product, and we have more dent than we have disposable income.

In other words -- we are awash in debt.

All of this debt has to go somewhere. That's where all of the securitizations you've heard about come into play. Here is a definition from Wikipedia:

Securitization is a structured finance process in which assets, receivables or financial instruments are acquired, classified into pools, and offered as collateral for third-party investment.[1] It involves the selling of financial instruments which are backed by the cash flow or value of the underlying assets.[2]

Securitization typically applies to assets that are illiquid (i.e. cannot easily be sold). It is common in the real estate industry, where it is applied to pools of leased property, and in the lending industry, where it is applied to lenders' claims on mortgages, home equity loans, student loans and other debts.

All assets can be securitized so long as they are associated with a steady amount of cash flow. Investors "buy" these assets by making loans which are secured against the underlying pool of assets and its associated income stream. Securitization thus "converts illiquid assets into liquid assets"[3] by pooling, underwriting and selling their ownership in the form of asset-backed securities (ABS).[4]

Securitization utilizes a special purpose vehicle (SPV) (alternatively known as a special purpose entity [SPE] or special purpose company [SPC]) in order to reduce the risk of bankruptcy and thereby obtain lower interest rates from potential lenders. A credit derivative is also generally used to change the credit quality of the underlying portfolio so that it will be acceptable to the final investors.

Securitization has evolved from tentative beginnings in the late 1970s to a vital funding source with an estimated total aggregate outstanding of $8.06 trillion (as of the end of 2005, by the Bond Market Association) and new issuance of $3.07 trillion in 2005 in the U.S. markets alone.[citation needed]


So all of the household debt has been carved and sold to, well, everybody.

As this process accelerated the entire financial system became very lax in literally everything they did. Mortgage brokers stopped performing due diligence -- meaning they stopped making credit checks. Investment banks who bought collateral to securitize stopped performing in-depth analysis of the assets they were purchasing. Ratings agencies totally dropped the ball in their analysis of the collateral, instead giving literally every single piece of paper a AAA rating so anybody could buy it. Investors who bought this paper didn't look under the hood at the collateral either. In short -- everybody dropped the ball.

The problem we're running into now is we're discovering that all of this debt isn't as valuable as we thought it was for a variety of reasons. Either the value of the collateral backing the loans is decreasing in value (declining home values) or people are increasingly not paying their bills (increasing delinquencies). As a result, the entire financial system is experiencing a huge "revaluation of risk" which simply means they are having to writedown the value of all these securitized assets on their books. This is what Bernanake was talking about yesterday.

As the concerns of investors increased, money center banks and other large financial institutions have come under significant pressure to take onto their own balance sheets the assets of some of the off-balance-sheet investment vehicles that they had sponsored. Bank balance sheets have swollen further as a consequence of the sharp reduction in investor willingness to buy securitized credits, which has forced banks to retain a substantially higher share of previously committed and new loans in their own portfolios. Banks have also reported large losses, reflecting marked declines in the market prices of mortgages and other assets that they hold. Recently, deterioration in the financial condition of some bond insurers has led some commercial and investment banks to take further markdowns and has added to strains in the financial markets.


In short, the financial sector is feeling the pain of their complete lack of due diligence for the last 7 years. Now they are going to Congress asking for a bail-out. The problem is this: any bailout will only encourage this kind of behavior all over again. And that is something we have to avoid to prevent this from happening again.

Now -- this policy prescription means the following: the US economy will perform -- at best -- at a sub-par level for a while. It also means we risk the possibility of a recession. There is this fundamental belief -- encouraged by Alan Greenspan's policies -- that an economy does not have to feel pain. Nothing could be further from the truth. The only way to clean out the dead wood is to clear the way for them to report massive losses and possible go bankrupt. That's how you solve the problem.

What the Fed should be doing right now is ensuring that prices don't get out of control so that on the other side of a recovery the economy is not faced with inflationary pressures. That way when we get out of this mess we'll be able to resume a period of solid growth.

What Inflation?

From the BLS:

The U.S. Import Price Index increased 1.7 percent in January, the Bureau of Labor Statistics of the U.S. Department of Labor reported today, led by a 5.5 percent increase in petroleum prices. The overall increase followed a 0.2 percent decline in December. U.S. export prices advanced 1.2 percent in January following a 0.4 percent rise in December.

The January increase in overall imports resumed the upward trend of the past year after a 0.2 percent decrease in December. The index, which had risen 3.1 percent in November and 1.5 percent in October, is up 13.7 percent over the past 12 months, the largest year-over-year increase since the index was first published in September 1982.

The Central Problem We Face

Bernanke spoke to Congress yesterday. Here are some key points from his speech.

As the concerns of investors increased, money center banks and other large financial institutions have come under significant pressure to take onto their own balance sheets the assets of some of the off-balance-sheet investment vehicles that they had sponsored. Bank balance sheets have swollen further as a consequence of the sharp reduction in investor willingness to buy securitized credits, which has forced banks to retain a substantially higher share of previously committed and new loans in their own portfolios. Banks have also reported large losses, reflecting marked declines in the market prices of mortgages and other assets that they hold. Recently, deterioration in the financial condition of some bond insurers has led some commercial and investment banks to take further markdowns and has added to strains in the financial markets.


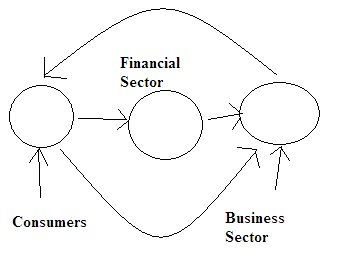
Let's go back to out basic model of the US economy:


As the chart demonstrates, the US financial system is at the center of the economy. It acts as a financial intermediary between lenders (individuals' assets pooled together) and borrowers. The financial system must be healthy for the economy to prosper.

But it's not. More importantly, Bernanke clearly knows what the the problems are. At a time when lower interest rates should be increasing the total amount and value of loans, financial companies are also reporting increasing losses, a diminishing asset base and the addition of poor performing assets to their respective balance sheets. In other words -- financial companies have a ton of really bad assets on their books which prevents them from making new loans.


BTW: Bernake is a convenient whipping boy for me. I think he is making a boneheaded mistake right now by lowering rates and signaling he will lower further. Inflation is far higher than he thinks and lower interest rates aren't having the effect he wants.

However, despite me vociferous disagreement with Bernanke, he's a bright guy and no one should doubt his ability.

Alan Greenspan Disclaimer

Greenspan is in the news again. Now he thinks the US is almost in a recession.

From now on all news reports that even mention Greenspan's name must have the following opening paragraph.

Alan Greenspan GOT US IN THIS MESS. Greenspan confused asset inflation with economic growth. Greenspan also lowered interest rates to 0% after adjusting for inflation, meaning he encouraged a wave of reckless borrowing the likes of which the world has never seen. As a result, the financial system is currently choking on a ton of bad debt which is slowing the economy. Thanks Alan.
Thursday, February 14, 2008

Today's Markets

The markets resumed their up/down I have no idea where I'm going pattern again today.


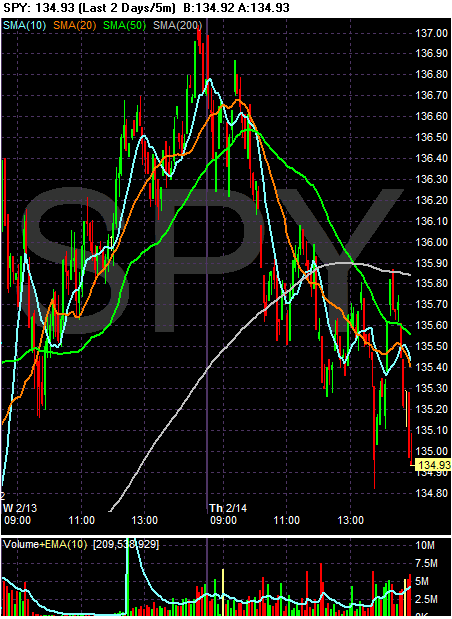
The SPYS consolidated a bit at the opening, but then traded down for the rest of the day. The good news is the selling was controlled -- each move down was met with a move up. The bad news is there was considerable selling at the end of the day on high volume spikes, indicating traders were very nervous about holding anything overnight.


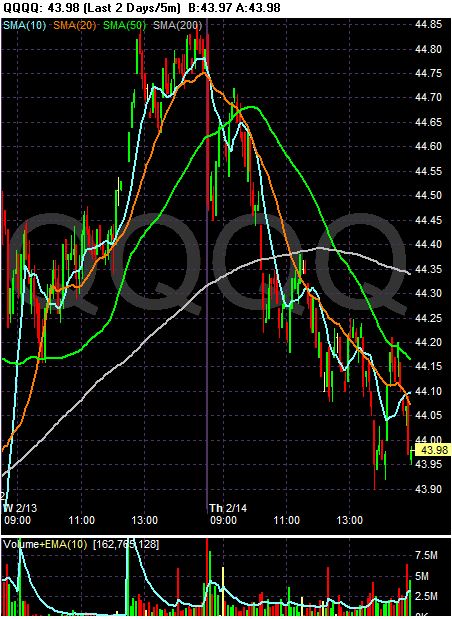
Save for the lack of consolidation at the opening of trading, the QQQQs action mirrored the SPYs.


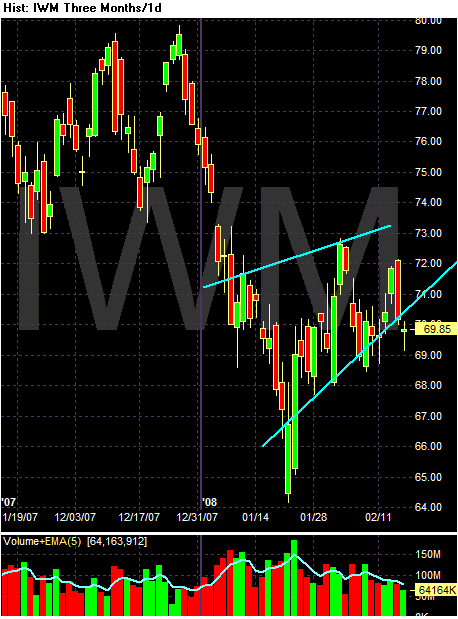
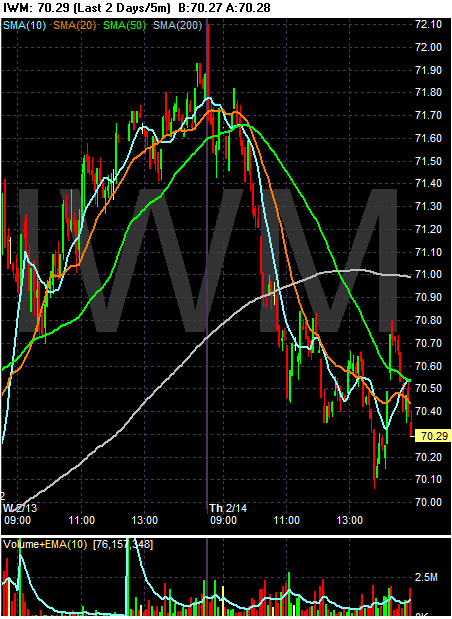
The IWMs had the sharpest selling of the day. But like the SPYs and QQQQs, they traded down for most of the day.

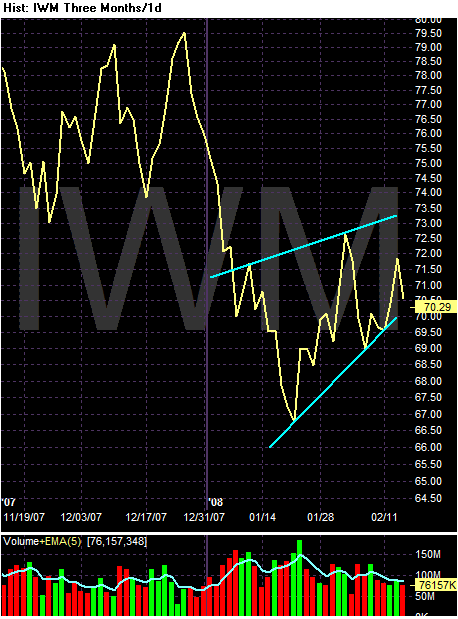
And the consolidation continues for all the averages.


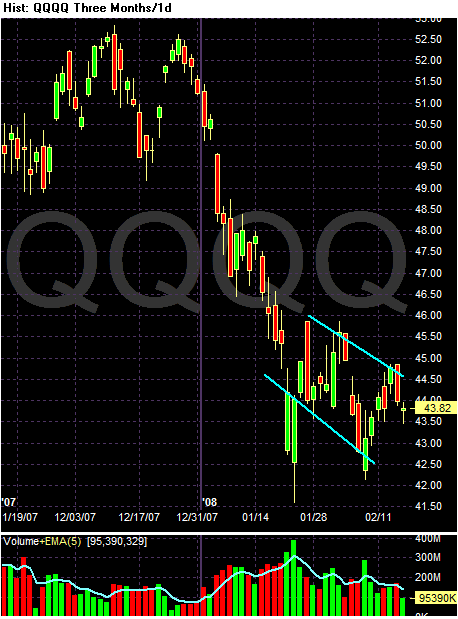
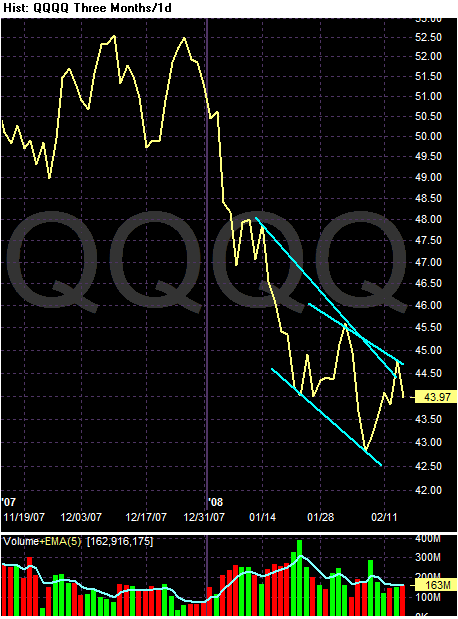
The QQQQs have a downward sloping trend in place, although its also possible to call this a consolidation of sorts.


We're still caught between the bulls and bears. I find it interesting the Bernanke's promise of more rate cuts didn't give the market a bigger lift. That might mean that traders now think the rate cuts aren't working and that further cuts won't either.

Bernanke to Wall Street: "I'm Your Bitch"

From Marketwatch:

Federal Reserve Chairman Ben Bernanke said Thursday the central bank was ready to cut interest rates further if fresh signs of a weaker-than-expected U.S. economy emerge.

The Federal Open Market Committee, which sets Fed monetary policy, "will be carefully evaluating incoming information bearing on the economic outlook and will act in a timely manner as needed to support growth and to provide adequate insurance against downside risks," Bernanke told the Senate Banking Committee in prepared testimony.

The Fed has done a lot to stave off a recession but stands ready to do more if the outlook darkens, he said.


(Sung to the Tune of Ghostbusters) When interest rates are negative after adjusting for inflation, who do you call? Bernanke!

I realize that 1.) Bernanke's in a really bad place, 2.) No one wants to do nothing when the world is falling apart, 3.) Saying "lowering interest rates won't help" isn't an answer anyone wants to hear, and 4.) saying, "The financial intermediary system really screwed up and now they need to pay the price" isn't an answer anybody wants to hear either.

But the signs are very clear that interest rate cuts aren't helping. The credit markets are still frozen. And the problems are spreading. The student loan market is now tightening. Junk Bond Yields are spiking. The CDO market is experiencing more problems. The monoline insurers are a breath away from a credit downgrade. Low interest rates won't help when the issue is counter-party risk and saving your own financial ass.

So maybe the Fed should start thinking about their other mandate -- price stability. If they can keep prices stable through all of this mess we might be better off in the long run.

Clearing Out the Noise

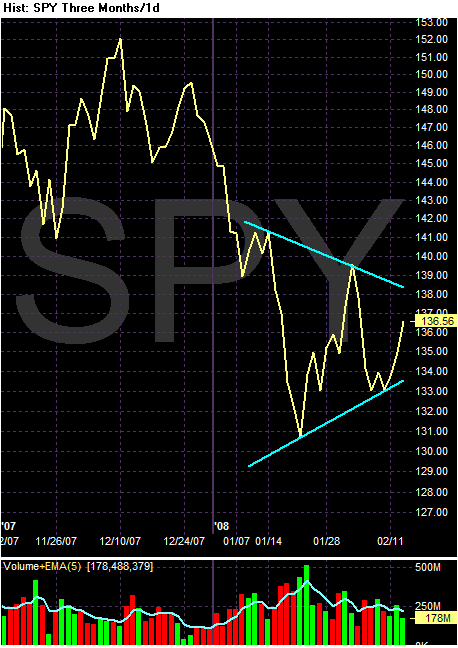
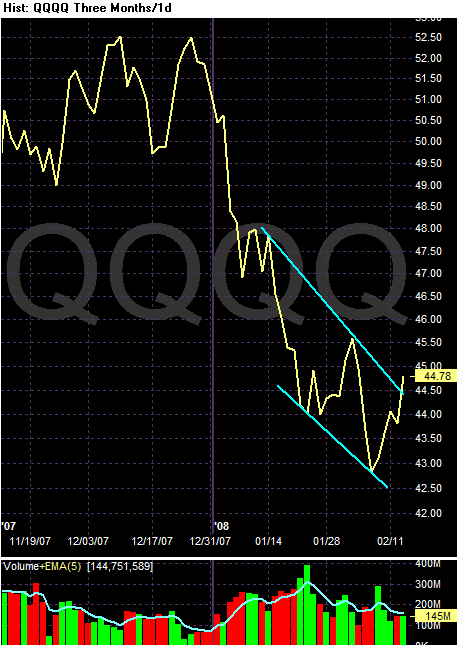
I am not a big fan of line charts. I think candlestick charts give us far more useful information. But sometimes you need to use a different method of looking at the market to clear out the noise and see what is really going on. And line charts show the underlying market trend far better than candlestick charts right now.


On the SPYs, notice we have a clear triangle consolidation pattern.


On the QQQQs we have a downward sloping channel with a trend break. That could a bullish turnaround from a technical perspective.


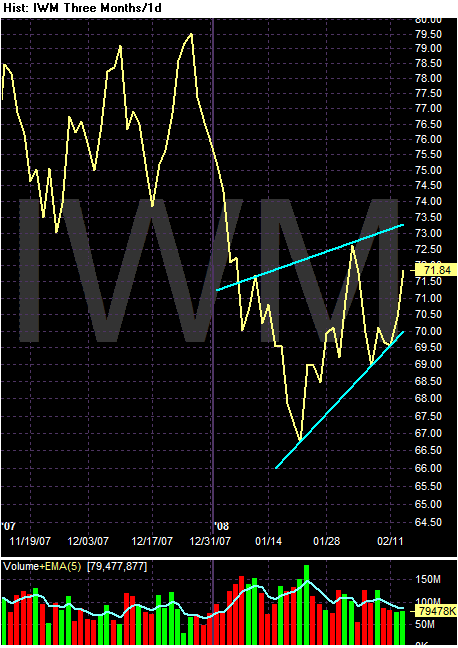
On the IWMs, notice we have a bear market flag.

Bottom line: I still see a bear market with a temporary rally or consolidation going on.

Of course, it's also important to remember Bonddad's first rule of trading: the markets will make an ass of you whenever possible, and the markets have a ton of tools at their disposal to do that.

Banks Beg For Congress To Establish a Moral Hazard

From the WSJ:

The banking industry, struggling to contain the fallout from the mortgage debacle, is urgently shopping proposals to Congress and the Bush administration that could shift some of the risk for troubled loans to the federal government.

One proposal, advanced by officials at Credit Suisse Group, would expand the scope of loans guaranteed by the Federal Housing Administration. The proposal would let the FHA guarantee mortgage refinancings by some delinquent borrowers.

Credit Suisse officials have met with senior officials from the Department of Housing and Urban Development, which runs the FHA, and other policy makers to discuss the proposal.

The risk: If delinquent borrowers default on their refinanced loans, the federal government would have to absorb the loss.


This news infuriates me to no end. What makes it worse is because this is an election year, the plan might actually gain traction.

Let's review all of the actors that caused this mess.

Mortgage brokers: Because the person brokering the loan knew the loan would be sold to a third party the broker has no obligation to make sure the borrower would actually repay the loan over an extended period of time. In addition, some brokers were given higher commissions for selling riskier loans.

Investment Banks: These organizations were hungry for collateral and pressured brokers and originators for more loans to pool and sell. This is the type of pressure that led the mortgage bankers to stop looking at things like "credit history." In addition, investment banks were lax in their due diligence to deeply inspect collateral.

Ratings agencies: who actually said most of this paper was AAA and therefore could be purchased by practically anybody.

All these people are now suffering. Many businesses have gone out of business or are suffering serious declines in their share price. GOOD. Let me repeat that. Good. Yes, I know that sucks for the rest of the economy. But the only way for these organizations to change their behavior (which was the proximate cause in starting the mess in the first place) is to feel the pain. And publicly traded companies feel pain by reporting losses to their shareholders.

Bernanke has already demonstrated that he is Wall Street's bitch. Let's hope Congress can grow a spine and tell the financial industry to grow up. Of course, this is the same organization that is now investigating steroids at the beginning of a recession, so who am I kidding.

Wednesday, February 13, 2008

What Inflation?

From Marketwatch:

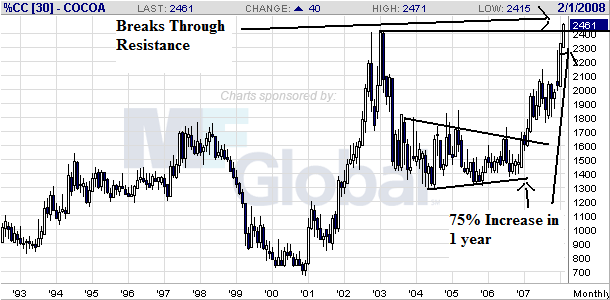
Chocolate makers, already beset by escalating dairy prices, are likely to encounter a bittersweet Valentine's Day. The culprit: a recent surge in the price of cocoa.

Raw cocoa futures for March delivery closed up $33 at $2,454 a metric ton on Wednesday, after reaching as high as $2,471 a ton. The gains on New York's IntercontinentalExchange punctuate a steep run that in the last three weeks has pushed the near-term contract to its highest closing level since April 1985.


Here's a chart of cocoa:


From Marketwatch:

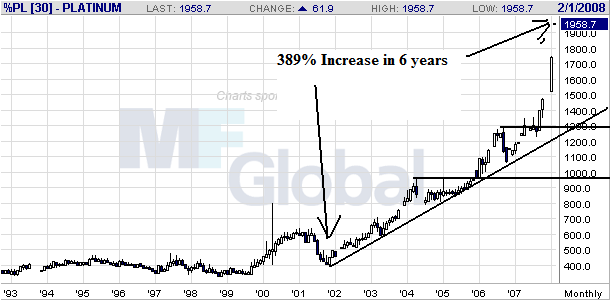
Gold finished slightly lower Wednesday, as platinum soared to a new record high over $2,000 an ounce, fuelled by ongoing worries about declining supply from South Africa, the world's biggest platinum producer.

Platinum for April delivery surged to a new record of $2,001.40 an ounce on the New York Mercantile Exchange. The contract rallied $61.90 to end at $1,983.70 an ounce.


Here's the chart of platinum


From Bloomberg:

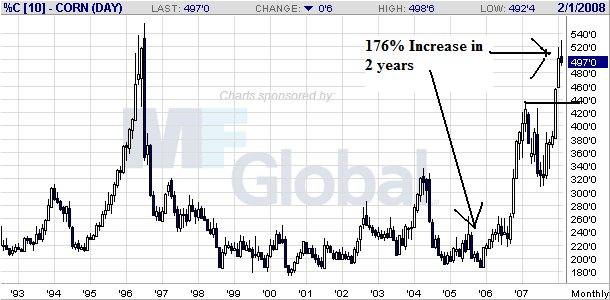
Corn fell for the third straight day on speculation that overseas demand for the biggest U.S. crop is slowing after prices climbed to records last week.

Advance sales of corn for delivery before Aug. 31 are up 33 percent in the past five months from a year earlier to a record 47.4 million metric tons, the U.S. said on Feb. 7. Confidence in the global economy fell for a third month in February as the slowdown in the U.S. spread to Europe and Japan, a Bloomberg survey showed.

``End-users are already well covered on their needs for this year and will slow purchases after the run up in prices,'' said Don Roose, president of U.S. Commodities Inc. in West Des Moines, Iowa. ``News of demand slowdowns always follows the market after these kinds of rallies.''


Here's the chart of corn


Note that I've highlighted spiking prices in a variety of commodities -- oil, wheat, soybeans and gold just to name a few. This means we're not looking at a supply disruption in one commodity that is driving prices of that particular commodity higher; instead, we're looking at system wide price spikes.

Today's Markets

As I've done all week, I want to back up use a longer time frame to show the market. The bottom line is I'm just not happy with the way Mr. Market is acting, and the longer version demonstrates why.


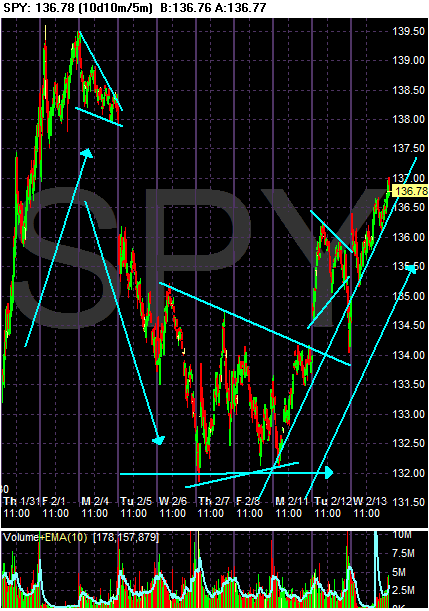
On the SPYs we have the following action:

-- A two day rally, followed by a bull market flag.

-- A big 2-day drop, leading into a triangle consolidation that lasted 4 days

-- A three day rally

Notice the pattern -- rally, steep sell-off, rally. And in all the time we've added about 2.68% but have gotten there in an incredibly messy way.


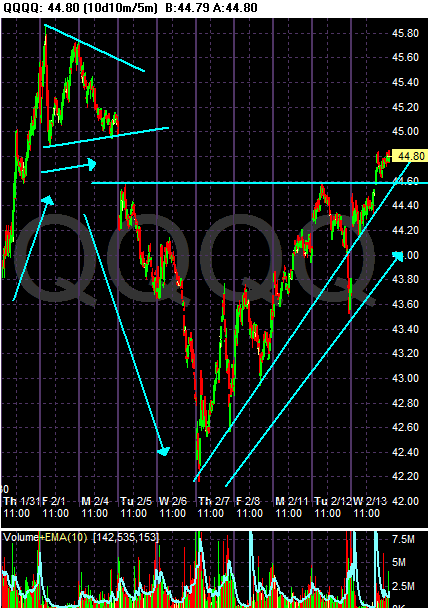
On the QQQQs, notice we have

-- A two day rally and a triangle consolidation.

-- A steep two day sell-off

-- A five day rally that nets us 1 point over 10 days, or a 2.28% gain.

Notice the pattern -- rally, sharp-sell off followed by a rally. This is an awful lot of wasted motion.


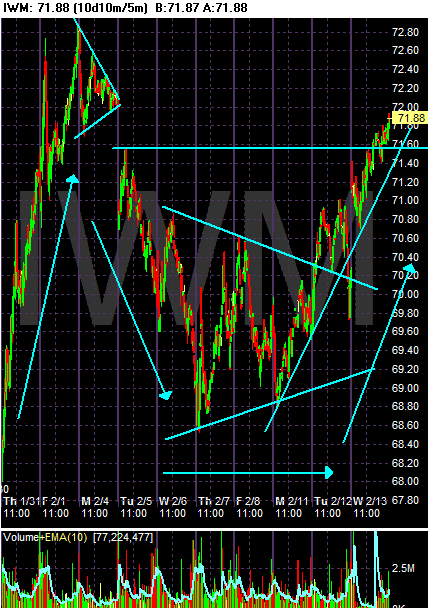
On the IWMs, notice:

-- A 2-day rally followed by a one day triangle consolidation.

-- A steep 2 day sell-off followed by a 4 day triangle consolidation pattern

-- A three day rally that nets us almost 4 points or 5.7%.

A case can be made that the IWMs are doing well because of the net gain. But again, loot at the trading.

Traders want to see trends -- and I don't see any at this point. I see a lot of fits and starts and a great deal of tentativeness on the part of everybody in the market.

Retail Sales Up. .3%

From the Census Bureau:

The U.S. Census Bureau announced today that advance estimates of U.S. retail and food services sales for January, adjusted for seasonal variation and holiday and trading-day differences, but not for price changes, were $382.9 billion, an increase of 0.3 percent (±0.5%)* from the previous month and 3.9 percent (±0.7%) above January 2007. Total sales for the November 2007 through January 2008 period were up 4.4 percent (±0.3%) from the same period a year ago. The November to December 2007 percent change was unrevised from -0.4 percent (±0.4%)*.

Retail trade sales were up 0.4 percent (±0.7%)* from December 2007 and were 3.8 percent (±0.8%) above last year. Gasoline station sales were up 23.0 percent (±2.8%) from January 2007 and sales of nonstore retailers were up 10.6 percent (±2.0%) from last year.


The problem occurs in the details.

So what increased?

Food and Beverage Stores: +.6%
Grocery Stores: +.3%
Health and Personal Care Stores, +.8%
Gas Stations: +2%
Clothing: +1.4%
Autos: +.6%

What does this tell us?

1.) Necessities are increasing.
2.) How much of the food and gas station increase is the result on food a gas inflation?
3.) I have no idea why autos increased. It's especially odd considering:


Economists were surprised by the gain. Car companies reported earlier this month that sales fell to just a 15.3-million annual rate.


What decreased?

Furnitures/home furnishings: -.5%
Sporting Good Stores/Hobby: -1.3%
Building Materials/Gardens: -1.7%
Electronics/Appliance: -1%

Housing still stinks. No duh.
Leisure activity and electronic gizmos. Non-necessities (that's a word now).

The point is the food and gas inflation are behind at least some of the increases. Also, consider this:

However, excluding autos and gas, sales were flat in the month. Read government report.

So, two areas are responsible for those increases. But of those two areas --

1.) Auto sales increased despite auto companies reporting falling sales, and

2.) Gas sales -- while are subject to some pretty serious inflationary pressures -- are responsible for a large part of the gains.

Color me unimpressed.

Why A Rate Cut Won't Help

From Bloomberg:

The Federal Reserve's interest-rate cuts last month have failed to lower borrowing costs for many companies and households, increasing the chance of further reductions from the central bank.

Companies are paying more to borrow now than before the Fed reduced its benchmark rate by 1.25 percentage point over nine days in January, based on data compiled by Merrill Lynch & Co. Rates on so-called jumbo mortgages, those above $417,000, have increased in the past month, making it tougher to sell properties and risking further price declines.

``It's the clogging up of the credit markets that worries me most,'' Harvard University economist Martin Feldstein said in an interview in New York. ``The Fed has done a lot of cutting, the question is whether it's going to get the traction that it did in the past.''

Banks and investors are demanding greater compensation for offering credit as losses mount on subprime-mortgage securities and concerns grow that ratings of bond insurers will be cut. Elevated borrowing costs mean Fed Chairman Ben S. Bernanke will have to reduce rates further to revive the economy, Fed watchers said.

``The problem is that every piece of news we're getting continues to be bad,'' said Stephen Cecchetti, a former New York Fed bank research director, and now a professor at Brandeis University in Waltham, Massachusetts. ``They will have to ease more. It's the only thing they can do.''


Let's take this a bit slower to see what is really going on.

The Fed cut rates 1.25% in January. But the interest rate on loans is increasing. That tells us a very important fact. Lenders are scared out of their minds about further losses from new loans. With all of the writedowns we have seen already, lenders are reeling from problems. They are not in a position to make a ton of loans -- it's that simple. As a result, they are demanding higher interest rates. In addition, I'm guessing that some lenders have realized they seriously under-priced risk and are now figuring out that even a good credit risk is more risky than has been priced in the last few years.

I'm also guessing that banks are looking down the road:


And not liking what they are seeing.

What a Real Central Bank Looks Like

From Bloomberg:

The Bank of England raised its inflation forecast and signaled policy makers may need to keep interest rates higher than investors currently predict.

Inflation will overshoot the central bank's 2 percent goal in two years and risks breaching the government's 3 percent limit before then, the bank said in London today. The bank based its forecasts on investors' bets for the benchmark interest rate to fall to 4.5 percent by the end of the year.

The pound rose and rate futures climbed. Bank of England Governor Mervyn King is weighing the need for further rate cuts after the bank reduced borrowing costs last week for the second time in three months to cushion the economy from a slowdown. While the U.S. Federal Reserve lowered its benchmark at the fastest pace since 1990 last month, U.K. policy makers have been more cautious as they seek to control inflation.

``Inflation is, in the medium term, more likely to be above the target than below'' if rates fall as investors forecast, King told reporters in London today. King said it's ``odds on'' inflation will exceed 3 percent and he'll have to write a letter of explanation to Chancellor of the Exchequer Alistair Darling.


According to Bloomberg, the Bank of England rate is 5.25% -- hardly a painful level.

Treasury Market Update

Let's take a look at the Treasury market to see what the charts say.

But first, here are the main events that move the Treasury market:

Inflation expectations: Treasury investors get a fixed rate of return, so anything that lowers that fixed rate of return should cause the market to sell-off.

Flight to safety: The more uncertain the economic times, the more likely investors will buy Treasury bonds.

Interest rate policy: When the Federal Reserve is lowering interest rates, previously issued debt with higher coupons becomes inherently more valuable because it has a higher yield. When the Fed is raising rates, previously issued debt is less valuable because it inherently has a lower yield.

The importance of each of these factors varies depending on more factors than you can count.


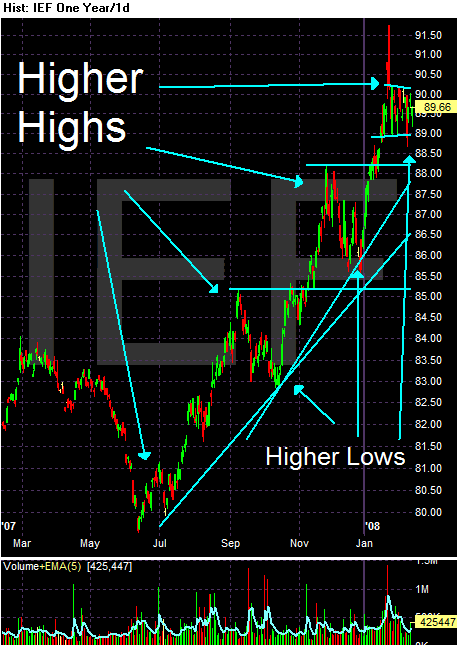
The 7-10 year area of the market is still firmly in an uptrend marked by higher highs and higher lows, although it is currently forming a flag consolidation pattern.

Concern about the economy and the credit markets is leading investors to move into Treasuries. The Fed's interest rate policy is also helping. However, consider this information from the BLS:

The Consumer Price Index for All Urban Consumers (CPI-U) decreased 0.1 percent in December before seasonal adjustment, the Bureau of Labor Statistics of the U.S. Department of Labor reported today. The December level of 210.036 (1982-84=100) was 4.1 percent higher than in December 2006.


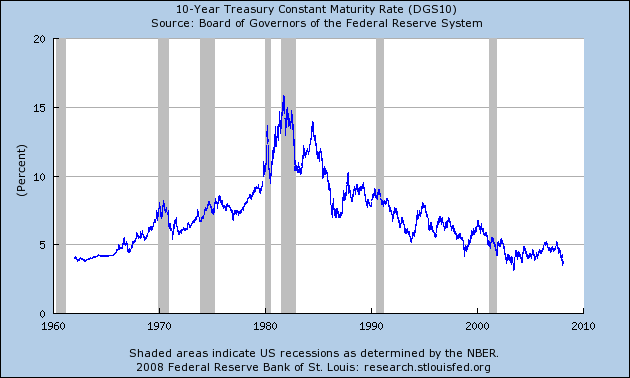
And now look at this chart from the St. Louis Federal Reserve of the yield of the 10-year CMT (constant maturing treasury):


The real return on the 10-year Treasury is negative after adjusting for inflation. That should tell you how concerned investors are about the markets and the economy.


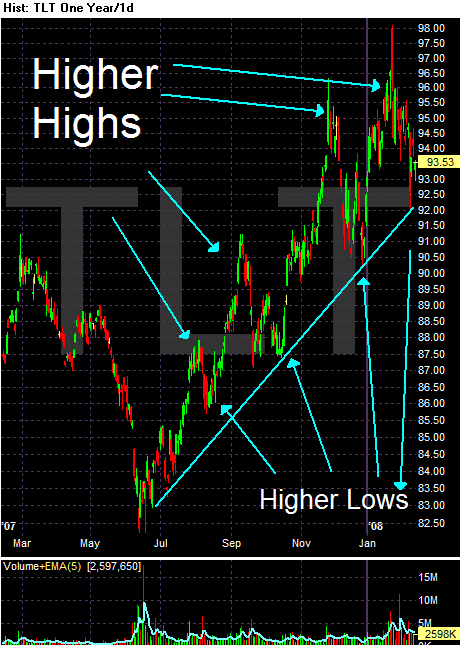
The 20+ year area of the Treasury market is still rallying as well. It has a clear pattern of higher highs and higher lows. Right now prices are retreating to the trend line, so we'll see if this pattern holds.

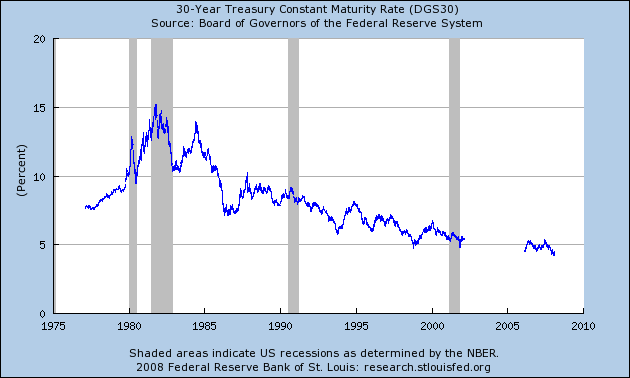
However, consider the inflation information from above plus the following chart of the 30-year CMT yield:


According to Bloomberg, the current yield on the 30 year is 4.48%, making it's inflation adjusted interest rates .38.

The Treasury market is not an area where investors play for capital gain. Income is always a consideration. That means safety of capital and return of capital (not return on capital) is driving a lot of traders and investors right now.