Tuesday, January 15, 2008

Is Oil Topping Out?

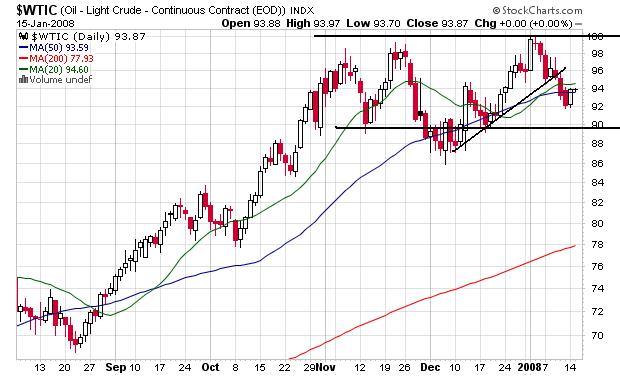
I haven't written about oil lately, so I thought it would be a good time to see what the charts say.


On the daily chart, we have a clear consolidation pattern between roughly $90 and $100. On the bullish side we still have (and will continue to have for the foreseeable future) a huge increase in demand as India and China continue to grow. On the bearish side we have a possible US recession. However, I have to wonder

1.) How much a US recession would really impact US demand, and

2.) If the increased demand from India and China would compensate for the decrease demand from the US if we have a recession.

I don't have a firm answer to #2, but I have a sneaking suspicion that the answer is the new demand would be pretty strong.


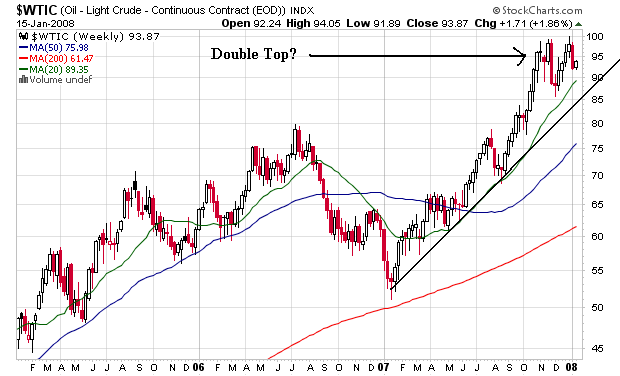
On the weekly chart, we still have an uptrend but a possibility of a double top forming. I don't think a retreat from this level would represent the fact that demand is dropping as much as it would represent profit taking.

A Look At the Top 10 IBD Stocks

Investor's Business Daily publishes a list of the 100 best stocks according to its proprietary analysis system. Overall, the company's methods are very sound. In addition, these stocks are widely traded by many traders who rely on the IDB analysis to preselect solid stocks. SO looking at the top 10-20 stocks can illustrate where some of the "leading stocks" are and give us an idea of where the market may be headed.

Disclaimer: I am not endorsing or dissing any of these issues. I am simply using the IBD list as a way to get a feel for what some traders are seeing in the markets.
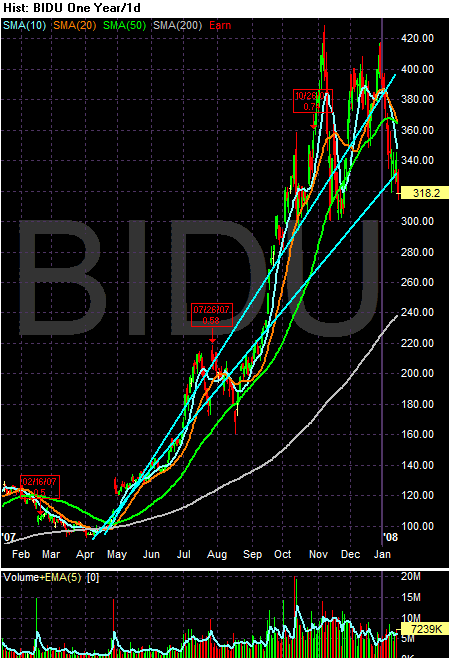


There are two possible long-term trend lines with BIDU. But whichever one you like or prefer, the stock broken long-term support. In addition, the stock has fallen considerably below the 50 day SMA, and the 10 and 20 day SMA are both headed lower. This is starting to look like its moving into correction mode.
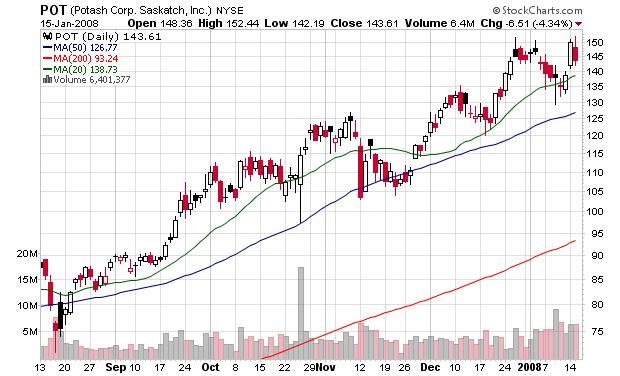


POT is still in a clear uptrend. It's been bouncing off the 20 and 50 day SMA for the last 6 months. The Agricultural chemicals are of the market is very strong and will probably remain so for some time.
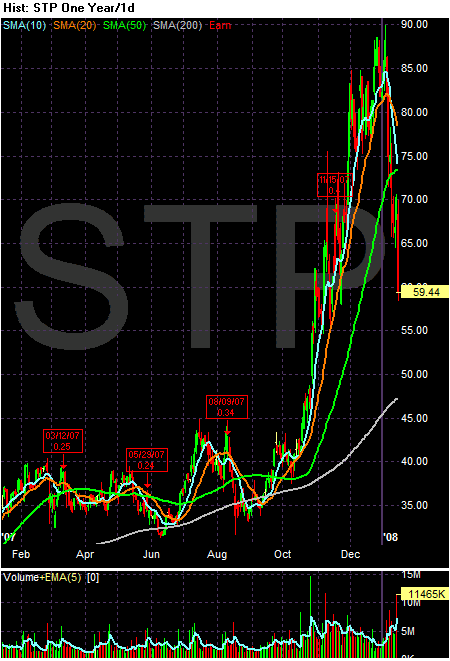


STP (Suntech) has been hit by profit taking and is clearly in correction mode. The 10 and 20 day SMAs are both headed lower and prices have moved below the 50 day SMA.
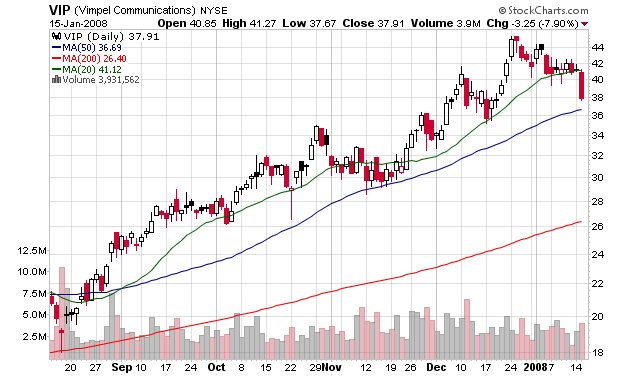


VIP (Vimpel Communications) is still in an uptrend as well. It has been bouncing off the 20 and 50 day SMA for the last 6 months. However, a few more days like yesterday and this stock will be in a correction/sell-off. But before we make a firm trend reversal call, the stock should move through the 50 day SMA.
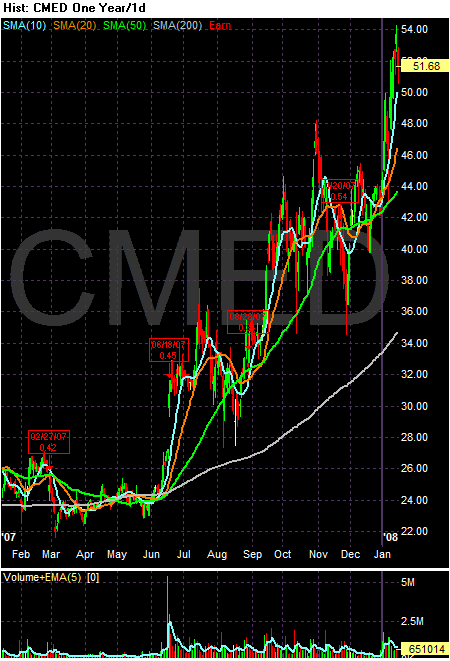


China Medical is still rallying. The 10, 20 and 50 day SMAs are all moving higher, the shorter SMAs are higher than the longer SMAs and prices are above all the moving averages. It is a Chinese stock, after all.
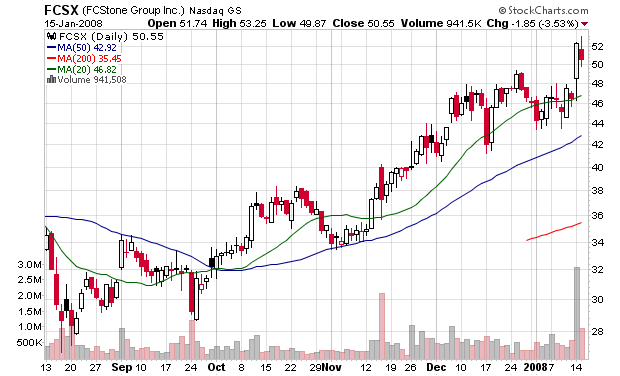


FC Stone (FCSX) is still clearly in a rally as well. It has been using the 20 and 50 day SMAs for support for the last few months. In addition, prices consolidated over the last month and broke out of that range on strong volume yesterday.
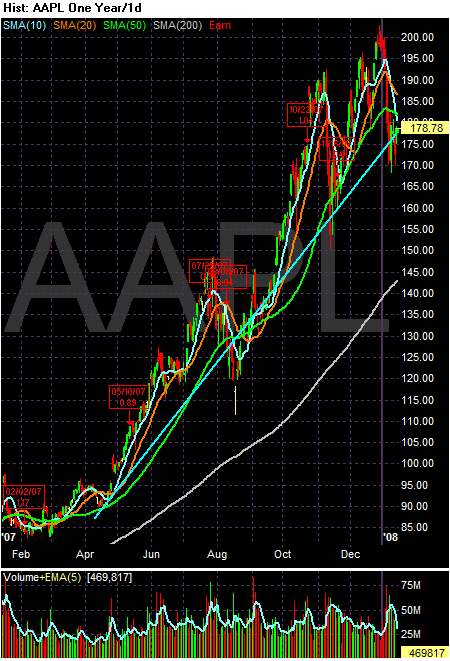


Apple is still in a rally, but is barely hanging on. Prices are below the 50 day SMA, the 10 and 20 day SMA have both turned lower and the 10 day SMA just crossed over the 50 day SMA at a fairly steep angle.
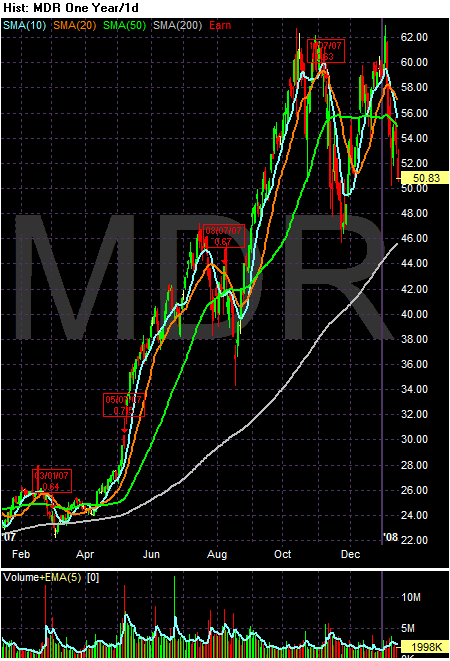


MDR (McDermott International) has formed two double tops. The first occurred in October of last year and the second occurred in October of last year and early January. In addition, prices are below the 50 day SMA, although they have been at this level before and rallied back. However, it looks like this stock is in the middle of a correction.
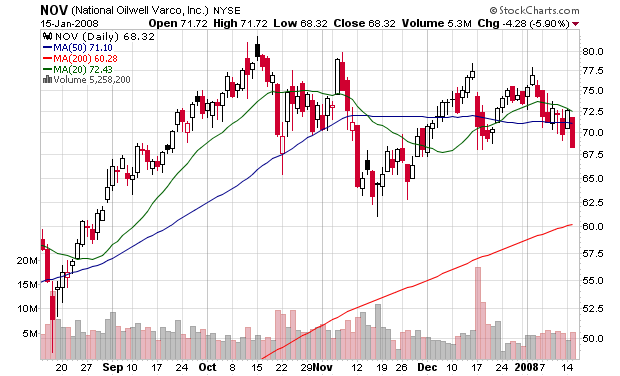


National Oilwell (NOV) is consolidating. The good news here is it hasn't crashed, largely because of its energy orientation. But the moving averages are clustered indicating the stock is looking for direction.
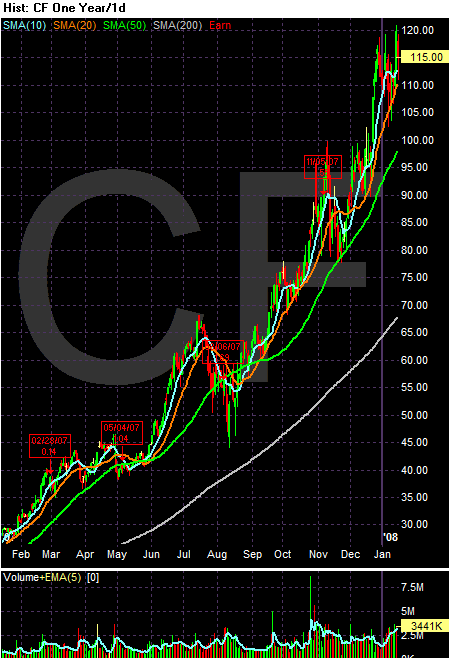


CF Industries is still rallying as well. All the moving averages are moving higher, the shorter SMAs are above the longer SMAa and prices are above all the SMAs.

So, we have the following:

Six stocks -- POT, FCSX, Apple, VIP, CMED and CF are still rallying.

One stock -- National Oilwell -- is consolidating.

Three stocks -- BIDU, STP and MDR have started to correct.

I should also add that BIDU has barely started to correct and Apple and VIP are barely hanging on.
Today's Markets

One writedown can ruin your whole day....Citigroup announced a horrible writedown and the markets tanked.

There are a couple of ways to look at the markets right now. I'm going to use the daily charts as opposed to the 5-minute charts. The 5-minute charts are filled with tons of noise that I don't think is helpful.


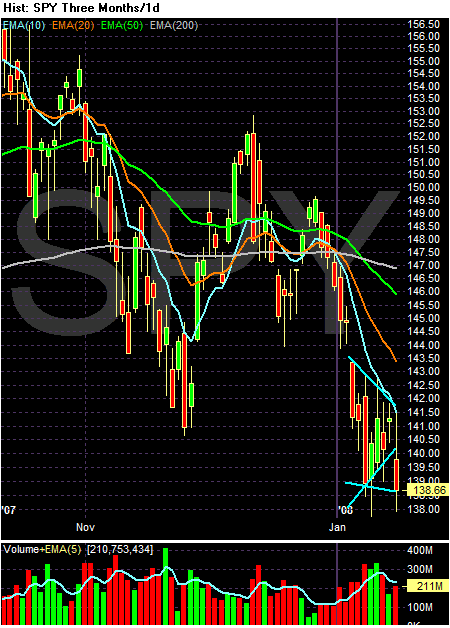
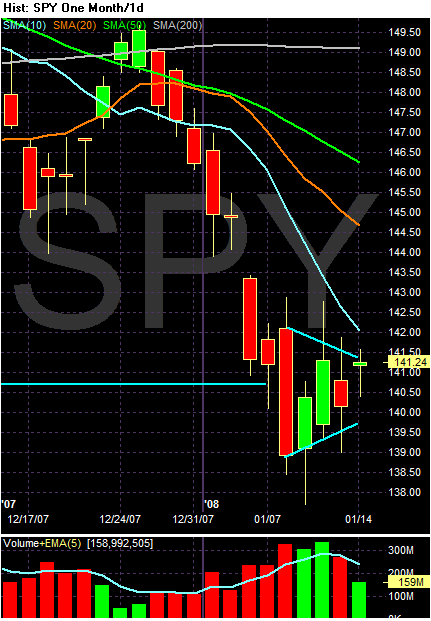
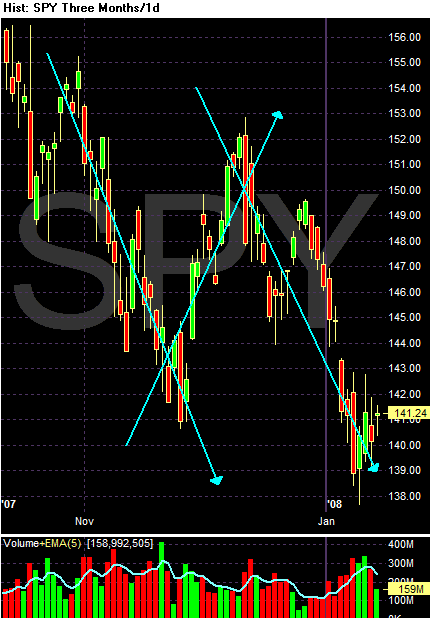
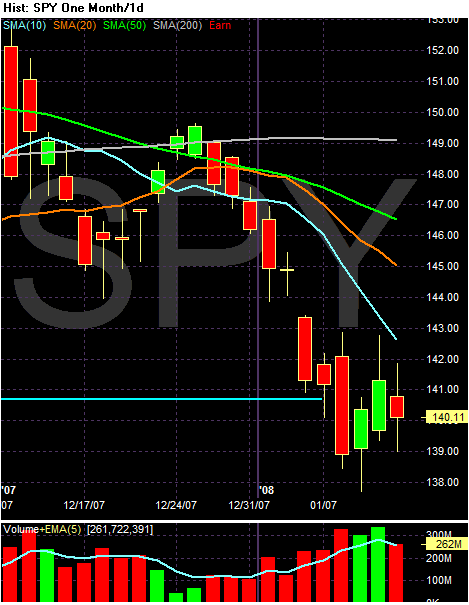
On the SPYs, we've either broken down from a triangle consolidation pattern, or we're still in a downward sloping pennant pattern consolidating. Today's volume spike should indicate we've broken down from a consolidation pattern, but we need further price action to be sure one way or the other.


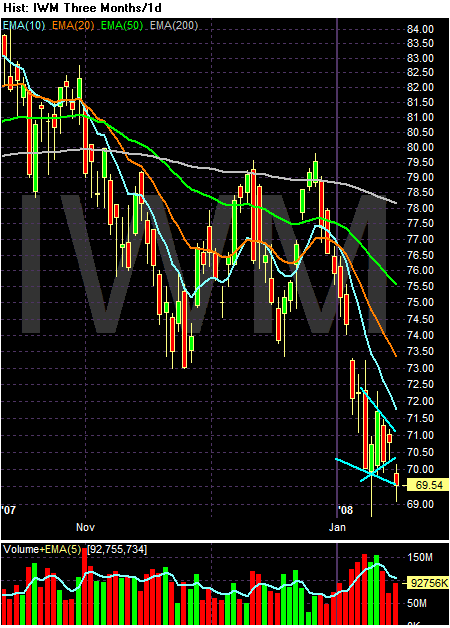
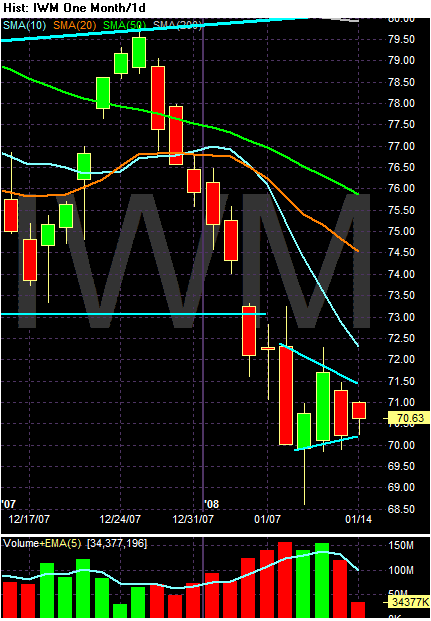
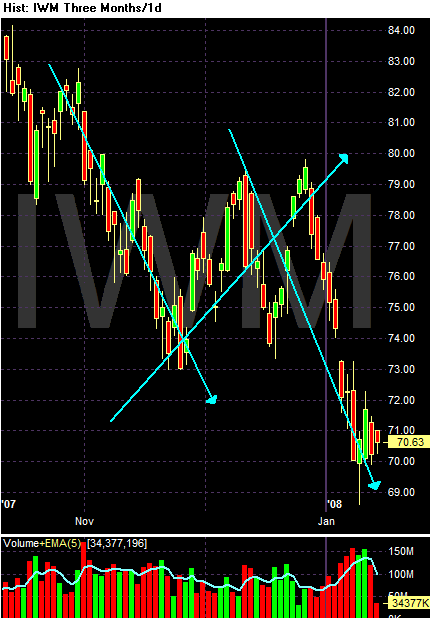
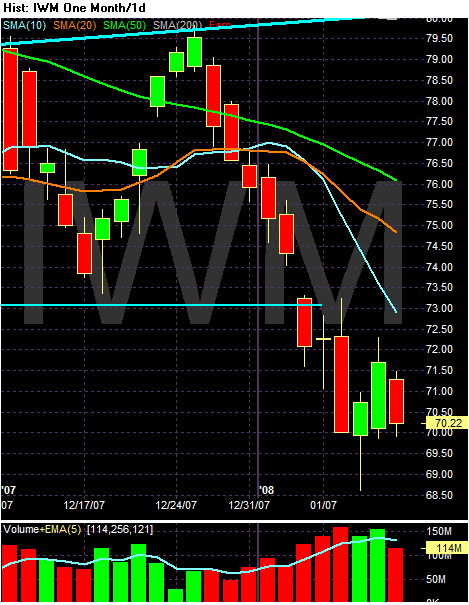
The exact same analysis applies to the Russell 2000 (IWM). Most importantly, we need more information from the charts one way or the other; there are still too many possible interpretations to make a firm conclusion.


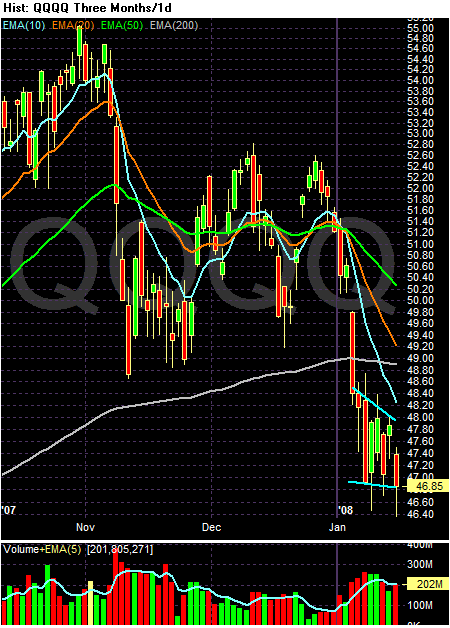
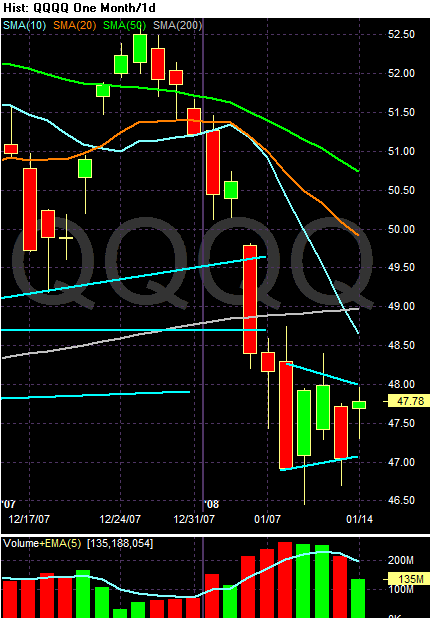
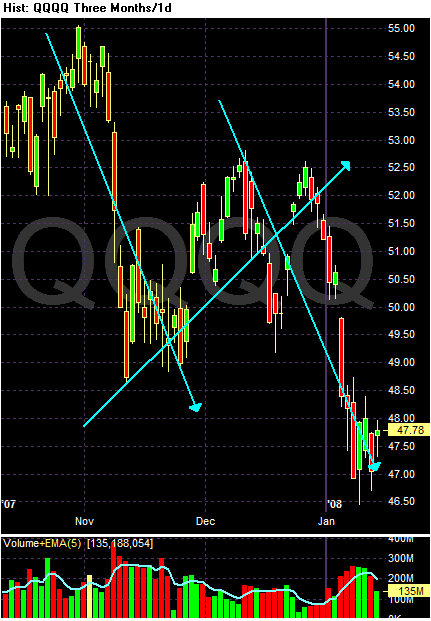
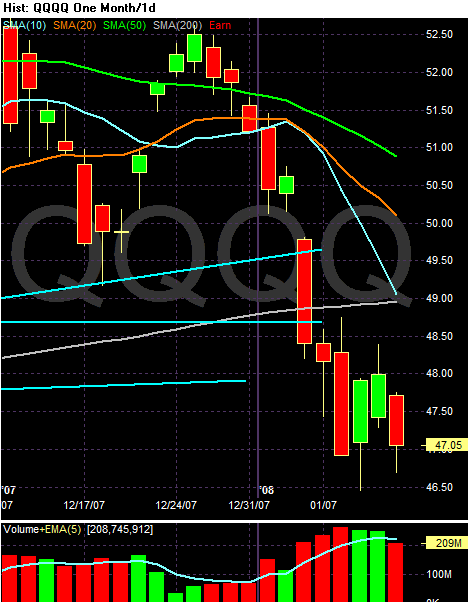
The QQQQs are still in a downward sloping pennant pattern.
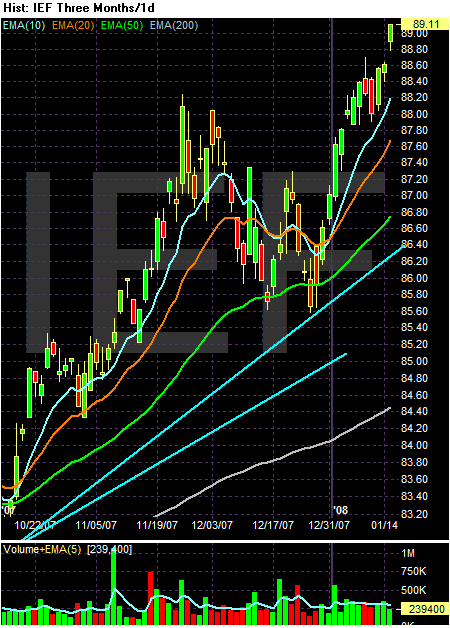
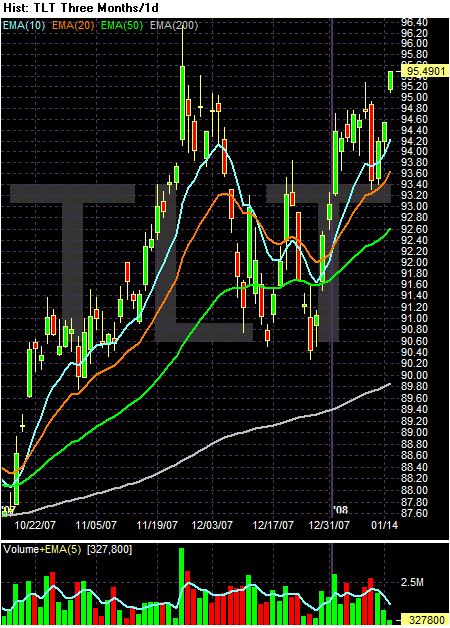
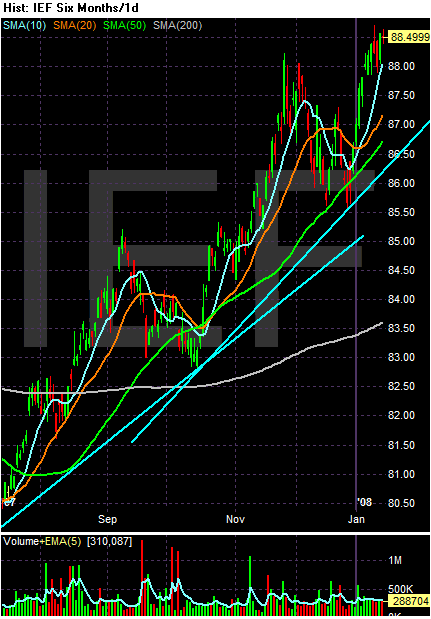
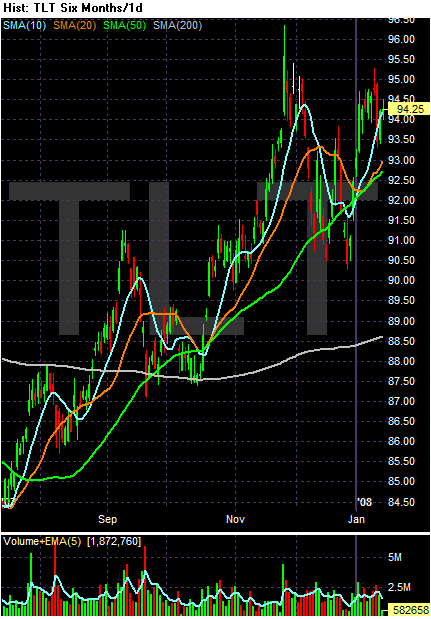
While I don't usually touch on the Treasury market in the daily warp-up, notice that safe haven buying is clearly continuing as evidence from the upward move in the IEF (7-10 year Treasury) and TLT (20+ Treasury)


The markets are on pins and needles right now; we're literally waiting for the next show to drop. Today's Citi announcement was a big issue because it indicates we're still nowhere near done with hearing about problems in the financial sector. Also remember -- we're just at the beginning of the earnings season. More announcements like this shouldn't be surprising to anyone right now.

I should also note that while I was expecting a move up in the market, I'm having less confidence in that analysis right now. Today's news was very bearish and makes me wonder what kind of news we'll be hearing over the next month or so.

Read This Now

Calculated Risk has a ton of great information on Citigroup's conference call etc.... Well worth the read. (And I thought I didn't have a life...)

More Thoughts On Foreign Cash Infusions

From Bloomberg:

Citigroup Inc. and Merrill Lynch & Co., two of America's largest financial institutions, turned to outside investors for a second time in two months to replenish capital eroded by subprime mortgage losses.

Citigroup, the biggest U.S. bank, is getting $14.5 billion from investors, including the governments of Singapore and Kuwait, former Chairman Sanford Weill, and Saudi Prince Alwaleed bin Talal, the New York-based company said today in a statement. Merrill, the largest brokerage, said it's receiving $6.6 billion from a group led by Tokyo-based Mizuho Financial Group Inc., the Kuwait Investment Authority and the Korean Investment Corp.

Wall Street banks have now received $59 billion, mostly from investors in the Middle East and Asia, to shore up balance sheets battered by more than $100 billion of writedowns from the declining values of mortgage-related assets. Citigroup was propped up in November by a $7.5 billion investment from the Abu Dhabi Investment Authority. New York-based Merrill was helped by a $5.6 billion cash infusion last month from Singapore's Temasek Holdings Pte. and U.S. fund manager Davis Selected Advisors LP.

``The only reason the banks are raising capital from the Middle East and Asia is because those are the only people who have the excess capital to lend,'' said Jon Fisher, who helps oversee $22 billion at Minneapolis-based Fifth Third Asset Management, which holds shares of Citigroup and Merrill.


Let's start with a basic point. US financial firms are in trouble. Estimates regarding the total amount necessary writedowns related to the housing/sub-prime mess range from $300 - $500 billion. Assuming those numbers are accurate, we have at least another $200 billion or so in writedowns to go.

In addition, financial firms aren't in a position where they can "get it over with" quickly by announcing one massive writeoff. If they did that, they would seriously erode their capital base, thus preventing them from making loans. In other words, because of the way banks work (namely the fractional reserve system) they are prevented from getting all of this over with quickly. Therefore, we are by default forced to endure a "slow bleed) methodology to deal with this mess.

What we have seen emerge is an announcement of a writedown plus an announcement of a capital infusion,, probably as a way to (hopefully) take the sting out of the announcement. (Of course, Citigroup is down 6.88% as of this writing so that really isn't going that well).

This article raises some really interesting points.

1.) There is already a ton of cash invested here. $59 billion is a lot of money.

2.) There are some countries out there with a ton of cash to invest. The oil countries and Asia (which is benefiting from currency manipulation). They are looking for a place to invest this money and have found some targets.

Something I am very surprised about is the lack of any political stances from either party during a presidential election. I would think this type of activity would be a political lightning rod right now.

Alan, For the Love of God, Please, Please Shut Up

From the WSJ:

The U.S. is probably in or about to enter a recession, former Federal Reserve Chairman Alan Greenspan said.

The odds are "not overwhelming but they are marginally in that direction" of recession, Mr. Greenspan said in an interview with The Wall Street Journal.

"The symptoms are clearly there. Recessions don't happen smoothly. They are usually signaled by a discontinuity in the market place, and the data of recent weeks could very well be characterized in that manner," he said.


And you helped to get us here, Mr. "Throw money at any financial problem that comes down the pike."

Remember these interest rates, Alan?


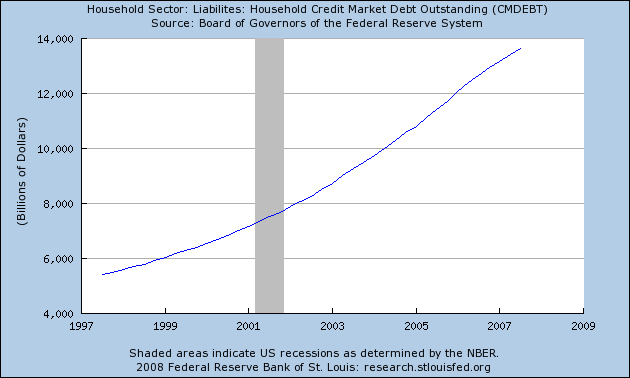
That's the Fed Funds rate. When you lower it to 0% after adjusting for inflation, you encourage people to borrow. And that's exactly what happened:


All of that household debt -- which is now larger than the entire US GDP -- has to go somewhere. But most importantly, it assumes a certain underlying asset value. Well, right now Alan, that asset value is decreasing. Have you seen the Case Schiller Home Price index lately?


Home prices spiked thanks to easy credit. But of course, the Federal Reserve was absolutely helpless for the entire process. It's not their fault that people borrowed recklessly (even though the Federal Reserve was well aware of lenders stupidity regarding loan policy and the Fed did nothing to stop it) or that asset prices spiked thanks to record low interest rates (but the Fed can't do anything about asset bubbles).

Alan, please, for the love of God, shut up.

Or -- will the financial press please start calling him on his part in this mess rather than viewing him as some sage?

End rant -- for now.

"Recession" in Auto Industry

From the WSJ:

Several auto-industry executives are signaling increasing pessimism over what is already expected to be a weak year for car and truck sales, with some suggesting economic difficulties could be affecting upscale consumers more than expected.

"We already have a depression in the housing industry and a recession in the auto industry," said Michael J. Jackson, chairman and chief executive of AutoNation Inc., at an interview at the North American International Auto Show here.


Just what we need to hear right now.

Sovereign Wealth Funds -- The New LBO?

In the first have to 2007, LBOs provided a strong upward lift to stocks. As soon as an LBO was announced in one area of the market, the rest of the sector would rally in anticipation of further deals. As soon as the credit crunch started LBOs ground to a halt and have yet to come back. But, have sovereign wealth funds replaced them?

Last year felt like a bear market. We made three-quarters of our performance on the short side. If you were short credit you did well, and if you were long credit you did badly. If you were in RIM, Apple and Google it didn't feel like a bear market. This year, because investor-sentiment figures are so bearish, the stock market probably won't do much again, but on balance will end higher. We will make more money on our longs than our shorts.

Also, whereas leveraged buyouts provided a lot of support for stocks in early 2007, sovereign wealth funds could do the same in '08. Last year these funds invested about $60 billion in the U.S., mostly in financial companies. After all, money is a worldwide commodity. This year such liquidity will provide support to industrial companies. I am optimistic for the year, although the first half will be tough.


Consider the fact that numerous writedowns in the financial sector have been accompanied with news of capital injections from foreign investment pools. Consider today's news from Citigroup:

Citigroup Inc. posted a huge fourth-quarter net loss, hit by $17.4 billion in subprime-related write-downs.

The bank announced plans to sell another $14.5 billion in preferred stock and said it will cut its dividend 41%. The company also plans to sell non-core assets

.....

A new round of investments announced Tuesday includes $12.5 billion of preferred securities. The Government of Singapore Investment Corp., or GIC, will buy $6.88 billion, which follows the government fund's plan to invest $9.6 billion in Switzerland's UBS AG. Other investors include former Chairman and Chief Executive Sandy Weill and Prince Alwaleed bin Talal bin Abdulaziz Alsaud, already one of Citi's biggest investors.


Will these funds eventually pour so much money into the financial sector that they stem the bleeding and slow the sectors fall? While that hasn't happened yet it may be possible further down the road.

Monday, January 14, 2008

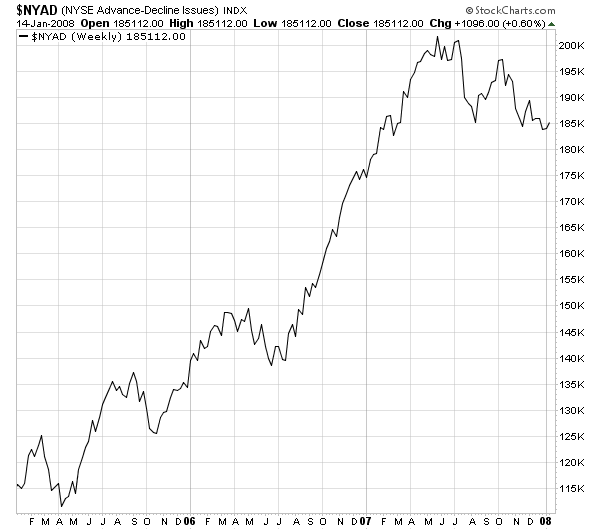
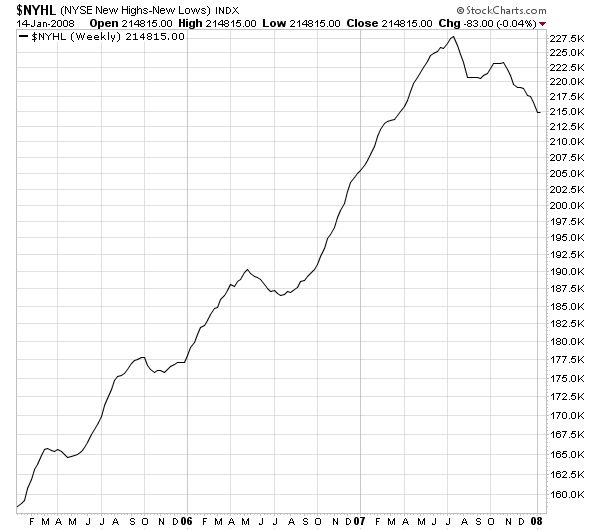
Market Breadth Stinks

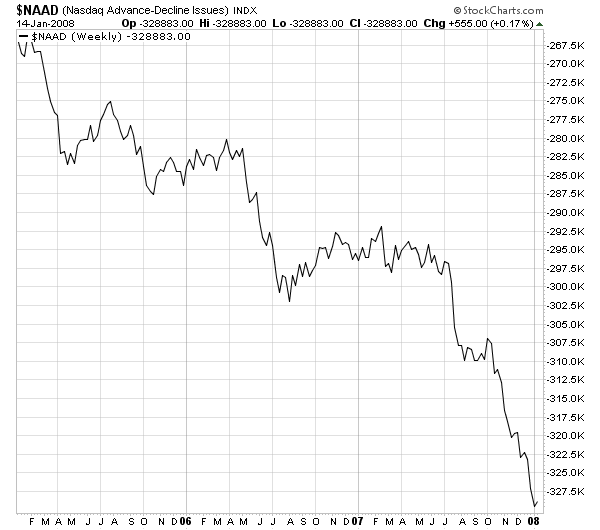
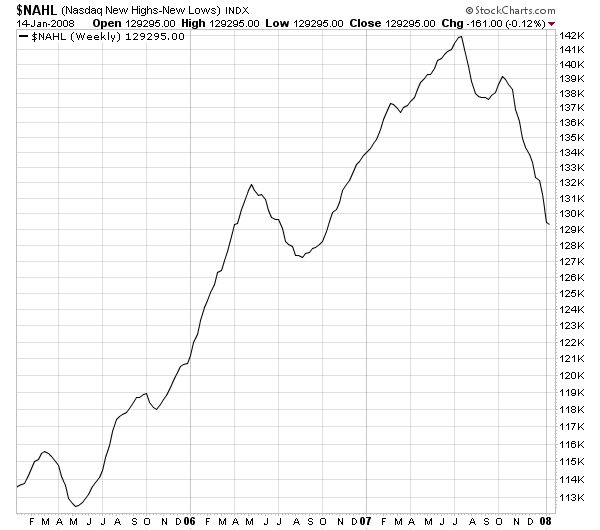
There are four market breadth charts from stockcharts.com. Only one is decent and that is the NY advance decline chart.


The rest are declining

The New York New High/New Low


The NASDAQ Advance Decline Line, well, sucks.


The and NASDAQ New High/New Low is also dropping

Today's Markets

ZZZZZZZZ -- oh -- hey -- boring day. The daily 5-minute charts aren't that important compared to the daily chart. Notice that all the major averages are still in a consolidation pattern.


Now -- on to where we are in the big picture. I think the market is already in a correction. Here are the daily charts that show a clear up, down, up pattern.


What's interesting about this theory is what the upward catalyst would be. Right now I can think of two.

1.) A weak PPI/CPI report which would imply the Fed has more maneuvering room than previously thought regarding interest rates.

2.) A stronger showing than expected from a larger number of companies regarding their 4th quarter earnings.

Treasury Market Update

The Treasury market is in a really interesting place right now. First, let's review what moves the treasury market.

1.) Inflation expectations. Higher inflation decreases the value of a fixed income stream and lower inflation increases the value of a fixed income stream. So if investors expect higher inflation they should sell treasuries.

2.) Interest rate policy: If the Fed is lowering interest rates than bonds issued before the rate reduction at a higher interest rate become more valuable. The inverse is also true.

3.) Flight to quality: in uncertain times investors seek the safety of US government debt.

4.) Overall interest rates on the bonds. Remember that prices are constrained on the upside by the interest rate of a particular bond. Although a bond can theoretically go to 0% interest, that would only really occur in a very limited set of circumstances.

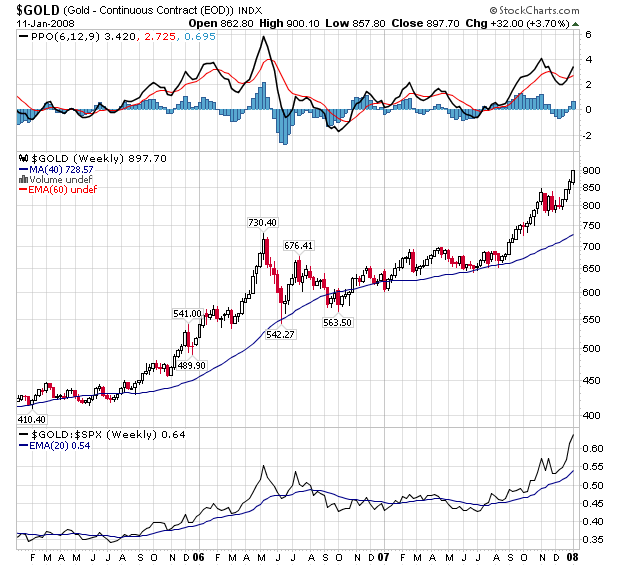
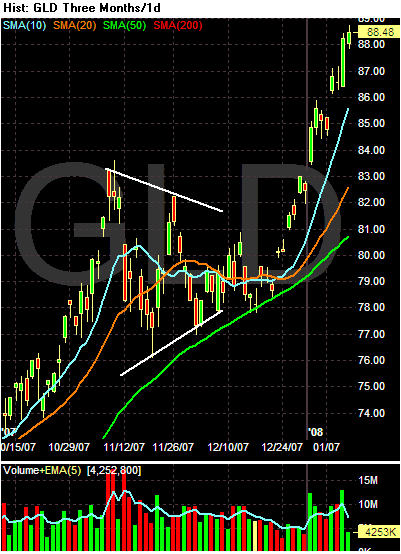
Remember that gold is spiking right now, indicating inflation expectations are pretty high:


Yet Treasuries are still in a rally. Here is a chart of the 7-10 year Treasury ETF:


That means the "flight to safety" trade is probably dominating.

The same holds for the 20+ year Treasury market:


I bring this up because tomorrow we get PPI and Wednesday we get CPI. Will the news be bad enough to to start a sell-off in the Treasury market?

More Evidence the Feds Are Behind the B of A/Countrywide Deal

From the WSJ:

According to court documents in a bankruptcy case in Houston, Countrywide didn't properly credit a borrower's payments made during bankruptcy but instead applied them to prebankruptcy debt, which isn't allowed. In the same case, involving a debtor named William Allen Parsley, Countrywide represented to the court that Mr. Parsley owed fees that turned out to be unsubstantiated and in error. These included an improper $450 fee and a $65 unsubstantiated fee.

.....

In Miami, Bankruptcy Judge A. Jay Cristol last month approved a U.S. trustee's requests to subpoena and depose Countrywide to obtain information about how it made mistakes in a case. Initially, the company claimed in court that the borrower would need to pay $4,800 a month for a mortgage during bankruptcy. But after the borrower objected, Countrywide said it had erred and reduced its claim to about $2,400 a month. In a hearing in December, Judge Cristol said Countrywide had been found "with its hand in the cookie jar."

Countrywide has said it was investigating what happened in the case.

Bankruptcy litigation is among a list of potential legal liabilities Bank of America may inherit from the company if the planned acquisition, announced last week, is completed. These include inquiries from the Securities and Exchange Commission and several state attorneys general, as well as shareholder lawsuits tied to Countrywide's financial decline and other class-action and individual suits brought by borrowers for alleged abuses by the company. In some cases Countrywide has denied allegations and in some it hasn't yet answered allegations; in others it has said it is cooperating with authorities.

Last week, Bank of America's chief executive, Kenneth D. Lewis, said his company had taken into consideration lawsuits and "the negative publicity that Countrywide had" in concluding that ultimately the purchase would be a good deal for shareholders. A Bank of America spokesman said yesterday the company "evaluated current and potential claims against Countrywide and that's reflected in the purchase price we agreed to pay."


There have been several other stories in the financial press about Countrywide's "lax" lending plans. Countrywide is a lawsuit waiting to happen and Bank of America is buying the company? And the CEO says they have performed due diligence on the potential problems? Bullshit. No one buys a walking lawsuit which Countrywide is. Potential suitors would walk away from this deal in a new Yorkk Minute. No company would walk face first into this kind of legal meat grinder unless 1.) they were getting something really good (which B of A isn't) or, they were forced.

Sunday, January 13, 2008

Is a Bear Market Forming?, pt. III

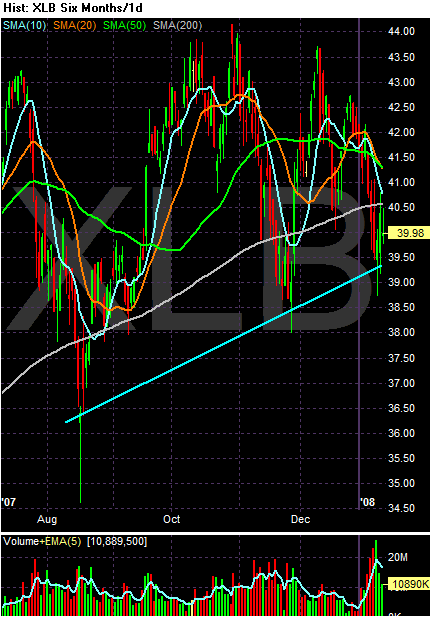
The new year has not been kind to the markets. All of the major averages are down. However, beneath the numbers another bearish trend is developing. Two more sectors of the S&P 500 have now fallen below their respective 200 day simple moving averages, which does not bode well.

Let's start off with the good news.


Although the basic materials sector is below its 200 day SMA, I wouldn't put this is the "raising concern" category. First, the ETF has been here before -- twice since last August. Secondly, if you look at the last 6 months of price action, it looks more as though prices are consolidating in a range rather than falling. Third, China and India are still expanding at a strong clip which should keep demand high.


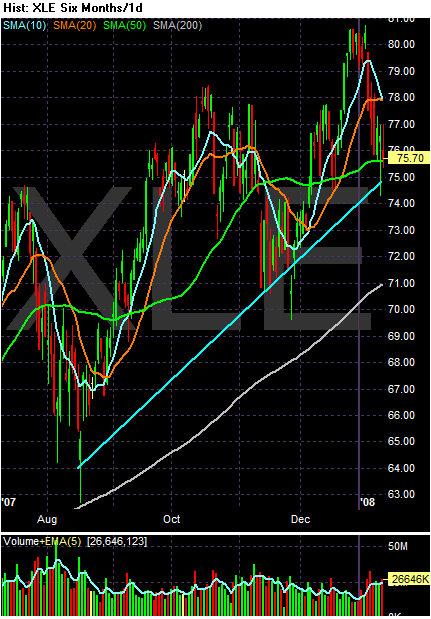
Energy is still in an uptrend. It is above its 200 day SMA and has a clear support trend line. In addition, oil is still in a bull market and the world's energy needs won't go away anytime soon.


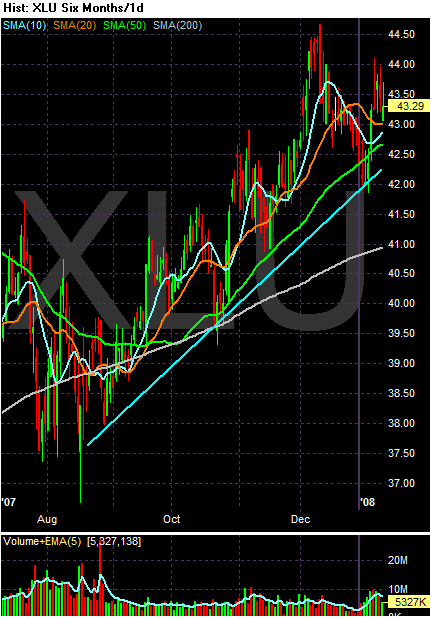
Utilities are still in an uptrend as well. They have a clear uptrend in place, are above their 200 day SMA and are overall advancing nicely. This sector also benefits from a "flight to safety" trend in the markets.


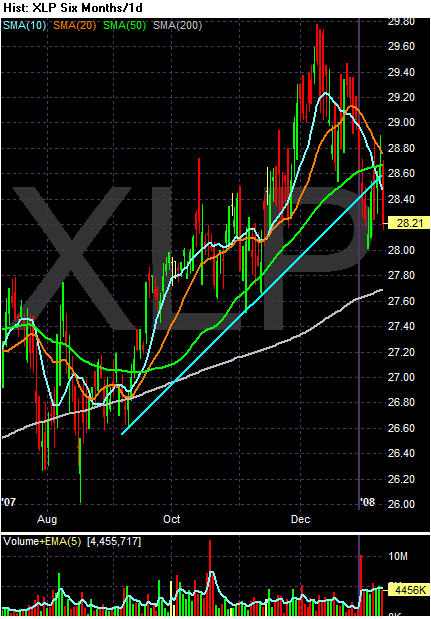
Although consumer staples are dipped below their trend line they are still above their 200 day SMA. While this sector will probably be a bit shakier than the utilities, I don't anticipate a major sell-off; these are generally lower beta stocks.


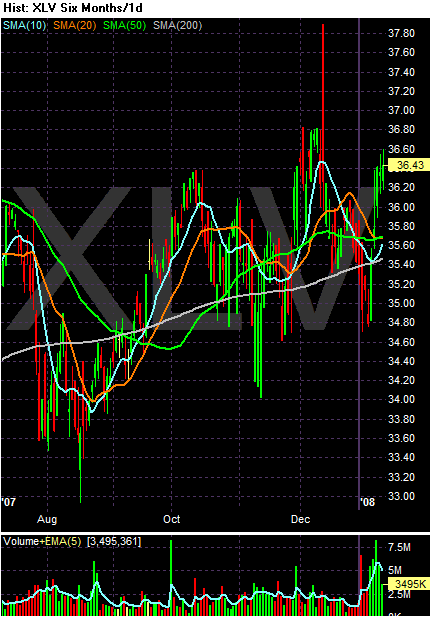
Health care continues to trade around its 200 day SMA. Again, this is a lower beta area of the market that probably won't see major selling. People continue to get sick in a recession.

So, we have five areas of the market that are doing well -- or at least aren't hurting horribly. However


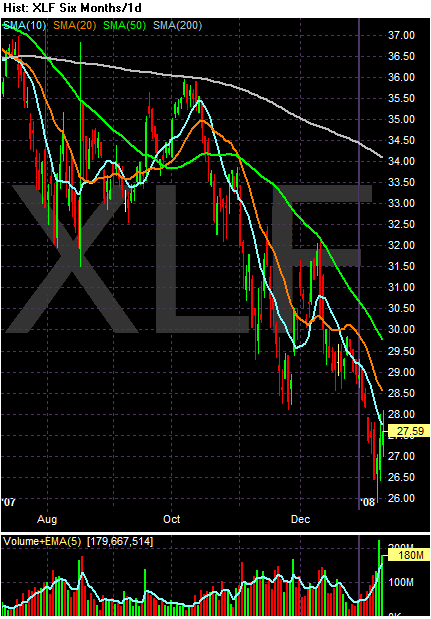
The financials are still a wreck. As the writedowns continue expect this trend to continue.


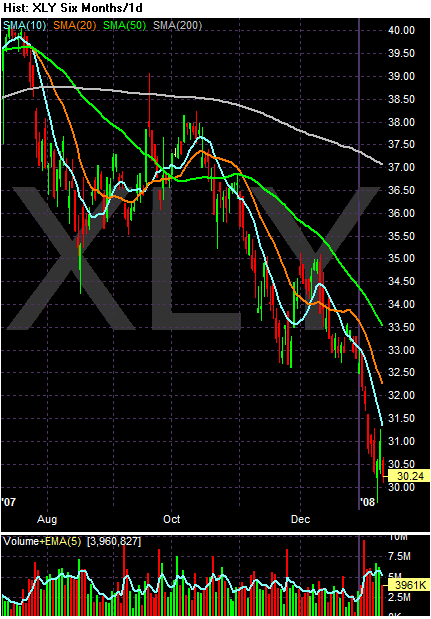
Consumer discretionary also continues to be very weak. Like the financials, this is a very bearish chart. Notice prices are below all the SMAs, the shorter SMAs are below the longer SMAs, all the SMAs are headed lower and prices are below the 200 day SMA. It doesn't get any more bearish than that.

Now we have two more sectors that are looking much weaker.


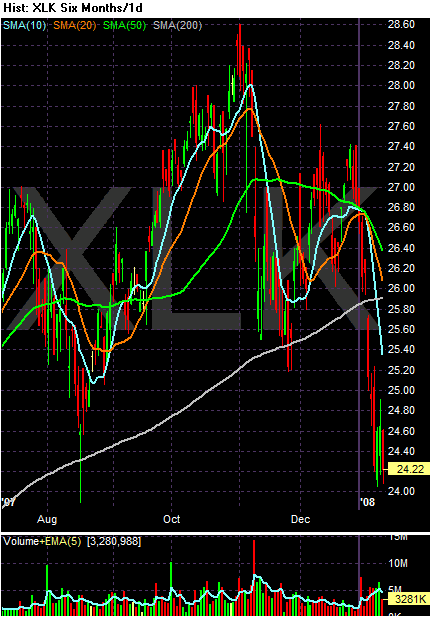
Technology -- which was supposed to save the market -- has dropped hard since the beginning of the year on heavy selling. It is now below its 200 day SMA. This is not a good sign.


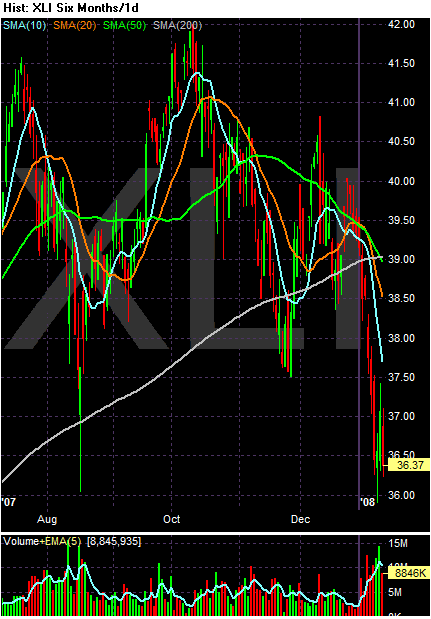
Industrials have also sold off hard on heavy volume since the beginning of the year. They are also below the9r 200 day SMA. Next week's news from the Empire and Philly area manufacturing districts could pose further problems. In addition, this area of the market has benefited from the increase in exports the US is experiencing. For this sector to be performing poorly in the face of that news should raise some eyebrows.

So -- two more areas are now in technical bear market territory. That is not a good development.

The Week Ahead

Next week will be very interesting.

1.) We get inflation data on Tuesday and Wednesday. The Fed has already stated it will be more prone to lower rates right now, arguing the threats to growth outweigh inflationary threats. That means a poor reading on either of these numbers could send treasuries lower.

2.) Earnings season starts. Expect some wild swings.

3.) We get the Empire State and Philly survey along with industrial production.

4.) Housing starts come out on Thursday. Housing news has been uniformly bad for the last few months, so I wouldn't expect much in the way of good news here either.

5.) The markets are clearly in a correction pattern of lower lows and lower highs. In addition, the markets Consolidated last week at the low end of a pattern. Don't be surprised to see strong moves in either directions.

Saturday, January 12, 2008

Last Week's Market Action

Although the ride seemed pretty wild last week, pulling back it seems much more logical. Simply put, the markets consolidated.


All three charts show a clear triangle/rectangle consolidation.

However, let's add one complicating factor.


Money is clearly moving into conservative areas of the market. That means traders are getting more and more concerned about the underlying economic fundamentals.

Finally, here is a link to a piece I wrote on Thursday about my theory of the market. Basically, the market is already in a correction and is in the middle of a lower low/lower high move.

Friday, January 11, 2008

Weekend Weimar and Beagle

The markets are almost closed. So -- it's time to stop thinking about them or the economy. Do anything but that.

So, here are some pictures of my and the future Mr$. Bonddad's four legged kids.

This is Kate in a very comfortable position.


This is Scooby playing with one of her favorite toys


And this is Sarge, relaxing

What Inflation?

From CBS:

Gold futures topped $900 an ounce for the first time ever on Friday on speculation that the Federal Reserve will further cut its key interest rates, weakening the value of the dollar and increasing the appeal of gold as an investment haven.

Gold for February delivery gained $6.5 to 900.1 an ounce in mid-morning trading on the New York Mercantile Exchange. It was last up $5.4, or 0.6%, at $899. Gold closed Thursday's trading at a record closing level of $893.6 an ounce.

In a speech to a business group in Washington, Fed Chairman Ben Bernanke said "In light of recent changes in the outlook for and the risks to growth, additional policy easing may be necessary," Read text of Bernanke's remarks.

........

The dollar index, which tracks the value of the greenback against a basket of other major currencies, earlier dropped to 75.785, the lowest in one week. It was last up slightly at 75.975.


But remember -- there is no concern about inflation, despite Gold's chart.


Note the following:

-- There have been five upward gaps since mid-December

-- Prices are higher than all the simple moving averages (SMAs)

-- The shorter SMAs are higher than the longer SMAs

-- Prices have clearly broken out from their triangle consolidation of November/December

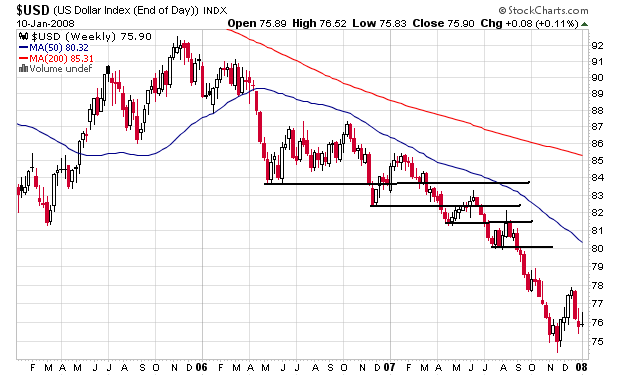
And the dollar is still in a multi-year downtrend.


Note the following:

-- Prices are below all the SMAs

-- The shorter SMAs are lower than the longer SMAs

-- Prices are below the 200 day SMA

-- There is a clear, multi0year pattern of lower lows and lower highs.

Expect both of these trends -- higher gold and a lower dollar -- to continue is the Fed continues cutting interest rates.