Friday, April 27, 2007

Gasoline Supply May be Very Tight This Summer

From CNBC

Phil Flynn, a member of Alaron Trading, told CNBC’s “Squawk Box” that the U.S. may face tight gasoline supplies this summer.

“(Production numbers) better change soon,” Flynn said Friday. “Otherwise, we’re going to have big problems in this country. I don’t know how we’re going to get gasoline supplies where they need to be by Memorial Day. We need to be at 210 million barrels in just a few weeks. We’re at 194 million.”


Here's a chart of US gasoline supplies. The red line -- the line that is heading down in a big way -- is the current inventory level.

Photo Sharing and Video Hosting at Photobucket

This means that gas prices could again be a problem this summer.

Last summer we had $3.00/gallon prices and above with little painful effect on the overall economy. However, we've now had 4 quarters of slow economic growth, and a year of bad housing news. This summer $3.00/gallon may be an inflection point hitting consumer spending negatively.

As with most things economic, we'll have to see how this one plays out.

Advance Estimate GDP = +1.3%; Price Deflator Increases 4%

From the BEA

Real gross domestic product -- the output of goods and services produced by labor and property located in the United States -- increased at an annual rate of 1.3 percent in the first quarter of 2007, according to advance estimates released by the Bureau of Economic Analysis. In the fourth quarter, real GDP increased 2.5 percent.

The Bureau emphasized that the first-quarter "advance" estimates are based on source data that are incomplete or subject to further revision by the source agency (see the box on page 3). The first-quarter "preliminary" estimates, based on more comprehensive data, will be released on May 31, 2007.

The increase in real GDP in the first quarter primarily reflected positive contributions from personal consumption expenditures (PCE) and state and local government spending that were partly offset by negative contributions from residential fixed investment, private inventory investment, and federal government spending. Imports, which are a subtraction in the calculation of GDP, increased.

The deceleration in real GDP growth in the first quarter primarily reflected a downturn in exports, an upturn in imports, a deceleration in PCE for nondurable goods, and a downturn in federal government spending that were partly offset by a smaller decrease in private inventory investment, an upturn in equipment and software, a smaller decrease in residential fixed investment, and an acceleration in PCE for durable goods.


From Bloomberg:

The U.S. economy grew in the first quarter at the slowest pace in four years, hobbled by the slump in home construction and a bigger trade deficit.

The 1.3 percent annual growth rate was less than forecast and followed a 2.5 percent fourth-quarter pace, the Commerce Department reported today in Washington. A measure of inflation watched by the Federal Reserve rose at a faster pace.

.....

A jump in oil last quarter pushed up prices. The report's price index rose at an annual rate of 4 percent, the most since 1991, compared with 1.7 percent in the fourth quarter.

The Fed's preferred inflation measure, which is tied to consumer spending and strips out food and energy costs, rose at a 2.2 percent annual rate, up from a 1.8 percent fourth-quarter gain. Fed Chairman Ben S. Bernanke is among policy makers that have said a 1 percent to 2 percent increase is preferable.


From CNBC:

Weaker exports and a steady slide in spending on homebuilding helped slow U.S. economic growth to its softest pace in four years during the first quarter, the Commerce Department reported on Friday.

Gross domestic product or GDP, which measures total goods and services output within U.S. borders, increased at a weaker-than-expected 1.3% annual rate in the three months from January through March.

That was a little more than half the fourth quarter's 2.5% rate and well below the 1.8% rate that Wall Street analysts had forecast GDP would expand. The last quarter when growth was weaker was in the first three months of 2003, when GDP expanded at a 1.2% rate.

.....

A price gauge favored by the Federal Reserve - personal consumption expenditures excluding food and energy items - increased at a 2.2% rate in the first quarter, slightly ahead of forecasts for a 2.1% advance. That was up substantially from the fourth quarter's 1.8% rate and is likely to keep Fed policy-makers wary about the potential for a pickup in inflation.


From CBS:

Hit by rising energy prices and a weak housing market, the U.S. economy slowed to 1.3% real annualized growth in the first quarter, the weakest expansion in four years, the Commerce Department estimated Friday.

.....

Led by higher energy costs, the GDP price index increased 4%, the most in 16 years. Meanwhile, core consumer prices - which exclude food and energy costs - increased at a more moderate 2.2% annual pace. In the past year, core prices are up 2.2%, the same year-over-year pace as in the fourth quarter, but above the Fed's 2.0% ceiling.

Consumer prices including food and energy are also up 2.2% in the past year.


Here are the details from the report.

Personal Consumption Expenditures (PCEs): + 3.8%. The big surprise here is the 7.3% in durable goods expenditures. The big reason for the jump was a jump in car and furniture sales.

Gross Private Domestic Investment decreased 6.5%. Residential investment fell 17%, which is to be expected. Nonresidential investment increased 2%, with the subcategory structures increasing 2.2% and software/equipment increasing 1.9%.

Exports decreased 1.2% and imports increased 2.3%.

Government spending (government consumption expenditures) increased .9%. Federal spending decreased 3% and state spending increased 3.3%.

Here's the summary:

This report is terrible. Growth slowed more than forecast and inflation increased more than expected and well beyond the Fed's comfort zone.

The Fed is between a rock and a hard place. They've been there for awhile and they will remain there for the foreseeable future.

Treasury Market Update

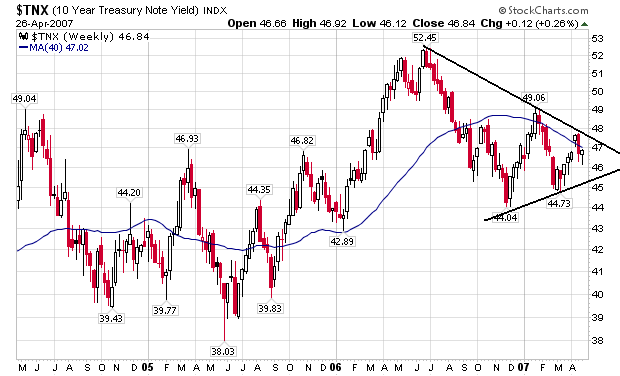
Let's take a look at the weekly 10-year Treasury chart.

Photo Sharing and Video Hosting at Photobucket

There are two trends on this chart.

1.) Since interest rates hit 5.25% in early July 2006, rates have headed lower. Remember that Treasury prices and yields move inversely, so this means traders have been buying treasury bonds. This means there is at least a diminished fear of continued inflationary pressure.

2.) At the same time, there is an upward move in yields that started in November of last year. That means that traders are selling at an interest rate of about 4.4%.

Putting these two trends together and we get a classic consolidation triangle. All this means is there is a tug-of-war going on in the market between bullish and bearish sentiment.

Earnings Are Good, But Beware Comparisons

From IBD:

With more than half of companies reporting so far, analysts are looking at high single-digit year-over-year gains. That would snap the streak of 14 straight quarters of double-digit earnings growth.

But that is a lot better than Wall Street was predicting at the start of earnings season.

With fear of a slowing economy, many firms issued conservative guidance or none at all. Analysts didn't want to go out on a limb.

"People had really ratcheted down their expectations, so it was going to be pretty easy to get over," said Dirk van Dijk of Zacks Investment Research.

Back on April 1, analysts expected S&P 500 companies to deliver first-quarter earnings growth of 3.4%, said Thomson Financial.


Let's talk about expectations management. CEOs -- and all public spokespeople of big companies -- are media savvy. They understand that beating lower expectations will be a positive boost for stock prices. Hence, they will try and lower expectations in the hopes that a positive earnings surprise will increase a stock's value.

Analysts have a different fear, but one that has a similar effect: they don't want to be wrong. Hence, they will tend to be more conservative especially at a time of slowing economic growth.

These two factors are coming together this earnings season.

After all of the smoke clears from this earnings season, we're probably going to wind up where we thought we were going to wind up: High-single digit growth. This is about what we expected.

But the combined effect of conservative or no company estimates and analysts making conservative projections for fear of being wrong has lead to a bit more overall excitement this earnings season than is warranted.

In short -- we're where we pretty much predicted we would be this earnings season -- high single digit earnings growth. We just took a more emotionally charged avenue to get here.

Thursday, April 26, 2007

Weaker Dollar Boosting Earnings

From CNBC:

Of those 19 Dow components--about two-thirds of the Dow--one company, Alcoa, had a negative impact on revenue from currency changes.

Two companies--AT&T and Intel--told us that there was no effect. But 14 companies had a positive impact, ranging from a low of 7% to a high of 51%.

The average company had a 27% positive currency earnings impact.

Revenues from these 19 companies are up $21.5 billion for the quarter. Of that amount, $3.4 billion, or 16% has come from positive currency gains.

So far, revenues are running about $9 billion ahead of analyst estimates. So the currency factor explains about 40% of the surprise.


US companies are benefiting from the same situation that has benefited Asian companies for some time. If the value of a currency is lower, goods sold in that currency are cheaper. Hence, the boost in international earnings.

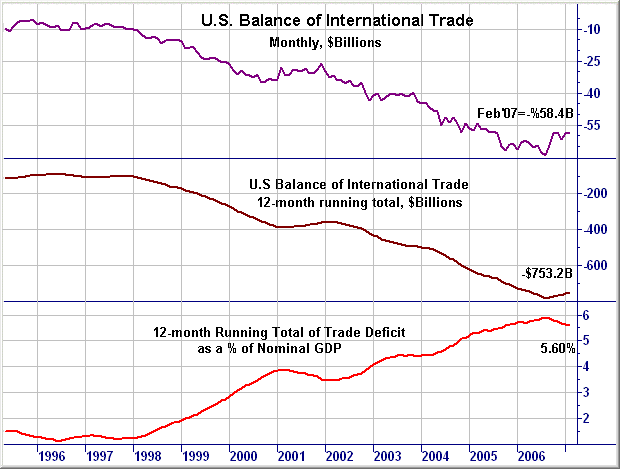
It's going to be interesting to see how this impacts the international trade deficit. This increase in domestic profits from international sales is what is supposed to happen in a free-trading currency trading situation. As the trade deficit increases, the home country's currency is supposed to drop in value which in turn makes its products more competitive internationally. The question now becomes, is the dollar at a point of inflection -- where it's decreased value now has a long-lasting positive impact on the trade balance?

Here's a chart of the deficit form Martin Capital.

Photo Sharing and Video Hosting at Photobucket

Market's Overview

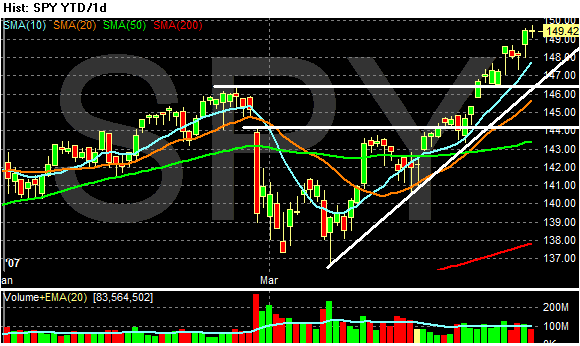
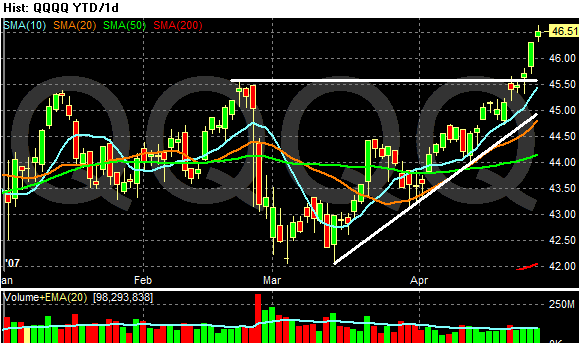
With the markets rallying right now, let's take a look at the overall technical picture of the markets to see exactly what they look like.

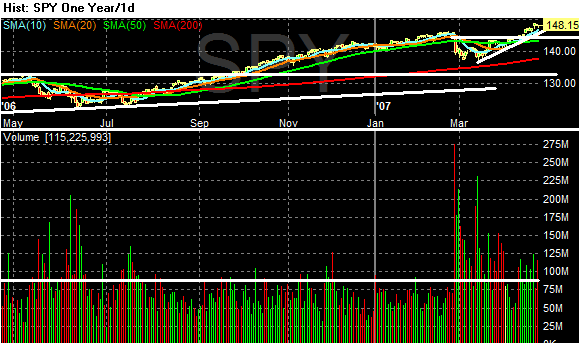
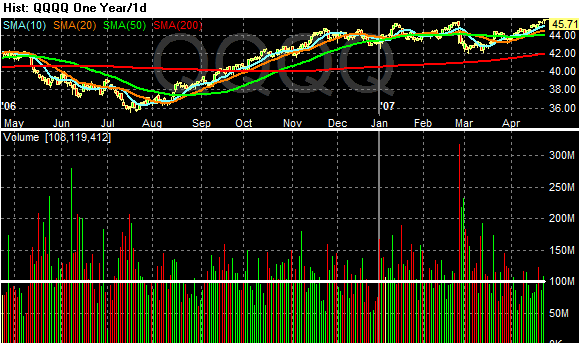
First, here is a chart of the SPYs and QQQQs. Both markets have a very nice uptrend in place. It's not too steep and not too shallow. W.D. Gann -- one of the greatest traders the market has ever seen, hypothesized a 45 degree angle is about right for the markets. These rallies are along that line.

In addition, the 10 and 20 day simple moving averages are trending up and each index is above the SMAs. So long as prices continue up, they will continue to pull the SMAs up. Also note the 10 and 20 day SMAs are above the 50-day SMA, which means the shorter-term averages will pull the longer averages up.

In short, these are bull charts from the daily perspective.

Photo Sharing and Video Hosting at Photobucket

Photo Sharing and Video Hosting at Photobucket

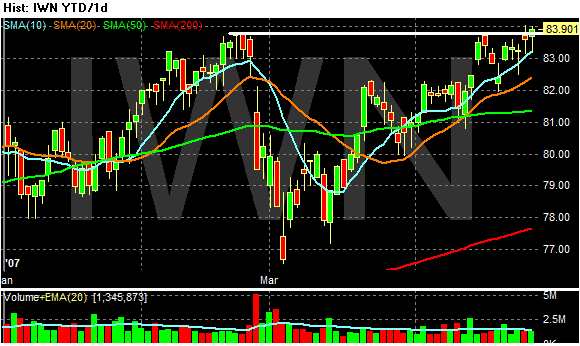
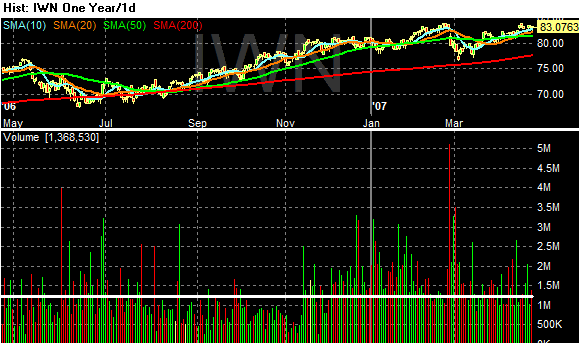
The IWNs are a little different. While they share many of the same bullish characteristics of the SPYs and QQQQs, they differ in one key area. Price wise, they are having a difficult time rising over resistance. Traders are hesitant to take this average higher.

The WSJs market beat blog has done a fair amount of writing on what it calls megacaps -- stocks with very large market capitalizations. These stocks have performed well from an earnings perspective and are considered safer as well. The IWNs difficulty getting over resistance may be a sign of a flight to quality -- traders looking for more secure names.

Photo Sharing and Video Hosting at Photobucket

More Signs of International Strength Helping the US

From today's WSJ:

More than half of General Electric Co.'s revenue is expected to come from outside the U.S. for the first time this year, Chairman Jeffrey Immelt said in an interview before the conglomerate's annual meeting.


Ford's North American automotive operations continued to suffer losses, but other key units, including Ford Europe, posted profits. Notably, the company's Premier Automotive Group posted a record $402 million pretax profit in the quarter.

The North American Automotive unit posted a pretax loss of $614 million, versus a loss of $442 million a year ago. Sales in the division fell $1.6 billion to $18.2 billion. European pretax profit rose to $219 million from $65 million. Sales rose to $8.6 billion from $6.8 billion. First-quarter revenue in Ford's South American operations climbed to $1.3 billion from $1.2 billion, although pretax profit fell to $113 million from $137 million.


This these appears to be becoming far more important to US companies.

Freight Slowdown Hitting Transportation Companies

From the WSJ:

In addition to UPS's profit decline of 14%, railroad operator Norfolk Southern Corp. said its first-quarter profit fell 6.6%, hurt by continued weakness in the automotive and housing sectors. Trucking carrier Arkansas Best Corp., Fort Smith, Ark., saw its profit shrink by 22%, but said a cost-cutting program begun last fall helped it offset weakened freight demand.

The stubbornly persistent freight slowdown that began last year has been particularly tough on trucking companies, which are facing overcapacity and pressure to cut prices because they increased truck purchases before stricter engine-emission standards took effect. Railroad shipments fell nearly 5% in the first quarter, but tight capacity has helped railroad operators maintain their pricing power so far. Norfolk Southern, of Norfolk, Va., said pricing remained strong in the first quarter.


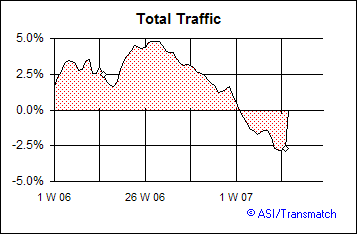
Here's a graph of total rail traffic's year-over-year percent change. It confirms the transportation slowdown:

Photo Sharing and Video Hosting at Photobucket

When people aren't shipping goods, it indicates the economy is slowing. Additionally, businesses are in a difficult position. If they are anticipating a slowing economy they will order a smaller amount of goods. If they order too much, their inventory will rise which will hurt profits. If they order too little they may make the situation worse.

Wednesday, April 25, 2007

It's a Wash

From the Street.com.

"Are stocks going up or is the measuring stick going down?" asks Jeffrey Saut, chief investment strategist at Raymond James. The Dollar Index has lost over 33% since its peak in January 2002, he writes, while the Dow has rallied about 30% in the same period.

More Signs of International Strength Helping the US

From Bloomberg:

Sales in Latin America, where Colgate has almost three- quarters of the toothpaste market, rose 14 percent. Colgate- Palmolive, which also makes Science Diet pet foods and Irish Spring soap, boosted advertising spending 20 percent, helping revenue increase the most in at least nine years.

``The Latin American piece is the growth driver of the company,'' said Christopher Meeker, who helps manage $560 million at Farr Miller & Washington LLC, including Colgate shares.


This type of earnings announcement has been very common this season.

The Beige Book

The Fed released the Beige Book today.

Most parts of the country logged moderate economic growth in the early spring, despite sluggish manufacturing largely due to the housing slump.

The fresh snapshot of the national economy, released Wednesday by the Federal Reserve, found that "manufacturing activity was slow" in many areas and that "residential real estate activity continued to weaken, with sales declining in many districts and flat in a number of others."


Here's a link to the full report.

Here are some relevant bullet points from the report (in italics):

-- Reports on retail sales across the Districts were generally positive, although vehicle sales were mixed in several Districts.

-- Reports on retail sales in most Districts were generally positive.

-- Reports on vehicle sales were mixed among the Districts.

-- Residential real estate activity continued to weaken in many Districts.


These points lead to a question. Just how confident is the consumer? Assuming that buying durable goods indicates confidence, the consumer might not be as confident as it appears. Autos sales are mixes and housing numbers aren't that strong.

-- Manufacturing activity remained slow overall, although reports on conditions in the manufacturing sector varied across Districts.

-- Activity in the services sector increased in most areas throughout the Districts, particularly for firms serving business customer


Business seems to be doing alright, but not great.

-- Most Districts reported continuing tight labor market conditions, especially for skilled occupations, although several Districts reported expansions in employment levels.

-- Wage increases were reported in some industries of the New York, Philadelphia, Richmond, Atlanta, Chicago, Minneapolis, Kansas City, Dallas, and San Francisco Districts. These were generally modest
.

These figures are the key to keeping the economy in positive territory right now. So long as job growth is at least moderate and wage growth over the inflation rate continues, consumers will probably continue to spend.

-- Consumer prices remained generally stable or increased modestly, but most Districts reported a rise in input prices, particularly for metals and raw materials

This could really put the Fed in a bind of the economy continues to slow.

Gas Prices Decrease

From This Week in Petroleum

Gasoline saw a slight decrease for the week of April 23, 2007, falling 0.7 cent to 286.9 cents per gallon. Prices are 4.5 cents per gallon lower than at this time last year. East Coast prices were down 0.4 cent to 283.5 cents per gallon. The Midwest saw prices fall 3.2 cents to 277.5 cents per gallon. Prices for the Gulf Coast dropped 0.8 cent to 275.5 cents per gallon. Rocky Mountain prices increased 4.3 cents to 284.4 cents per gallon, while West Coast prices were up 2.3 cents to 321.8 cents per gallon. The average price for regular grade in California was up 1.1 cents to 331.6 cents per gallon, 24.8 cents per gallon above last year's price.


The good news in this report is the price difference between this year and last year has decreased to 4.5 cents. The bad news is gas inventories are still declining. Here's the chart from the same report:

Photo Sharing and Video Hosting at Photobucket

Refiners aren't leaving any room for error in their production capabilities right now.

Will Construction Employment Lead to Recession?

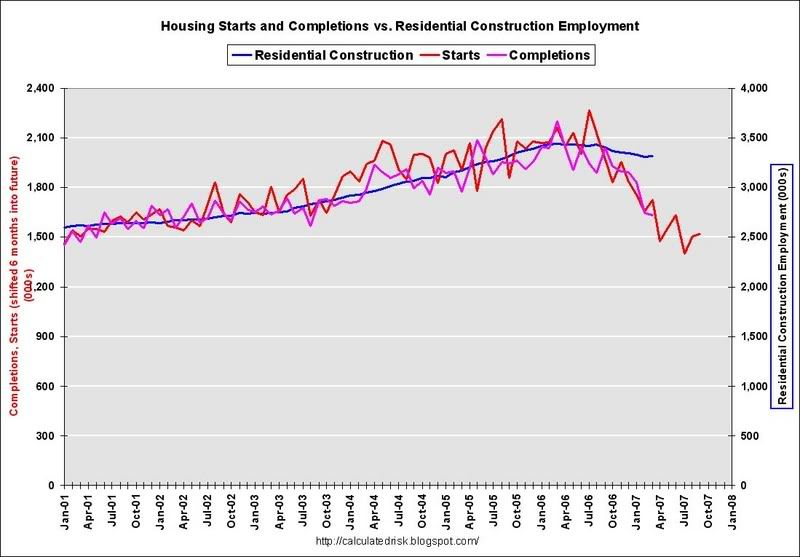
For the last year or so, the blog Calculated risk has been discussing the effect of the housing slowdown on construction employment. His central argument is that as housing slows, construction employment will follow. Here is his explanation of the following graph linking housing and construction employment.

This graph shows starts, completions and residential construction employment. (starts are shifted 6 months into the future). Completions follow starts, and employment usually tracks completions.


Here is the graph:

Photo Sharing and Video Hosting at Photobucket

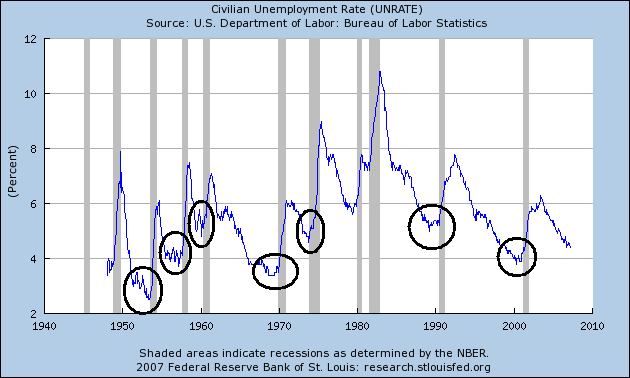
Let's coordinate that information with a chart of total employment and recessions. Notice that right before a recession employment rates are strong. However, also note the employment situation deteriorates rapidly as the recession begins and progresses.

Photo Sharing and Video Hosting at Photobucket

Will construction losses be severe enough to send the economy into recession? I don't know. But these two sets of data indicate we may be finding out soon.

New Home Sales Increase 2.6%

From Marketwatch:

Boosted by warmer weather in the Northeast and Midwest, sales of new homes increased by 2.6% in March to a seasonally adjusted annual rate of 858,000, the Commerce Department reported Wednesday.

Sales of new homes were off 23.5% compared with March 2006.

The inventory of unsold homes rose by 1,000 to 545,000 in March, representing a 7.8-month supply. The inventory is down 1.4% compared with a year earlier, the biggest year-over-year decline ever recorded.

The median sales price rose 6.4% year-over-year to $254,000, as luxury homes continued to increase their market share.


Here's a link to the report from the Census Bureau.

Looking at the numbers, one fact stands out. Sales of homes in the Northeast increased 50% from 48,000 to 72,000. This is the primary reason for the increase. The Midwest also saw an increase from 122,000 to 134,000, or an increase of 9.8%.

It looks as though the increases in the NE and MW were essentially delayed deals that buyers put off until the weather settled down.

Also looking at the numbers we continue to have inventory issues. While the months available for sale number decreased from 8.1 to 7.8, the total number of homes on the market increased 1,000. The year-over-year inventory change was a decrease of 1.4%. This is both good and bad news. It's good because it may indicate the massive inventory build has stopped. It's bad because a years worth of sales have not taken a large number of homes off the market, indicating a glut of new homes for sale may still exist.

I should add that Calculated Risk has an excellent summary up.

Durable Goods Orders Rise

From the Census Bureau:

New orders for manufactured durable goods in March increased $7.1 billion or 3.4 percent to $214.9 billion, the U.S. Census Bureau announced today. This was the fourth increase in the last five months and followed a 2.4 percent February increase. Excluding transportation, new orders increased 1.5 percent. Excluding defense, new orders increased 4.5 percent.


From Bloomberg:

Orders for U.S. durable goods rose more than forecast in March, signaling business spending started to recover as the first quarter ended.

Orders for goods made to last several years increased 3.4 percent after a 2.4 percent gain in February that was larger than previously estimated, the Commerce Department said today in Washington. Orders excluding transportation equipment rose 1.5 percent after a 0.4 percent drop.

``We had been worried that businesses weren't confident enough to invest and this shows better confidence,'' said Adam York, an economist at Wachovia Corp. in Charlotte, North Carolina. ``It's still too early to say manufacturing is completely on the mend, but this is a positive.''


Let's coordinated this data with a few other points.

According to the Federal Reserve's most recent Industrial Production release:

Output in the manufacturing sector moved up 0.7 percent in March; the increase was led by advances in the production of durable goods.


According to the same report, final products of consumer durables orders

1.) The 4th quarter 2005 - 2006 year-over-year comparison was a decrease of 2.5%

2.) The annual rate in the first quarter of 2007 was a 0% increase, and

3.) The March 2006 - March 2007 comparison was down 1.3%.

We also have the following numbers in the business equipment sector:

1.) The 4th quarter 2005 - 2006 year-over-year comparison was an increase of 9.7%

2.) The annual rate in the first quarter of 2007 was a -.5% decrease, and

3.) The March 2006 - March 2007 comparison was an increase of 7.4%.


In addition, we have the following comparisons in the final products of materials durable goods orders:

1.) The 4th quarter 2005 - 2006 year-over-year comparison was an increase of 5.6%%

2.) The annual rate in the first quarter of 2007 was a 2% increase, and

3.) The March 2006 - March 2007 comparison was up 3.6%.

The materials orders are twice the size of the consumers durables -- 19.15% versus 7.16%. The materials orders are twice the size of the consumers durables -- 19.15% versus 9.95%.

At the same time, we have the following chart from Martin Capital:
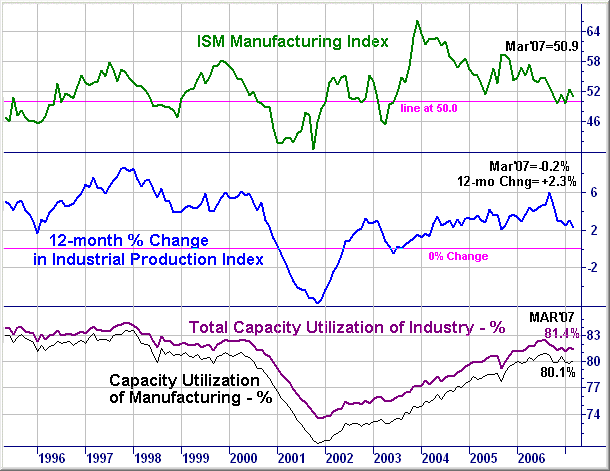
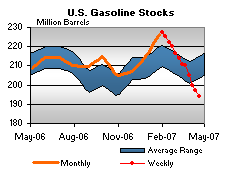
Photo Sharing and Video Hosting at Photobucket

More Signs of International Strength Helping the US

From the WSJ:

PepsiCo Chief Executive Indra Nooyi said the company's international business "performed well on virtually every dimension." "Volume gains in snacks and beverages were broad-based, operating margins expanded and growth was balanced across developed and emerging markets," said Ms. Nooyi. "Our business momentum is strong coming out of the first quarter, which increases our confidence in the full-year outlook."

Revenue at PepsiCo's international division rose to $2.25 billion from $1.89 billion. Its Quaker Foods North America unit saw revenue increase to $463 million from $443 million.


This has been a constant theme this earnings season -- strong international sales.

Pepsi's national sales were also strong, so the international division didn't bail out the domestic. But that's not the point. The point is international sales are strong across a spectrum of companies.

Tuesday, April 24, 2007

More Signs of International Strength Helping the US

Whirlpool's earnings announcement:

Whirlpool Corp. shares jumped as much as 17% to a record high on Tuesday after the appliance giant said last year's Maytag acquisition along with strong international demand boosted first-quarter revenue.

.....

"As expected, higher material costs and significantly lower demand in the U.S. negatively impacted our first-quarter results," said Chairman and CEO Jeff Fettig in a statement. "The global environment is progressing as planned and we continue to expect lower industry demand in the U.S. through the first half of 2007 with gradual improvement during the balance of the year."


From Kimberly Clark's earnings report:

Kimberly-Clark Corp. reported Monday a 64% increase in first-quarter profit, helped by cost cutting and strength in emerging markets, and affirmed its financial forecast for the year.

...

In Europe, personal-care sales rose more than 12%, with currency effects accounting for the entire increase. Sales volumes were up 1%, as strong gains for diapers were mostly offset by lower sales volumes in other areas. Net selling prices were down about 1%.

Huggies Newborn and Natural Fit diapers and Huggies Little Walkers diaper pants drove a 9% volume growth for Huggies diapers in core European markets of the U.K., France, Italy and Spain. In developing and emerging markets, personal-care sales climbed about 16%.

Sales growth was particularly strong across Latin America, as well as in China and Russia, the company said.


These results indicate that foreign sales may help to cushion corporate profits as the US economy slows.

Volume Issue?

There's been a fair amount of talk about "decreasing volume" in the market. I don't see that as the problem with the SPYs and IWNs. I do see it possibly with the QQQQs. Here are the charts of the SPY, QQQQ and IWN with an exaggerated volume display. The horizontal line is a simple eyeballing of the recent rally's volume level with other volume levels.

I think what some people are missing is the China sell-off distorted volume readings in the market. Take a look for yourself.

Photo Sharing and Video Hosting at Photobucket

Photo Sharing and Video Hosting at Photobucket

Photo Sharing and Video Hosting at Photobucket

I should add that I see plenty of other problems in the market -- namely that the economic preconditions to a solid rally aren't there. But it doesn't look like volume is an issue at this point.

Violence In Another Country's Oil Fields

From Bloomberg:

The Ogaden National Liberation Front, a rebel group demanding an independent state within Ethiopia, claimed responsibility for an attack on a Chinese-run oil field that left 74 people dead, the African nation said.

``The attack has killed 74 people and seven more workers have been kidnapped'' from the field near the town of Abole, which lies in the east of Ethiopia near the border with Somalia, Bereket Simon, an aide to Ethiopian President Meles Zenawi, said in an interview from Addis Ababa today.

Nine Chinese workers were killed and seven kidnapped, he said. The field is run by Zhongyuan Petroleum Exploration Bureau, the Associated Press reported.


Just what the oil market needs -- another geographic area with violence and oil.

Flight to Quality Underway, pt. II

From the MarketBeat Blog of the WSJ:

But in all of 2007 so far, the biggest contributors to the S&P 500’s rally include just one company with a $150 billion market cap or more, AT&T. The megacap advances in April suggest a flight to safety — investors more willing to bet on global conglomerates — while the lack of broader market gains suggests investors are worried about economic growth. Breadth has been negative on four of the past five trading days; only Friday’s massive rally helped more stocks finish higher than lower on the day on the Big Board.

......


As noted in earlier posts, outperformance of late has been concentrated in megacap stocks. The exchange-traded fund tracking the S&P 100 has outdone those tracking the S&P Mid-Cap 400 and Small-Cap 600, as well as the Russell Microcap index. The largest-cap stocks trail small- and mid-cap names on the year, but have rocketed ahead in the last month, gaining 4.75% compared with the 3.7% in both the Midcap ETF and iShares SmallCap ETF. It may not persist, but it does point to both a flight to safety and indication that those companies have the ability to offset dollar weakness with overseas sales.


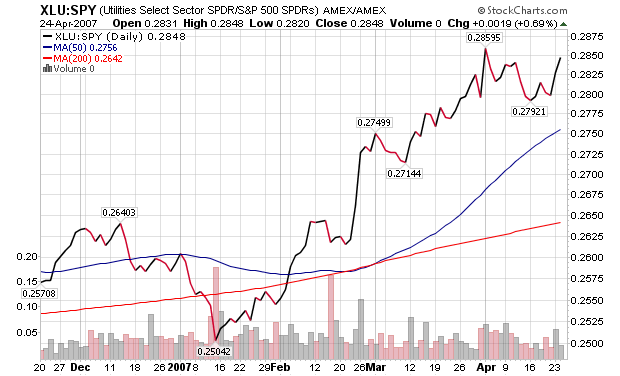
Take a look at this chart, which is a comparison of the utilities ETF versus the S&P 500 ETF.

Photo Sharing and Video Hosting at Photobucket

Utilities are clearly moving up in relation to the broader indexes, indicating investors are looking for quality and safety right now.