Showing posts with label UK. Show all posts

Thursday, September 26, 2013

UK Economy Continues To Look Promising

From the minutes of the latest Central Bank Meeting:

The estimate of GDP growth in the second quarter had been revised up a little to 0.7% in the second release. The initial estimates of the expenditure breakdown had suggested that growth had been fairly broadly based, with investment and export growth both a little stronger than the Committee had anticipated. Such initial estimates for the expenditure components were, however, highly uncertain. There were other reasons for caution. For instance, the strength of exports was concentrated in a couple of subsectors and appeared erratically strong by comparison with the growth of world trade volumes during Q2; and the large positive contribution to growth from stockbuilding would probably prove transient, especially if it were simply a bounceback from the temporary de-stocking observed in the first quarter.

Nevertheless, that modestly promising data release had been augmented by the continuing strengthening of the indicators of consumer spending in 2013 Q3 and further strong business surveys in August. The Markit/CIPS services activity index was broadly unchanged in August, after having increased sharply in July, and the manufacturing and construction indices had strengthened further. Consequently, the composite PMI was at its highest level since 1997. The CBI service sector survey had also strengthened in August. Overall, Bank staff estimated that the initial estimate of output growth in the third quarter would be around 0.7%, compared with the 0.5% expected at the time of the August Inflation Report. Moreover, the early indicators for activity in Q4 tentatively suggested further strengthening towards the end of the year. Overall, these data provided further evidence in support of the pickup in growth assumed at the time of the August Inflation Report and, if anything, posed an upside risk to that path.

Since the spring, and after several years of stasis, activity in the housing market had been picking up and, on the basis of recent indicators, gaining momentum. Although still well below pre-crisis norms, monthly mortgage approvals had increased by almost a third over the past year. And, according to the average of the main lenders’ indices, nominal house prices in July stood around 4% higher than a year earlier and so had begun rising in real terms for the first time since mid-2010. In a confidential preview of the survey, the RICS current house price balance had risen to a level last seen at the end of 2009. There had also been signs of an easing in conditions in the commercial property market.


Let's look at the major macro-level data to elaborate on the above.

GDP annual growth rate appeared to be stalling 1-3 quarters ago, printing at the 0$ and .1% level.  But the latest reading has the annual growth rate at 1.5%.

The inflation rate has been consistently printing in the 2.5%-2.8% range for the last year.

Like the US, the UK has had a stubbornly high unemployment rate, coming in at 7.7%+ for the last year.

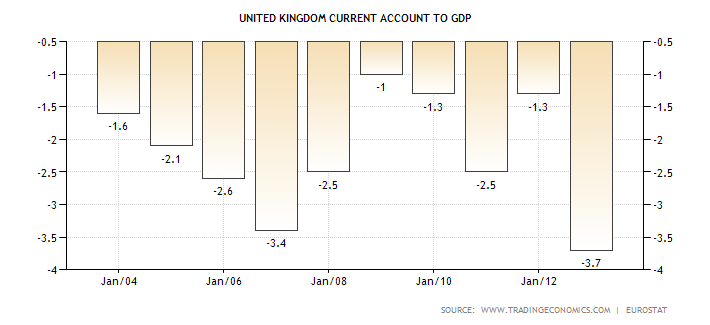
While there current account gap is negative, the UK prints their own currency, making this a problem the country can deal with.

The government budget deficit has been decreasing as well.

Let's see how this is translating in the relevant market action.


The pound has been rallying since the beginning of July, finally rising about the 200 day EMA in early September.  The shorter EMAs are now above the 200 day EMA as well.


The UK ETF broke through resistance in the lower 19 area in early September as well.  Prices have fallen back a bit since then, but that's to be expected after a strong move higher.


Wednesday, September 11, 2013

The UK Is Printing Strong Economic Numbers

The numbers coming out of the UK over the last few months have been very impressive.  First, consider the Markit Services index:

August’s survey of UK service providers signalled continued strong growth of activity and new business. Activity rose at the sharpest pace since December 2006, while growth in new work was the best seen since May 1997.
 

Capacity continued to be tested, with backlogs of work rising at the sharpest pace for over 13 years. However, employment broadly stagnated, in part due to an inability of service providers to replace leavers.
 

The headline seasonally adjusted Business Activity Index registered 60.5 in August. Improving on July’s 60.2, the latest reading was the highest in over six-and-a-half years. Over a quarter of the survey panel registered an increase in activity.

Here is the accompanying chart:


The latest print is above all readings from the recovery.

Construction is also in very good shape:

August data indicated another strong improvement in the overall performance of the UK construction sector, as highlighted by steep and accelerated expansions of both output and new business volumes. Construction companies also remain confident about the year-ahead outlook for business activity at their units, with around 46% of survey respondents expecting a rise and only 10% a reduction.
 

Adjusted for seasonal influences, the headline Markit/CIPS UK Construction Purchasing Managers’ Index® (PMI®) registered 59.1 in August up from 57.0 in July and above the neutral 50.0 value for the fourth consecutive month. The latest reading indicated a sharp rise in total business activity and the fastest pace of output expansion in the construction sector since September 2007.

Here's the accompanying data:


Again, this is the strongest print of the recovery.

And manufacturing is also printing at strong levels:

Latest data indicated that the UK manufacturing sector maintained its robust start to the third quarter of 2013. After the solid increases in output and new orders registered in July, August saw the momentum continue to build, with growth rates for both variables at their highest since 1994. However, cost inflationary pressures surged higher on the back of rising raw material prices.
 

The seasonally adjusted Markit/CIPS Purchasing Manager’s Index® (PMI®) hit a two-and-a-half year high of 57.2 in August, up from a revised reading of 54.8 
in July (previously reported as 54.6). The PMI has signalled expansion for five successive months.

Here's a chart of the manufacturing data:

The manufacturing number is rising strongly.

While all the usual caveats apply, these numbers all point to higher growth in the next few quarters.

Let's take a look at the UK ETF:


The UK ETF is a buy right now.  Not only are the economic fundamentals positive, the the ETF is in a bullish posture.  Prices broke through the lower 19 level on a strong volume spike.  This was accompanied by risking volume.  All the EMAs are rising -- including the long-term trend (the 200 day EMA).  In addition, the MACD and CMF show increasing upward momentum and rising volume inflow.


Friday, July 12, 2013

Market/Economic Analysis: UK

Recent news from the UK has been very encouraging, starting with the latest Markit Services report:

UK service sector growth accelerated to its highest level since March 2011 during June as incoming new business rose at a rate unmatched for six years. The sharp increase in new business led to a marked rise in backlogs of work, and encouraged companies to take on additional staff to the strongest degree since August 2007.

Confidence regarding future activity was also retained, with expectations at their highest for 14 months. However, margins remained under some pressure as strong competition prevented companies from fully passing on higher cost burdens.
 

After accounting for seasonal factors, the headline Business Activity Index recorded 56.9 in June, up from May’s 54.9 and the highest reading for 27 months. Growth has now been recorded for six successive survey periods, and has continually improved throughout this sequence.

Here is the accompanying chart:

Since bottoming at the end of last year, the index has been in a strong uptrend.

UK manufacturing is also in positive territotory:

The UK manufacturing sector maintained its solid second quarter performance into June, with levels of production and new business rising at the fastest rates since April 2011 and February 2011 respectively. Domestic market conditions improved further, while demand from overseas also strengthened.
 

At 52.5 in June, up from a revised reading of 51.5 in May, the seasonally adjusted Markit/CIPS Purchasing Manager’s Index® (PMI®) posted above the neutral mark of 50.0 for the third month running. Moreover, the rate of improvement signalled by the PMI was the steepest for 25 months. The average reading over the second quarter as a whole (51.4) was the highest since Q2 2011.
 

The latest expansion in UK manufacturing production was broad-based, with all of the sub-sectors covered by the survey signalling increases in June. The strongest rates of growth were recorded by the Textiles & Clothing and Food & Drink categories.

The accompanying chart shows this improvement:

Note the strong reading in relation to activity over the last two years; levels are printing at strong levels for the last two years.

And the latest GDP reading was encouraging:

UK gross domestic product (GDP) in volume terms was estimated to have increased by 0.3% between Q4 2012 and Q1 2013, unrevised from the previous publication. In current prices GDP was estimated to have increased by 0.9% for the same period.

However, the Bank of England does not think the economy is out of the woods (nor should they).  Their latest policy statement kept rates at their currently low .5%.  They made the following observations:

Since the May Inflation Report, market interest rates have risen sharply internationally and asset prices have been volatile.  In the United Kingdom, there have been further signs that a recovery is in train, although it remains weak by historical standards and a degree of slack is expected to persist for some time.  Twelve-month CPI inflation rose to 2.7% in May and is set to rise further in the near term.  Further out, inflation should fall back towards the 2% target as external price pressures fade and a revival in productivity growth curbs domestic cost pressures.
At its meeting today, the Committee noted that the incoming data over the past couple of months had been broadly consistent with the central outlook for output growth and inflation contained in the May Report.  The significant upward movement in market interest rates would, however, weigh on that outlook; in the Committee’s view, the implied rise in the expected future path of Bank Rate was not warranted by the recent developments in the domestic economy.
While the latest data is encouraging, it is by no means indicates the economy is out of the woods.  Probably their biggest problem is the international economic environment which is poor: the EU is still in a recession and China is re-balancing its economy.  While the US is growing, it's not growing at a strong rate.

Wednesday, June 12, 2013

Market/Economic Analysis: UK

The UK has one fundamental problem: incredibly weak GDP growth.  Here are two relevant charts:


The top chart shows the overall level of GDP which shows the UK economy's overall level of GDP is still below its pre-recession peak.  The second chart shows the reason for this slow growth: they're had five quarters of Q/Q GDP contraction.

The main culprit has been a continued decline in manufacturing and, as a result, investment:


The top chart shows manufacturing has contracted in 6 of the last 7 quarters while the top chart shows a continual decline in manufacturing.


As a result of manufacturing's decline, there is no need to make capital investments.  Hence we see that gross fixed capital formation has declined in 5 of the last 8 quarters.

However, there are signs that overall activity may be picking up.  The following is from the Bank of England's latest policy minutes:

13 The preliminary release of Q1 GDP had shown a 0.3% increase, all of which had been accounted for by the services sector. In line with the usual pre-release arrangements, the Governor informed the Committee that industrial production had risen by 0.7% in March, on the back of a 1.1% increase in manufacturing output. The level of production in February had been revised down, however.
Nonetheless, the pattern of growth over Q1, together with the increase in the April CIPS/Markit indices, suggested that the level of overall activity at the beginning of the second quarter was likely to have been higher than the Committee had previously anticipated, and Bank staff’s projection for the
preliminary estimate of Q2 growth was 0.5%, although there was a sizable margin of error around such a forecast. Looking further forward in 2013, there was the possibility of a stabilisation in oil production in the North Sea and in the output of the construction sector.


14 Recent indicators of expenditure had been broadly positive. Retail sales had risen on the quarter and, accounting for seasonal factors, there had been a 16% increase in new private car registrations in the three months to April compared with the previous three months. Broad money holdings of the corporate sector had increased by around 10% at an annual rate in Q1, perhaps as a prelude to greater business investment. And, in line with the usual pre-release arrangements, the Governor informed the Committee that both imports and exports of goods had risen strongly in March.


As the GDP chart above shows, consumer spending hasn't been a problem.  It's been positive for the last 6 quarters.  Manufacturing has been the economic stick in the mud.  But that might be changing.  First, is the news from the Markit survey

The UK manufacturing sector continued its positive start to the second quarter of 2013. After returning to growth in April, May saw operating conditions improve at the fastest pace in over a year, with growth of production and new orders both accelerating. The domestic market was the main driver of new order inflows, although new export business also contributed with a modest increase.
 

At 51.3 in May, up from a revised 50.2 in April, the seasonally adjusted Markit/CIPS Purchasing Manager’s Index® (PMI®) posted its highest reading since March 2012 and remained above the neutral 50.0 mark for the second straight month.
 

The expansion of manufacturing output was broad-based in May, with growth registered by the consumer, intermediate and investment goods sectors. The strongest performance was seen at consumer goods producers. UK manufacturers generally linked higher output to improved new order inflows, successful new product launches and efforts to clear backlogs of work.

Here are the charts from the report:


The top chart shows that the overall Markit number has again moved into positive territory.  However, it is the lower chart that shows all three manufacturing sectors -- consumer goods, investment goods and intermediate goods -- are again printing in positive territory.

This is corroborated by the latest UK manufacturing report.  Although the latest numbers show a .2% drop, this followed two months of increases:

Despite the April fall, the figure is stronger than it was at the start of the year and provides an early indication that manufacturing output, which makes up just over 10 per cent of the economy, will lift GDP in the second quarter.
“The fall in manufacturing output does follow large rises in February and March and the underlying position is probably one consistent with some small forward momentum,” said David Tinsley, UK economist at BNP Paribas, a bank.

Let's turn to the UK charts.


Overall, the UK ETF is still in an uptrend.  There are two trend lines supporting the current rally.  Prices are approaching both.  While momentum is dropping, the risking CMF is positive. 

It's still way too early to get excited about he UK.  We've only got a few months of data compared to a horrendous track record over the last three years.  Also remember this is an economy that is providing a great example of why austerity is a bad idea. 

Monday, January 28, 2013

UK Continues to Prove That Austerity Doesn't Work

The UK began implementing it's austerity program in 2010, under the theory that rampant budget deficits were destroying public confidence in the UK economy.  Therefore, the reasoning goes, if the UK cleaned up their fiscal act, the economy would return to full employment.

Here is a pie graph of UK spending for the years 2010-2012 which comes from the publicly available budget documents at the HM Treasury's website.


Total spending has fluctuated between 683 billion pounds in 2012 and 710 billion pounds in 2011 -- a situation which is consistent with the US experience over the same time.

Over the same period, we see the following GDP figures:


In the fourth quarter of 2010, we see a contraction.  In fact, since 4Q10, there have only been three quarters of positive economic growth.  As the Financial Times Reported:

The economy, which has essentially stagnated for 2½ years, pulled out of a shallow double-dip recession in the third quarter of 2012, but contracted again between the third and the fourth quarter by more than the expected 0.1 per cent. The economy was the same size in the fourth quarter as it was a year earlier.
“It remains too early to tell if the economy will triple-dip [which would require the economy to shrink again in the first quarter of this year], but today’s numbers have greatly increased the risk of a new recession and a downgrading of the UK’s triple A credit rating,” said Chris Williamson, an economist at Markit, a data company. “As such, the data pile ever more pressure on the chancellor to seek ways to revive the economy in the March Budget.

As a result of this slow growth, the IMF is advising the UK to halt austerity measures:

The IMF chief economist has told the BBC that Chancellor George Osborne should consider slowing down austerity measures in his March budget.

"We think this would be a good time to take stock," said Olivier Blanchard, speaking to Radio 4's Today programme.

He also said the global economy was "not out of the woods yet".

In October, Mr Blanchard claimed in an IMF report that austerity had hurt wealthy countries such as the UK far more than most analysts had expected.

His comments come the day after the IMF cut its 2013 forecast for UK economic growth to 1% from the 1.1% predicted in October, and will put pressure on the chancellor as he prepares to deliver a speech at the World Economic Forum in Davos later on Thursday.


The IMF is making this recommendation, largely because they have now determined that the multiple associated with government spending is in fact far larger than they originally calculated.

In “Growth Forecast Errors and Fiscal Multipliers,” Messrs. Blanchard and Leigh calculate IMF and European economists underestimated the euro-for-euro effect of cutting government budgets. While economists expected that cutting a euro from the budget would cost around 50 cents in lost growth, the actual impact was more like 1.50 per euro.

Put another way, for every dollar cut ($1) the economy loses about $1.5 of growth.  This is entirely in line with the general thinking mentioned in my old (and very torn) Paul Samuelson Econ text from college.


Thursday, December 20, 2012

What's Wrong With the UK Economy?

Last week, I looked at the UK economy's problems.  Here are some more great observations:

    The UK government debt has low interest rates now because growth is low and demand for safe assets is high. British interest rates decline in response to bad news on growth, and market measures of the riskiness of gilts increase when interest rates and growth drop.  The opposite should hold – rates and market risk should rise together – if indebtedness were markets’ concern.  They don’t and it isn’t.

    Private UK businesses have kept adding workers in recent years (albeit some part-time or temporary) because they view future prospects as unchanged or better.  Employers only increase staff in a flexible decentralized labour market like Britain’s when they think wage costs are competitive.  The opposite should hold – declining growth and wages should lead to permanent cuts in employment – if UK potential growth was down for most businesses.  They didn’t and it isn’t.

    The spreads between the interest rates that small businesses and first time mortgage borrowers must pay for loans versus established large borrowers, and the fees that those new borrowers are charged have gone up and stayed up.  If there were lack of demand for investment, the interest rates and fees that banks could charge for loans would be declining – they are rising instead.

    Sterling has been stable in value since its 2008 depreciation, and foreign direct investment continues to pile in to such industries as auto manufacturing and fancy foods as well as business services.  If the lack of investment were due to doubts about government solvency or business competitiveness, capital would be flowing out of the UK and the pound would be declining.  The opposite is the case.

    Cuts in government spending and increases in taxation have had large effects per pound on consumption and growth overall (far larger than the Government, the MPC, and the OBR projected).  That occurs when confidence is being beaten down rather than raised up by fiscal consolidation.  If lack of confidence in government finances were a major weight on British households and businesses, the direct drag from fiscal contraction would be offset (if not reversed) by a rise in investment.  Again, the opposite is the case, and no such confidence effects have been seen.