- by New Deal democrat
In the past, industrial production has been the King of Coincident Indicators, since its peaks and troughs tended to coincide almost exactly with the onset and endings of recessions. That weighting has faded somewhat since the accession of China to the world trading system in 1999 an the wholesale flight of US manufacturing to Asia, generating several false recession signals, most notably in 2015-16. But it is still an important coincident measure in the economy.
This month was one of those times where revisions made all the difference. Last month I headlined my note by pointing out that both manufacturing and total industrial production were reported near 10 year highs. But this morning both of those numbers were revised down significantly, and this month was reported down -0.3% for manufacturing and -0.6% for total production (graph normed to 100 as of pre-pandemic high water mark):
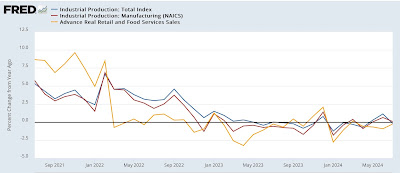
As a result, both series, which had climbed into positive YoY territory, are now back down slightly:
In the above graph, I’ve also added the updated YoY real retail sales YoY data (gold), which shows that both the production and real sales numbers have been flat to trending slightly downward since the end of the last pandemic stimulus over two years ago, with production following sales, as per usual, with a few months’ delay.
Earlier this month I noted that construction is now the pre-eminent element holding up the goods-producing sector of the economy. That’s important because once the goods-producing sector as a whole turns down, the economy as a while typically follows shortly thereafter.
Tomorrow we will get the report on housing, including housing units under construction. If that metric continues to decline, that spells trouble for construction as a whole.

