- by New Deal democrat
This morning brought us both good and bad economic news.
The good news was that initial jobless claims continue very low, at 209,000, down -1,000 from last week, while the four week average declined -500 to 208,000. Even better, after major downward revisions, continuing claims rose 17,000 to 1.811 million:
Recall that continuing claims had been reported over 1.900 million, so as I said above, this was major!
On the more important YoY basis for forecasting, initial claims are down -14.3%, the four week average down -7.2%, and continuing claims, which before revisions had been running at about 10% higher YoY, are now only up 2.2%:
This is all very positive for continued good employment numbers in the months ahead (but see my next post today!).
Last week the unemployment number very much did NOT do what I expected, which was to remain steady or decline. Instead it rose to a new 2+ year high of 3.9%. I wondered whether, because unemployment includes both new and existing job losses, it followed continuing claims more than initial claims (although initial claims lead both).
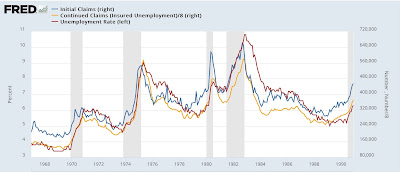
Here’s the long term pre-pandemic trend (divided into two parts for easier viewing)(continuing claims /8 for scale):
Historically, as I’ve always pointed out, initial claims lead both continuing claims and the unemployment rate. The above graph shows that continuing claims also lead the unemployment rate, although with much less of a lead time.
So here is the post-pandemic record:
The divergence between initial and continuing claims beginning this past autumn looks like it indeed has passed through into the unemployment rate. Since the historical record remains that initial claims lead continuing claims, and in the past three weeks (post revisions!) continuing claims have declined sharply, we’ll see how this shakes out after the full month of March.


