- by New Deal democrat
Yesterday I wrote “The median price of a new home increased 1.7% in June (not seasonally adjusted), and remained sharply higher YoY at 15.1%.”
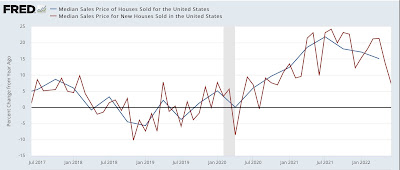
That’s true, but it wasn’t complete. The 15.1% figure is from the quarterly average. On a monthly basis, the YoY% change was 7.4%. Here are the monthly and quarterly figures together:
The monthly change is not seasonally adjusted, so my rule of thumb for peaks and troughs is that, when the rate of change is less than half the maximum YoY, the market has most likely turned. The biggest YoY% change in the past year was 24.2% last August, which means there has probably been a turn in the market.
But note that the monthly data, even YoY, is very noisy. For more confidence, we should at least average two months together. On that basis, the biggest YoY change was 23.7% for last July and August. This May and June together averaged 10.6%, so even on that basis it appears more likely than not that new home prices have peaked.
If so, this is the first of the four series (new home sales, existing home sales, the FHFA price index, and the Case Shiller price index) to have turned.
